4099
Physically Implausible Diffusion Signals (PIDS) as a Quality Assessment Metric in Prostate DWI1Research Computing Center, The University of Chicago, Chicago, IL, United States, 2Department of Radiology, The University of Chicago, Chicago, IL, United States, 3Philips Research North America, Chicago, IL, United States
Synopsis
Diffusion weighted imaging (DWI) is important for prostate cancer diagnosis but is highly sensitive to artifacts. We developed a method for automatically and quantitatively measuring physically implausible DWI signals (PIDS) that could contribute to diagnostic errors. The level of PIDS is significant and similar in all prostate zones, for scans both with and without an endorectal coil, and is strongly correlated with motion. For scans without the endorectal coil, PIDS is correlated with noise level. In regions with a high percentage of PIDS, PIRADS II criteria may not be optimal, and algorithms that emphasize T2 and DCE-MRI may be preferable.
INTRODUCTION
Diffusion weighted imaging (DWI) is the most important but also, unfortunately, the most sensitive component of mpMRI. DWI is susceptible to system noise, motion, geometric distortion, eddy currents and Gibbs artifacts1. These factors can lead to generation of physically implausible diffusion signals (PIDS) that can introduce diagnostic inaccuracies. The need for quality control/assurance programs has been emphasized by the European Society of Urogenital Radiology and ACR PIRADS Committee2. We developed a method for automatically and quantitatively measuring PIDS, defined as any voxel where: (1) the diffusion signal increases despite an increase in b-value; and/or (2) the apparent diffusion coefficient (ADC) is higher than 3.0 um2/ms (water ADC at 37ºC).METHODS
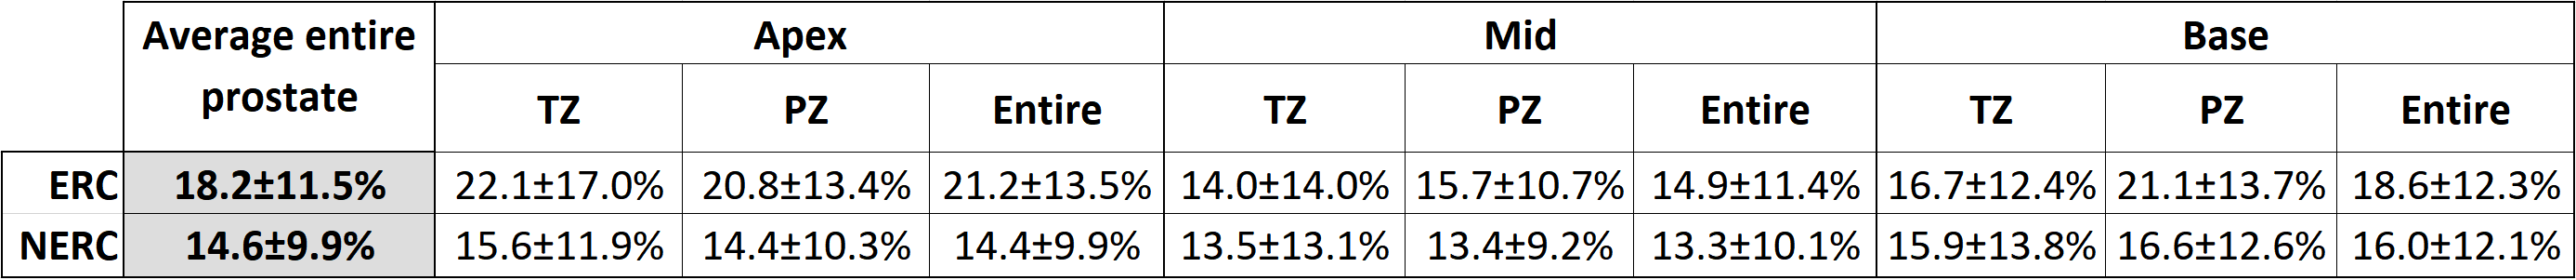
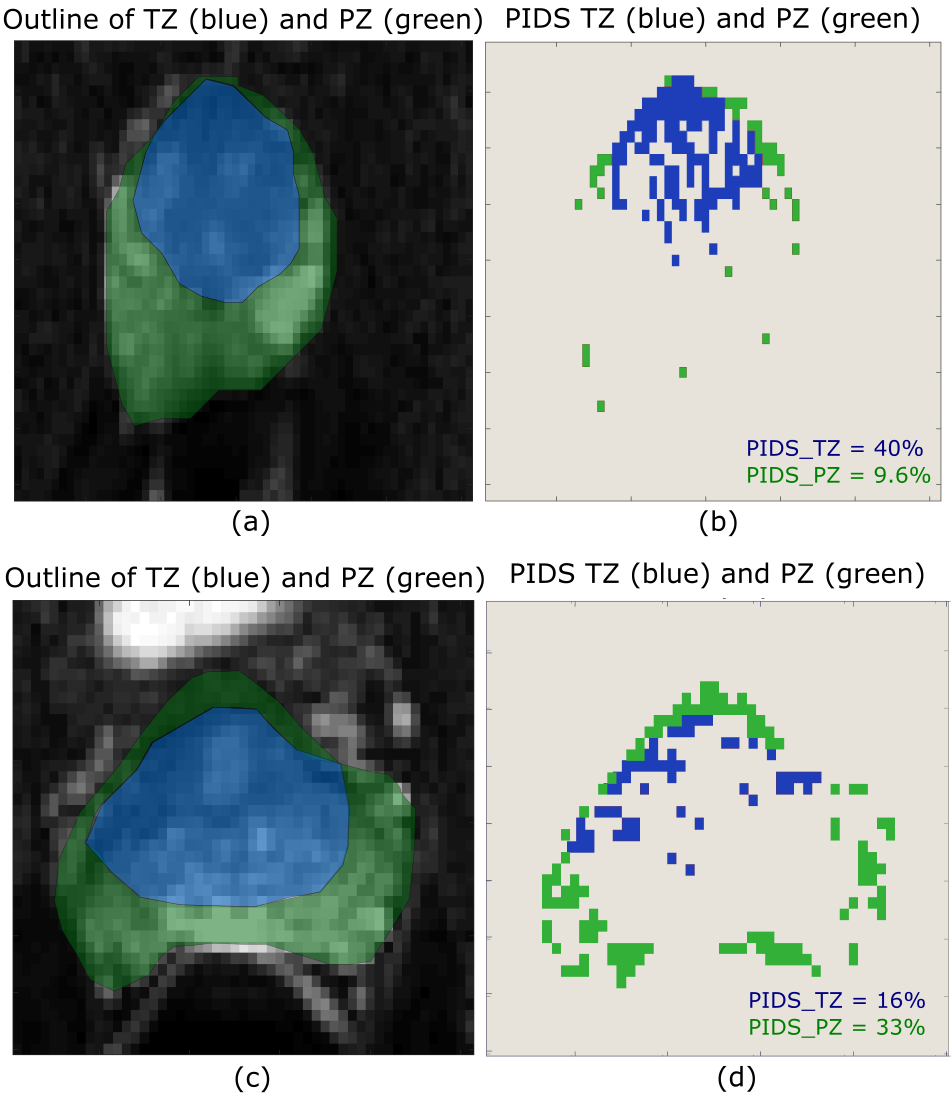
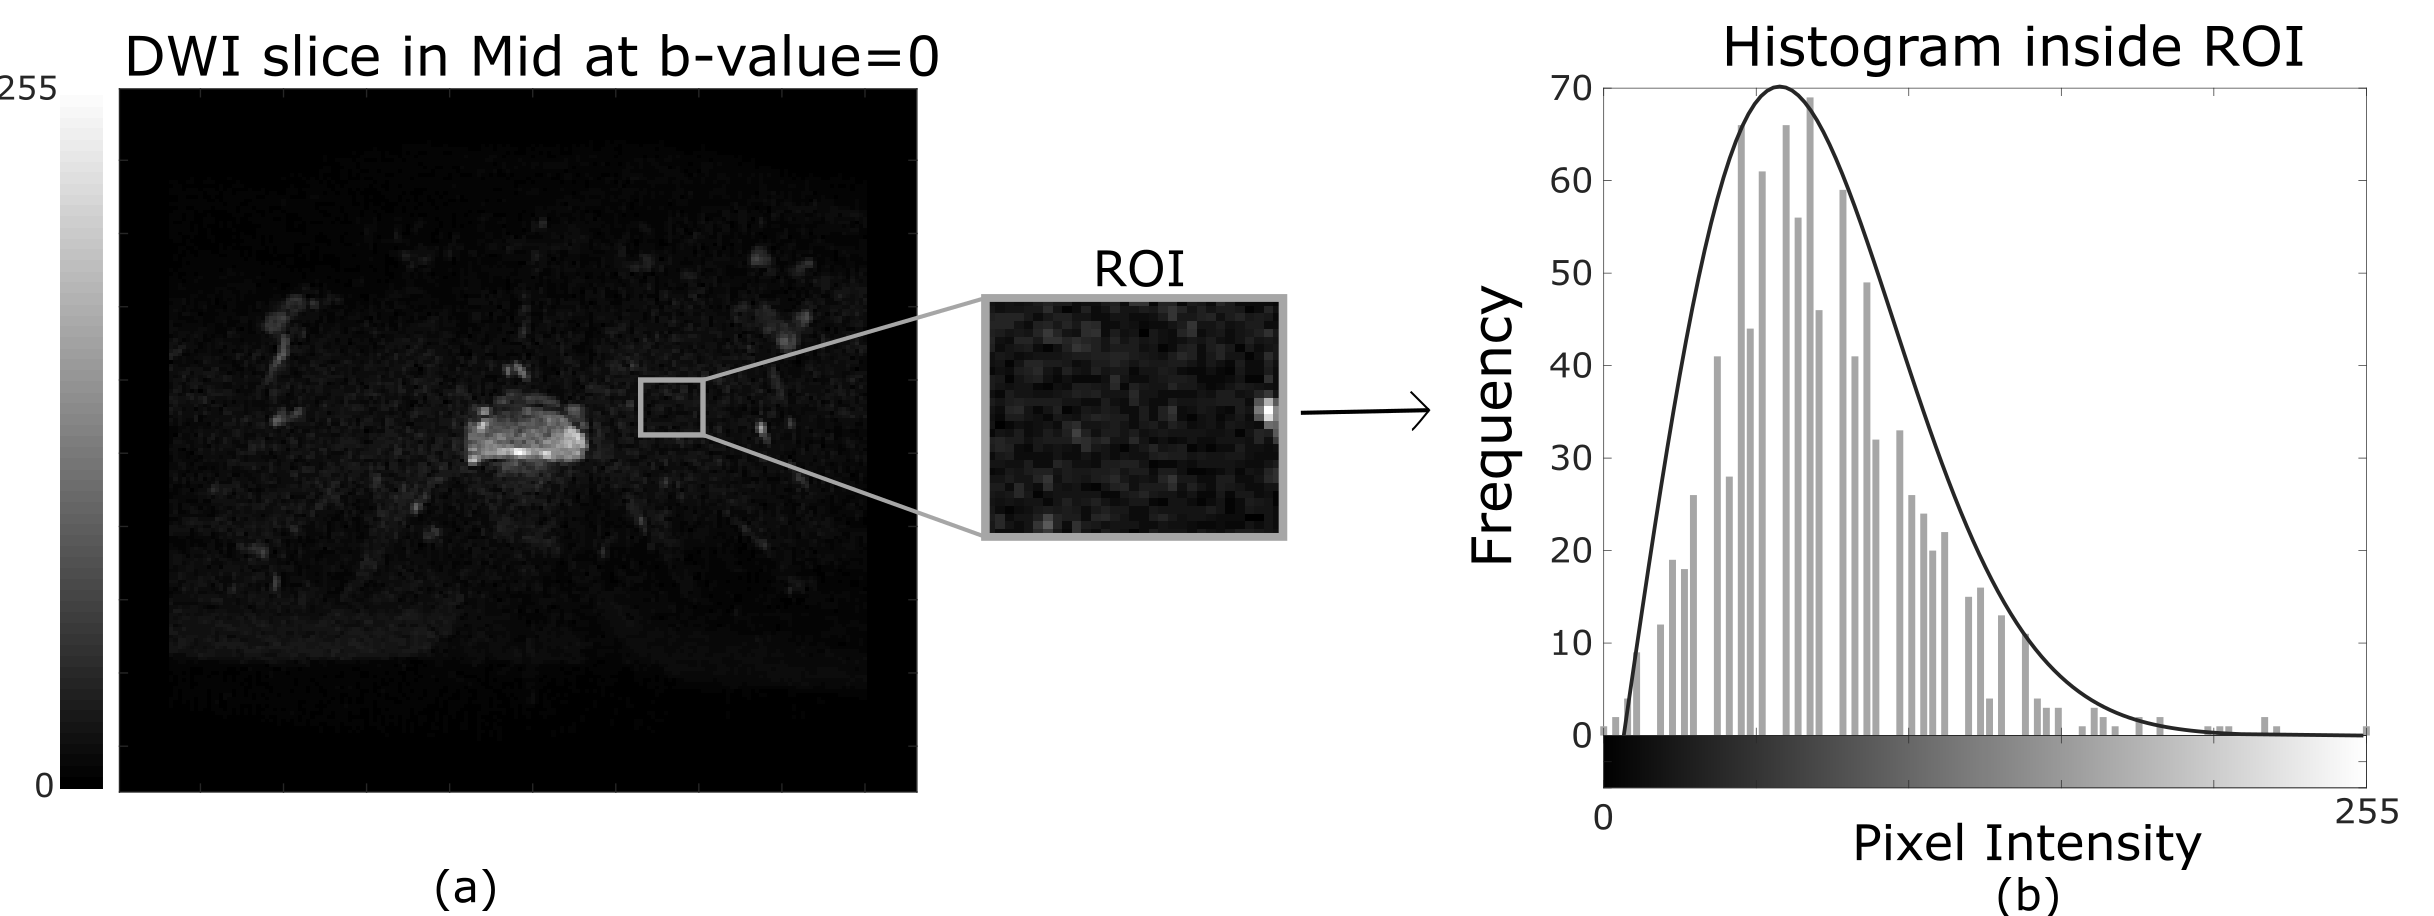
In this IRB-approved retrospective study, we recruited 40 subjects for prostate MRI scans using an endorectal coil (ERC) and 40 subjects scanned without an ER coil (NERC), on a Philips 3T dStream Ingenia scanner. Diffusion-weighted images were acquired using b-values = 0, 50, 150, 990, 1500 s/mm2 for the cohort with the ER coil, and b-values = 0, 600, 1200 s/mm2 for the cohort without the ER coil. For each DWI dataset, a radiologist selected 3 representative slices (from apex, mid, and base), and in each slice outlined the transition zone (TZ), peripheral zone (PZ) and entire prostate. The percentage of PIDS for TZ and PZ was calculated using an in-house MATLAB program. Figure 1 shows two representative slices illustrating different distributions of PIDS in TZ and PZ. The Rician noise (RN) level in each slice was calculated using the skewness and the variance over a region of interest (ROI) adjacent to the prostate with very low signal, according to a previously published method3 (Figure 2a). The noise levels follow a Rayleigh distribution (Figure 2b). We visually inspected all the DWI images for gross motion (GM), as evident in individual slices, for motion observed between acquisitions of consecutive b-values (BM), and for geometric distortion (GD), and scored these artifacts using a 10-point Likert scale (0 = image quality not affected and 10 = extremely affected). We compared the histogram distributions of PIDS and RN in ERC and NERC cohorts using the chi-squared test. The differences between PIDS levels in ERC vs NERC cohorts were assessed using t-test. The differences between PIDS levels in the 3 anatomic zones of the prostate were assessed using ANOVA. We assessed the relationships of PIDS to RN values and GM, BM, and GD scores using the Pearson correlation coefficients. The level of statistical significance was set to 0.05.RESULTS
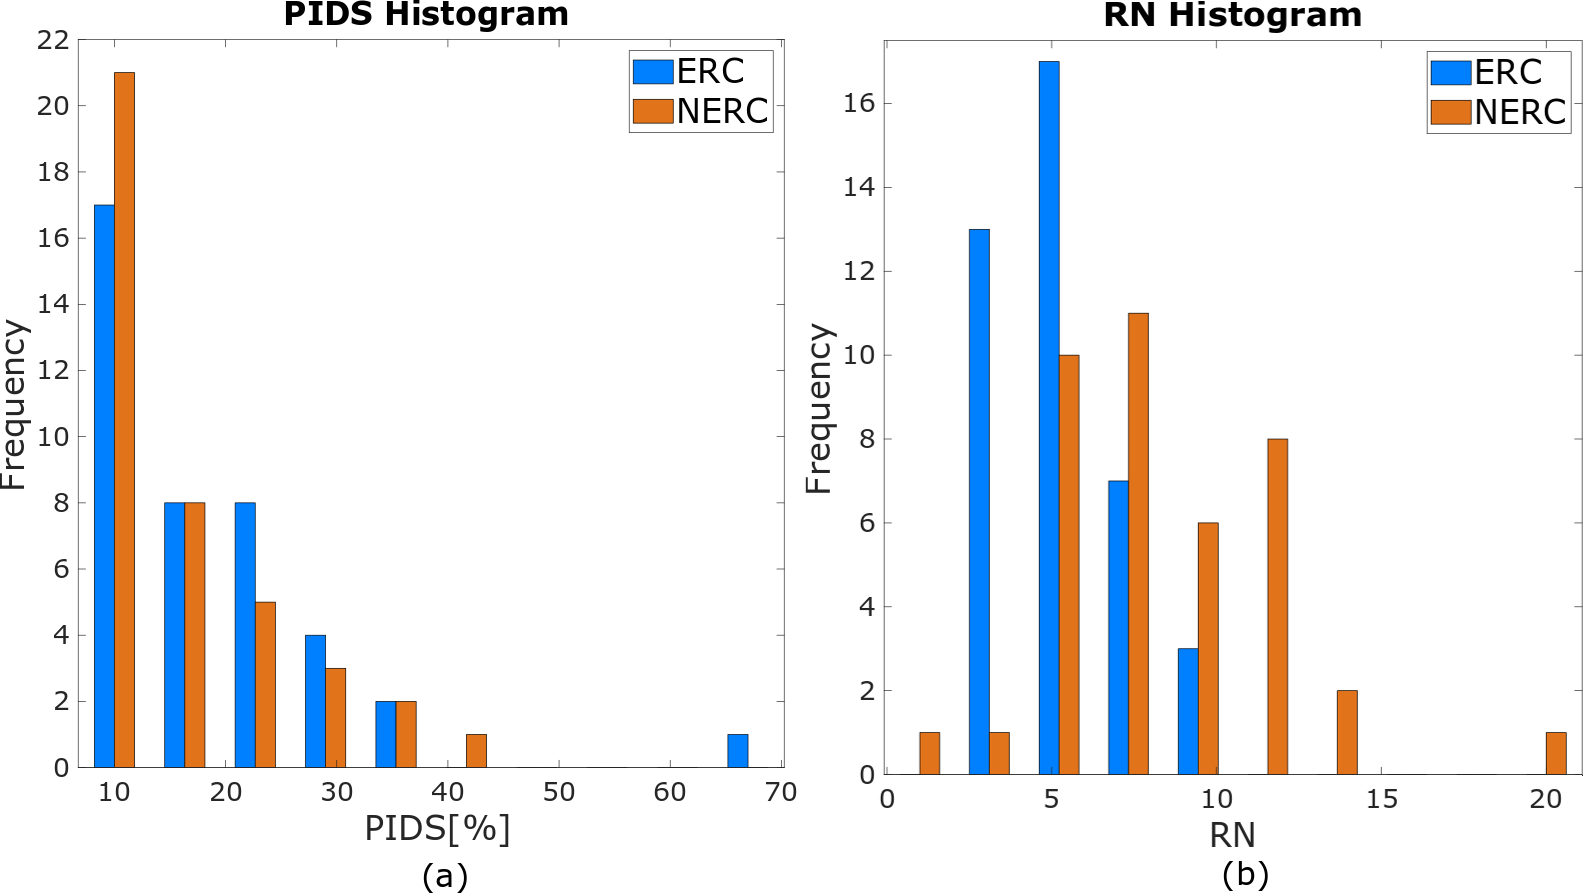
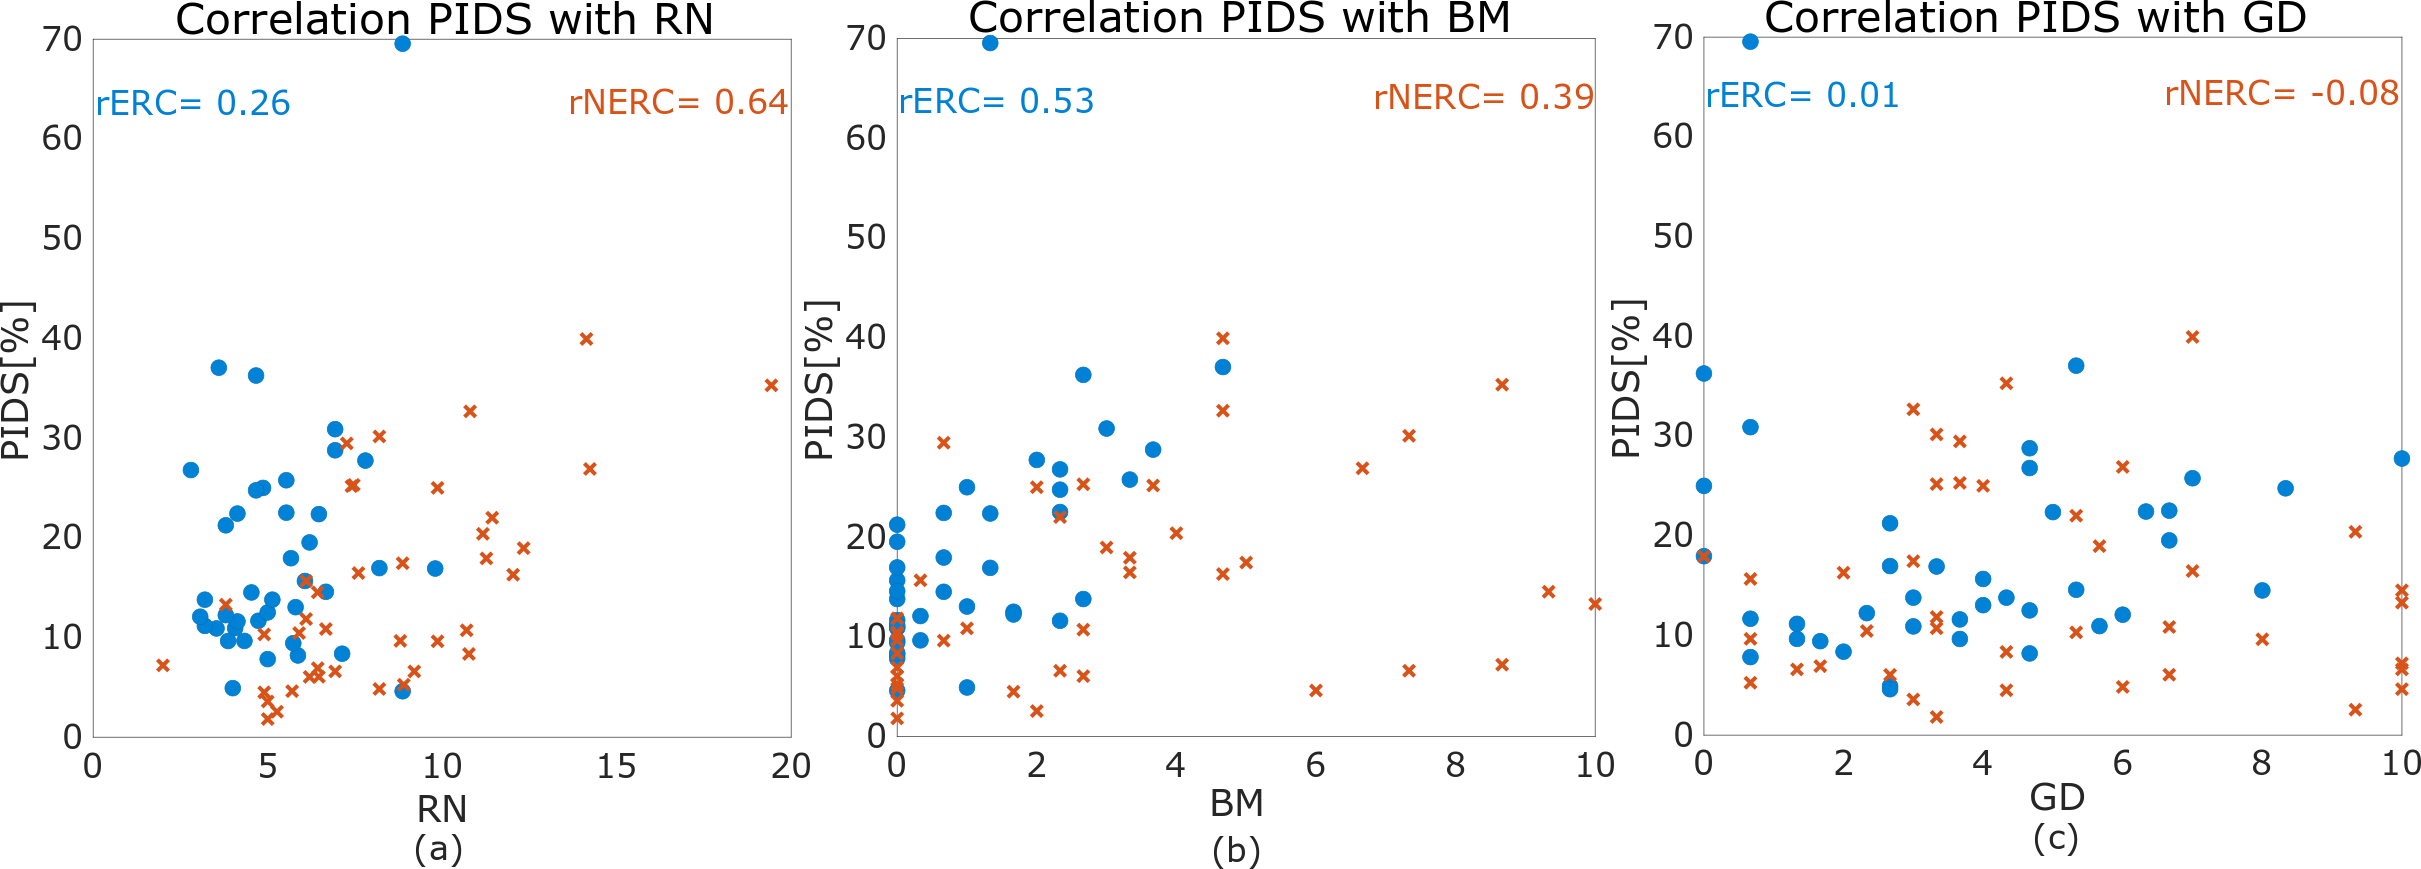
PIDS levels over the entire prostate were similar at 14% for the NERC cohort and 18% for the ERC cohort (p = 0.13) and did not differ across prostate zones (p = 0.12). Apex, mid, and base showed similar percentages of PIDS in both the ERC (p=0.08) and NERC (p=0.54). The percentage of PIDS in the TZ was also similar (p=0.12) in the ERC and NERC. PIDS histogram distributions over the entire prostate and RN levels for the two cohorts are shown in Figure 3. PIDS distributions do not differ between the ERC and NERC cohorts (p=0.35). There is more RN in the NERC (RN = 8.34±3.33) compared to ERC (RN = 5.36±1.73) (p < 0.01). There is strong correlation between PIDS and RN for NERC (r = 0.64, p = 9e-06), but not for ERC (r = 0.26, p=0.1; Figure 4a). PIDS is correlated with motion between different b-values for both ERC and NERC (r = 0.39, p = 0.01 and r = 0.53, p=4e-04; Figure 4b). PIDS did not correlate with distortion in DWI image, the correlation coefficient being close to 0 for both ERC and NERC (Figure 4c). Radiologist’s qualitative assessment of image quality revealed that diffusely high PIDS coincided with BM, according to the assigned likelihood scores (Figure 4b). Focally high PIDS coincided with T2 hypointense foci (prominent anterior fibromuscular stroma, low signal bands, prominent hypointense BPH nodules, and thick pseudo-capsules). Focally high PIDS also coincided with artifacts due to abrupt changes in tissue composition (e.g., at the interface between fat and thick capsule), or excess air in the rectum.DISCUSSION
PIDS levels over the entire prostate were similar for the ERC and NERC cohorts, and did not differ across prostate zones. However, PIDS was focally much higher in specific prostate zones. Figure 1b shows very high PIDS in the TZ. Radiologist’s evaluation demonstrated that PIDS is associated with T2 hypointense regions, sharp tissue interfaces, and motion artifacts. PIDS analysis demonstrates that DWI is not a reliable diagnostic tool in certain prostate regions for a significant fraction of patients. High PIDS vary from patient to patient. However, the PIDS analysis demonstrated here can show Radiologists the regions where DWI is not useful. In these regions, standard PIRADS II criteria may not be optimal, and other methods can be developed to guide diagnosis, with weight placed on T2-weighted images and dynamic contrast enhanced MRI.CONCLUSIONS
Current study presents a quantitative, objective method for identifying PIDS in prostate DWI. This is important information that can be used to guide Radiologic evaluation of prostate scans. PIDS could be used to select the diagnostic algorithm used in each prostate zone.Acknowledgements
This research is supported by National Institutes of Health (R01 CA172801, R01CA218700, 1S10OD018448-01), University of Chicago Comprehensive Cancer Center Support Grant (Grant No. P30CA014599), and the Sanford J Grossman Charitable Trust.References
[1] Sadinski M, Medved M, Karademir I, Wang S, Peng Y, Jiang Y, Sammet S, Karczmar G, Oto A. Short-term reproducibility of apparent diffusion coefficient estimated from diffusion-weighted MRI of the prostate. Abdom Imaging. 2015 Oct;40(7):2523-8. doi: 10.1007/s00261-015-0396-x. PMID: 25805558; PMCID: PMC4918747.
[2] Padhani, A.R., Schoots, I.G., Turkbey, B. et al. A multifaceted approach to quality in the MRI-directed biopsy pathway for prostate cancer diagnosis. Eur Radiol (2020). https://doi.org/10.1007/s00330-020-07527-9
[3] J. Rajan, D. Poot, J. Juntu, J. Sijbers, Noise measurement from magnitude MRI using local estimates of variance and skewness, Phys. Med. Biol., 55 (2010), pp. 441-449
Figures