4098
Differential diagnosis of PCa and BPH using intratumoral susceptibility signal intensities based onESWAN1The First Affiliated Hospital of Dalian Medical University, Dalian, China, 2Dalian University of Technology, Dalian, China
Synopsis
It remains a challenge to diagnose differentiate PCa from BPH due to their similar clinical symptoms. The aim of this study was to evaluate the value of intratumoral susceptibility signal intensities (ITSS) in differentiating PCa and BPH based on enhanced T2 star-weighted angiography (ESWAN). The diagnostic efficiency was promising well in quantitatively and automatically differentiation of PCa from BPH by ITSS based on ESWAN.
Introduction
Prostatic cancer (PCa) is the second most common cancer in men and the sixth leading cause of death 1. Sometimes, it is difficult to distinguish PCa from benign prostatic hyperplasia (BPH) 2. It is necessary to accurate and timely diagnosis of PCa. Anoxia is considered to be one of the important tumor features. Susceptibility weighted imaging (SWI) is a promising technique to reflect calcification, hemorrhage and increased vascularity, which may diagnose PCa 3. ESWAN is a SWI-based MR technology, which is novel and non-invasive. We hypothesize that it's practicable to differentiate PCa and BPH by ITSS.Purpose
To investigate the potential of ITSS based on ESWAN in the differentiation of prostate cancer and prostatic hyperplasia.Materials and Methods
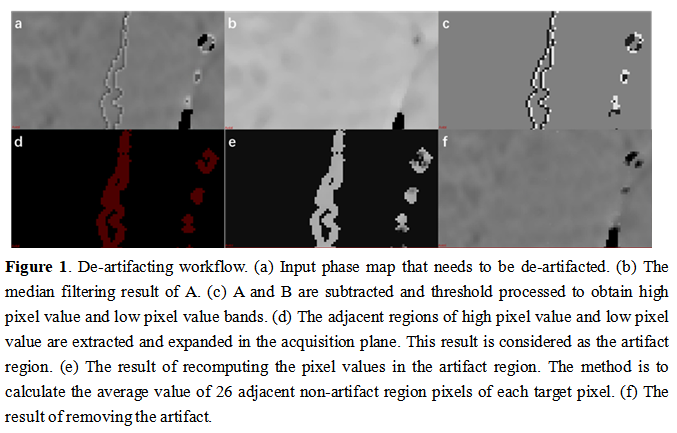
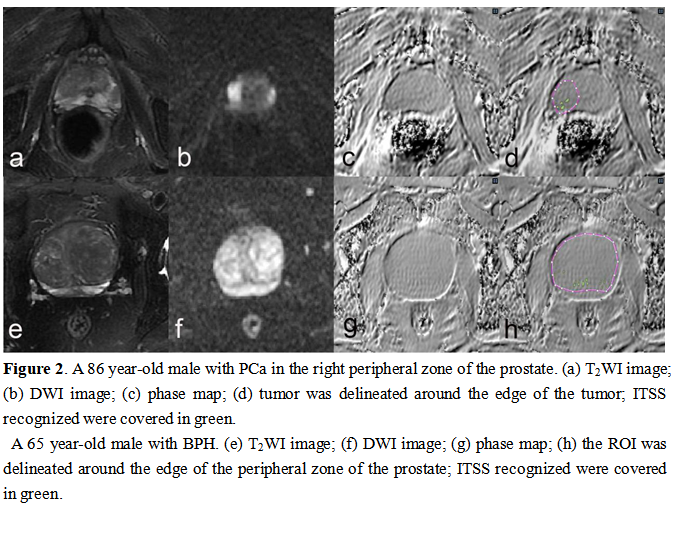
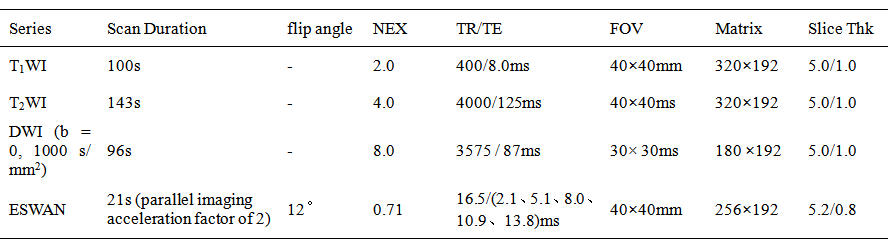
A total of 77 patients were included in the analysis. According to pathology, the patients were categorized into two groups: PCa Group (n=38, mean age 74.05±8.85) and BPH Group (mean age 69.59 ± 8.80 years). All patients underwent preoperative pelvic 3.0 T MR scanning (Signa HDxt, GE Medical Systems, USA), including T1WI, T2WI, DWI and 3D gradient echo (GRE) ESWAN sequence. Detailed MR scanning parameters were listed in Table 1. All images on ESWAN sequence were transferred to the GE AW 4.6 workstation for post-processing in Functool software. Due to the acquisition, there are banding artifacts in the phase image as shown in Figure 1 (a). Therefore, the workflow shown in Figure 1 is first used to remove artifacts from the input phase map. The workflow is as follows: (i) Firstly, the abnormal pixels with high gray value and low gray value in the phase map are detected; (ii) Then, the artifact region is determined according to the feature of adjacent pixels of high pixel value and low pixel value; (iii) Finally, the pixel values in the artifact region are recalculated according to the gray values of the surrounding non-artifact pixels. Phase map after using batch program to remove artifacts were exported as NII format, and transmitted to AnatomySketch (AS) software, which is programmed using C++ based on Qt and VTK libraries (Dalian University of Technology).In prostatic cancer, by referencing to T2W and DW images, regions of interest (ROIs) were delineated around the edge of the tumor on phase maps; in benign prostatic hyperplasia, by referring to the anatomical information obtained on T2W images, ROIs were delineated around the edge of the central zones on the axial slice showing the largest area of the prostates (Figure 2). ROI can be obtained without layer-by-layer annotation through the interpolation and annotation tools of AS. Subsequently, the AS software can automatically calculate the ITSS ratio of the phase maps. ITSS ratio was defined as the ratio of ITSSs to the lesion involving area on tumor maximal axial section [4]. SPSS 25.0 software was used to analyze all statistic data. Normal distribution was tested by Shapiro-Wilks test. Intraclass correlation coeffcient (ICC) was used to evaluate the consistency of ITSS values measured by two radiologists. The difference of ITSS values between PCa and BPH were compared using Mann-Whitney U test. Receiver operating characteristic (ROC) analysis was performed to evaluate diagnostic performance.Results
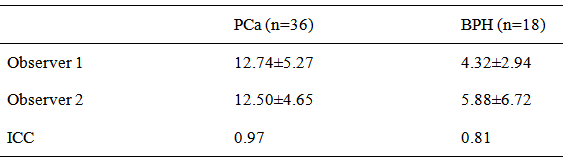
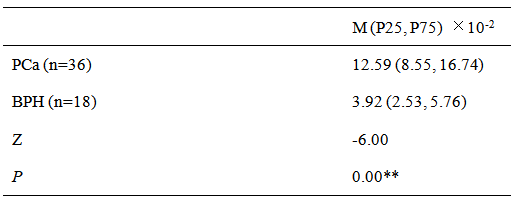
Measurement consistency between the two observers was good (ICC > 0.75, Table 2). The ITSS values of the PCa Group were significantly higher than those of the BPH Group (Table 3). As for ROC curves, the AUC values of ITSS is 0.897 (Figure 3). When setting the threshold value to be 0.0691, the corresponding diagnostic sensitivity and specificity would be 0.895 and 0.846.Discussion and Conclusion
The study demonstrated that quantitative ITSS had good diagnostic efficiency to differentiate PCa and BPH. Theoretically, due to the rapid proliferation of tumor cells, tumor undergone hypoxic condition is more significant than benign tissue, which is more likely to induce neovascularization and necrosis. ESWAN is a SWI-based magnetic reseonance method, which can reflect calcification, hemorrhage and increased vascularity, then indirectly reflect hypoxia of tissue. In the present study, we proposed that ITSS could be a promising imaging biomaker that allow differentiate PCa and BPH quantitatively and automatically.Acknowledgements
No acknowledgement found.References
[1] Torre LA, Bray F, Siegel RL, et al. Global cancer statistics, 2012 [J]. CA: a cancer journal for clinicians, 2015, 65(2): 87-108.
[2] Chatterjee A, Thomas S, Oto A. Prostate MR: pitfalls and benign lesions.[J] .Abdom Radiol (NY), 2019, undefined: undefined.
[3]Yang, X., Zhu, J., Dai, Y., et al. Multi-parametric effect in predicting tumor histological grade by using susceptibility weighted magnetic resonance imaging in tongue squamous cell carcinoma. BMC medical imaging, 2019;19(1), 24.
[4] Park, S. M., Kim, H. S., Jahng, G. H., et al. Combination of high-resolution susceptibility-weighted imaging and the apparent diffusion coefficient: added value to brain tumour imaging and clinical feasibility of non-contrast MRI at 3T. The British journal of radiology, 2010;83(990): 466–475.
Figures