4097
Non-Invasive Prostate Metabolic and Cytometric Imaging: Insights from Activity MRI [aMRI]1Advanced Imaging Research Center, Oregon Health & Science University, Portland, OR, United States, 2Urology, Oregon Health & Science University, Portland, OR, United States, 3Radiology, Oregon Health & Science University, Portland, OR, United States, 4Urology, Portland VA Center, Portland, OR, United States
Synopsis
The first aMRI [activity MRI] parametric maps of malignant prostate are presented. They show the differences in cell density [r (cells/μL)], average cell volume [V (pL)], and on-going metabolic activity across the prostate. Metabolic activity is represented by the mean steady-state cellular water efflux rate constant [kio (s-1)], which reflects homeostatic cytolemmal Na+,K+-ATPase [NKA] enzymatic turnover [fmol(ATP)consumed/s/cell]. In a known Gleason (3 + 4) tumor, r is increased, while V and kio are decreased – relative to normal-appearing tissue. Such changes are sensible, and these new biomarkers may be diagnostic and/or predictive.
Introduction
Considerable evidence has accumulated that cell membrane water permeability, expressed as the steady‑state cellular efflux rate constant [kio], has a significant contribution from cytolemmal Sodium Pump enzymatic turnover.1 The strongest evidence comes from in vitro and ex vivo model studies in which the extracellular paramagnetic contrast agent concentration, [CAo], can be made large enough for the shutter-speed to necessarily reach kio + koi, where koi is the influx rate constant. In vivo, this is more challenging, since [CAo] cannot be made large and, at the same time, koi is larger [often 4kio] than in models.1 A Monte Carlo random walk [RW] simulation of CA-free DWI data has been reported.2,3 It employs digital ensembles of randomly shaped/sized [“Voronoi”] cells characterized by realistic cell density [ρ] and average cell volume [V] values. The kio value is effectuated during the RW.2,3 Since kio reflects Na+,K+-ATPase [NKA] enzyme activity,1 this method is called activity MRI [aMRI]. We use a library of aMRI-simulated DWI decays to analyze the malignant prostate.Methods
IRB-approved, signed informed consent was obtained from a volunteer cancer patient. A Prisma 3T instrument [Siemens] using a single-shot 2D EPI SDE DWI sequence4 and three sequential orthogonal bipolar [twice-refocused] PFGs yielded DT trace-averaged data. Siemens software numerically calculates b values for the constant diffusion time (36 ms). Using an endorectal RF coil, fifteen b values, 0 to 5000 s/(mm)2, were collected [0 and those >150 were used for analyses]. DWI was >6 weeks after a biopsy procedure. The ~4000 voxels had nominal dimensions [0.8 x 0.8x3 (mm)3; 1.9 μL] from a 240x240 (mm)2 FOV [TR/TE/5100(ms)/91(ms)]. Apparent diffusion coefficients [ADCs] were evaluated at b = 1000 s/(mm)2.Results
Figure 1 shows axial image slice maps [inferior perspective]. In the ADC map (a), the sub-cm Gleason (3+4) lesion is the circled low ADC region, image left: ADC <0.001 mm2/s is characteristic of serious prostate cancer.5 Bright [ADC approaching 0.003 (pure water)] regions represent eurethral- and ductule‑rich areas in this slice.To produce aMRI parametric maps, we used independent prior knowledge to constrain aMRI library entries eligible for data matching. Since Gleason score correlates positively6 and 2D histopathological “cellularities” negatively7 with ADC, we posited a negative ADC/ρ relationship. The ρ range deemed eligible for each pixel has a center value based on its ADC magnitude, and is limited to a factor of ± two. Of course, the ρ range entries include many different kio and V values. Weighted least-squares comparisons between de-noised8,9 experimental and eligible library decays were made. Parameter values were set to zero for pixels with ADC ~0.003: in pure water, ρ = V = 0, and kio is undefined.
Panel (b) shows the lesion and normal-appearing [NA] prostate having ρ‘s centered near 8x10⁵ and 3.5x10⁵ cells/μL, respectively, well within estimates we make from published 2D cellularities;6 broad malignant distribution centered near 6.6x10⁵; narrow NA distribution centered near 105 cells/μL. The lesion conspicuity in the in vivo ρ map has considerable diagnostic potential. It is matched only by ex vivo cellularity maps.6 However, the treatment utility of the latter is mostly nullified by the necessity for prostatectomy.
The significance of the V map (c) is just as high. The lesion has very small cells near 1 pL,10 densely packed, while NA regions have cells near 4 pL. Again, these are generally consistent with ex vivo tissue studies.6,10,11-14 The unrealistically large V values [9 pL] near the urethra and ductule-rich regions surely result from partial volume averaging in those voxels.
The kio map (d) represents an in vivo image of on-going metabolic activity obtained non‑invasively. The NA glandular tissue kio [35-50 s-1] is consistent with an early finding15 that much of NA kio exceeds the maximum [~10 s-1] for in vivo CA. The lesion is a clear cold spot, with smallest kio reduced to near 20 s-1. This suggests metabolic activity is significantly compromised in the lesion. The unrealistically large kio values [70 s-1] near the urethra and major ductule regions most likely also result from partial volume averaging in those voxels: kio blows up for very small r and/or V. This may in itself be clinically useful.
Discussion
The novel metabolic and cytometric biomarker values in the tumor make sense, and have diagnostic promise. Perhaps the NA tissue foci with increased ρ [Fig. 1b] and decreased V [Fig. 1c] presage nascent cancer proliferation – before tightly-packed beds of cancer cells compete each other’s NKA activity down.16 If that holds up, aMRI could have prostate cancer screening promise.Acknowledgements
We thank the Brenden-Colson Center for Pancreatic Care for support.References
Li X, Mangia S, Lee J-H, Bai R, Springer CS, “NMR Shutter-Speed Elucidates Apparent Population Inversion of 1H2O Signals Due to Active Transmembrane Water Cycling,” Magn. Reson. Med. 2019; 82: 411-424. [DOI: 10.1002/mrm.27725]
Baker, EM, Moloney B, Li X, Gilbert EW, Springer CS. “Random Walks in Stochastic Geometries.” Proc. Int. Soc. Magn. Reson. Med. 2019; 27: 3612.
Moloney B, Baker EM, Li X, Gilbert EW, Springer CS. “Fundamental cell biology properties underlying in vivo DWI.” Proc. Int. Soc. Magn. Reson. Med. (2020) 28: 4506.
Feiweier T. “Bipolar Diffusion Encoding with Implicit Spoiling of Undesired Coherence Pathways,” Proc. Int. Soc. Magn. Reson. Med. 2011; 19: 178.
Henderson DR, de Souza NM, Thomas K, Riches SF, Morgan VA, Sohaib SA, Dearnaley DP, Parker CC, van As NJ. “Nine-year follow up for a study of diffusion-weighted magnetic resonance imaging in a prospective prostate cancer active surveillance cohort.” Eur. Urology (2016) 69: 1028-1033.
Reynolds H, Williams S, Zhang A, Ong CS, Rawlinson D, Chakravorty R, Mitchell C, Haworth A. “Measuring cell density in prostate cancer imaging as an input for radiotherapy treatment planning.” EPOS (2014a) R‑0262. [DOI: 10.1594/ranzcr2014/R-0262]
Manetta R, Palumbo P, Gianneramo C, Bruno F, Arrigoni F, Natella R, Maggialetti N, Agostini A, Giovagnoni A, Di Cesare E, Splendiani A, Masciocchi C, Barile A. “Correlation between ADC values and Gleason score in evaluation of prostate cancer: multicentre experience and review of the literature.” Gland Surg. (2019) 8(Suppl 3): S216-S222.
Veraart J, Novikov DS, Christiaens D, Ades-Aron B, Sijbers J, Fieremans E. “Denoising of diffusion MRI using random matrix theory.” Neuroimage. (2016) 142: 394-406.
Does MD, Olesen JL, Harkins KD, Serradas-Duarte T, Gochberg DF, Jespersen SN, Shemesh N. “Evaluation of principal component analysis image denoising on multi-exponential MRI relaxometry.” Magn. Reson. Med. (2019) 81:3503-3514.
Xu J, Jiang X, Li H, Arlinghaus LR, Mckinley ET, Devan SP, Hardy BM, Xie J, Kang H, Chakravarthy AB, Gore JC. “Magnetic Resonance Imaging of Mean Cell Size in Human Breast tumors,” Magn. Reson. Med. (2020) 83: 2002-2014.
Tzur A, Kafri R, Le Bleu VS, Laher G, Kirchner MW. “Cell Growth and Size Homeostasis in Proliferating Animal Cells.” Science (2009) 325: 167-171.
Jiang X, Li H, Xie J, McKinley E T, Zhao P, Gore J C, Xu J. In Vivo Imaging of Cancer Cell Size and Cellularity Using Temporal Diffusion Spectroscopy. Magn. Reson. Med. (2017) 78: 156-164.
Yuan Y, Failmezger H, Rueda OM, Ali HR, Graf S, Chin S-F, Schwarz RF, Curtis C, Dunning MJ, Bardwell H, Johnson N, Doyle S, Turashvili G, Provenzano E, Aparicio S, Caldas C, Markowetz F. “Quantitative Image Analysis of Cellular Heterogeneity in Breast Tumors Complements Genomic Profiling.” Sci. Trans. Med. (2012) 4: 157ra143.
Model MA, Schonbrun E. “Optical determination of intracellular water in apoptotic cells.” J. Physiol. (2013) 591.23: 5843-5849.
Li X, Priest RA, Woodward WJ, Siddiqui F, Beer TM, Garzotto MG, Rooney WD, Springer CS. “Cell Membrane Water Exchange Effects in Prostate DCE-MRI.” J. Magn. Reson. (2012) 218: 77-85.
Huang W, Moloney B, Li X, Sammi MK, Tudorica A, Troxell ML, Oh KY, Kemmer KA, Nail A. Afzal A, Springer CS. “Active trans-membrane water cycling reflects metabolic activity in breast cancer.” Proc. Int. Soc. Magn. Reson. Med. (2020) 28: 4798.
Figures
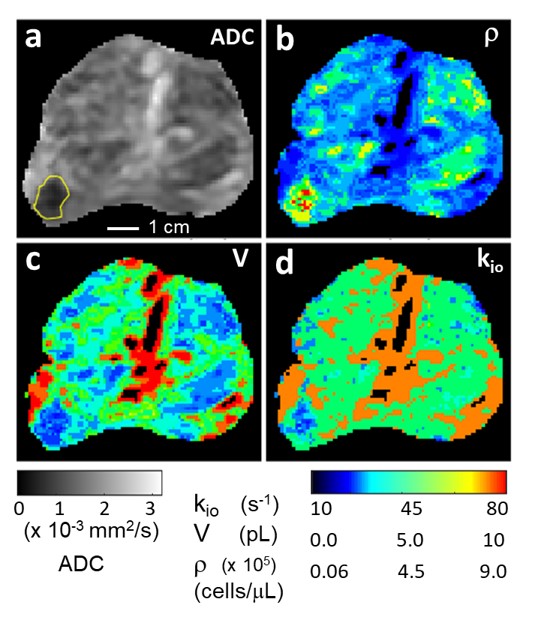
Figure 1. Prostate axial ADC (a), ρ (b), V (c), and kio (d) maps; inferior perspective. The GS (3+4) lesion is bordered in yellow (a). [Pixels in urethra and ductule-rich regions are colored black in (b), (c), and (d).] The ρ, V, maps are in near absolute quantitative agreement with estimations from published ex vivo histopathology and the r map shows very high in vivo lesion/NA prostate gland conspicuity. The kio map indicates lower metabolic activity in the lesion. The r and V maps may suggest nascent pathology in NA prostate regions, particularly the peripheral zone (see text).