4095
Optimal 2D-ROI Method to Measure Apparent Diffusion Coefficient of Lesions in Prostate MRI1Department of Radiology, Mayo Clinic, Rochester, Rochester, MN, United States, 2Department of Diagnostic Radiology, Kanazawa University School of Medical Science, Kanazawa, Japan, 3Department of Radiology, Mayo Clinic, Arizona, Scottsdale, AZ, United States, 4Mayo Clinic, Rochester, Rochester, MN, United States, 5Mayo Clinic, Florida, Jacksonville, FL, United States, 6Mayo Clinic, Arizona, Scottsdale, AZ, United States
Synopsis
This study evaluated different 2D-ROI methods to measure ADC of prostate lesions on prostate MR. The optimal method for measuring ADC values of suspected lesion for differentiating csPCa and non-csPCa on prostate MRI is 2D-ROI method placed on the lowest ADC area using 6-8 mm2 / 8-9 pixel-size ROI (AUC, peripheral zone lesions: 0.740-0.743 / 0.742-0.743, transition zone lesions: 0.709-0.710 / 0.711-0.713). Use of a standardized ROI size improves interobsever variability.
Introduction
Assessment of diffusion weighted images (DWI) and apparent diffusion coefficient (ADC) images plays an important role in classifying lesions by the Prostate Imaging-Reporting and Data System (PI-RADS) scoring system. ADC values may assist differentiation between benign and malignant prostate tissues in the PZ using a threshold of 700–900 (10-6 mm2/s) (1, 2). Various studies investigated the optimal method to measure ADC values of prostate lesions (3-7). However, different ROI sizes using 2D-ROI for ADC measurement has not been studied. The purpose of our study is to determine optimal 2D-ROI method to measure ADC of prostate lesions on prostate MR.Methods
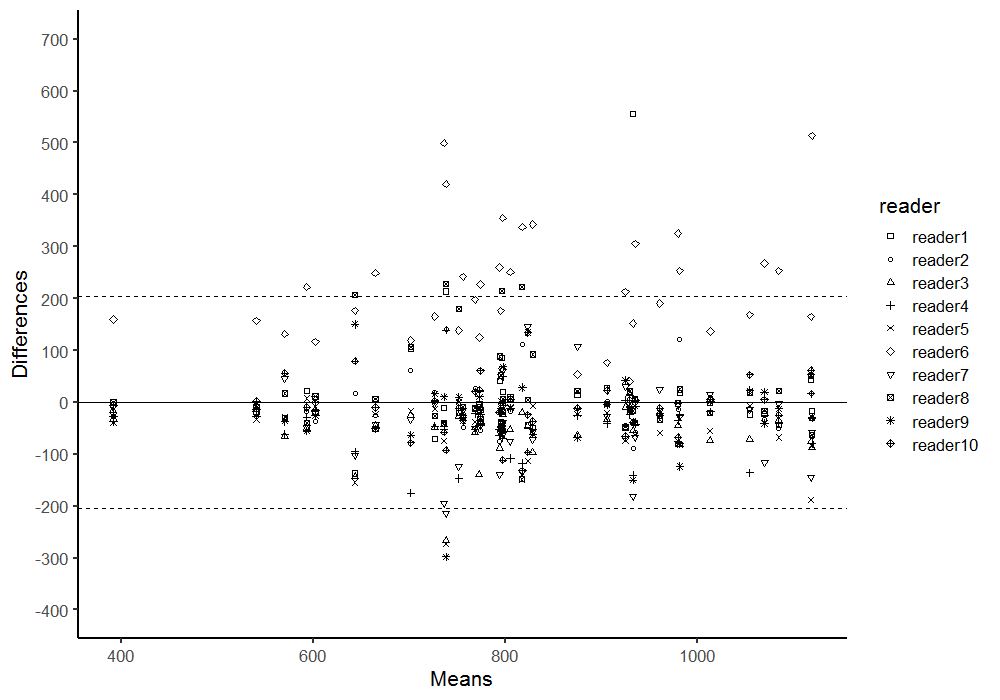
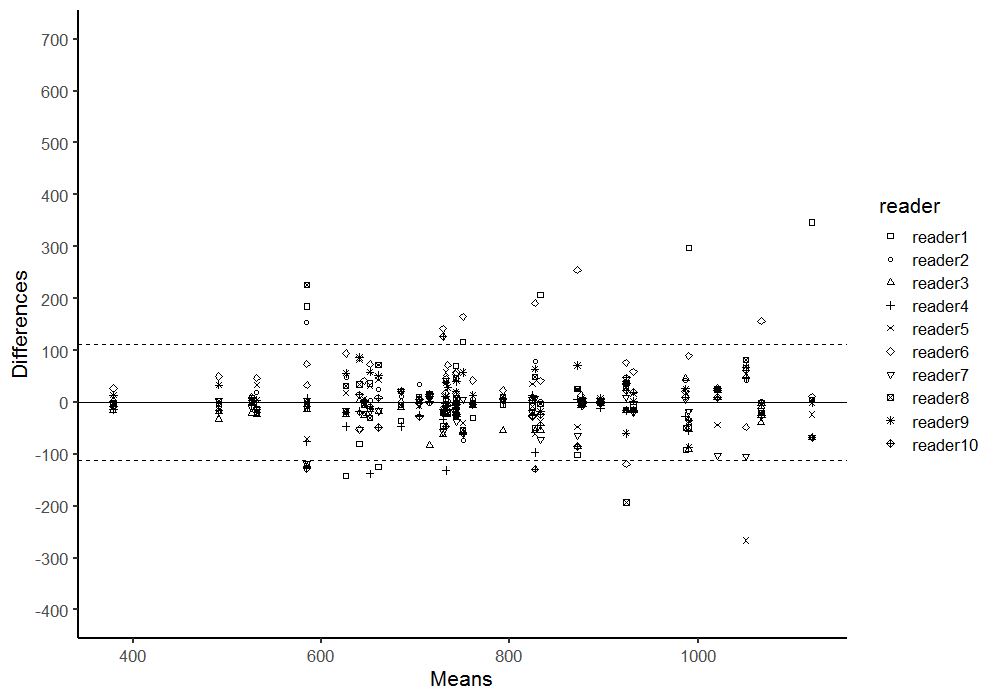
498 patients (mean age 66 [range: 37 to 89]) with 656 prostate lesions who underwent prostate MR followed by targeted prostate biopsy evaluated. Our study consists of two parts. In part I of the study, whole-lesion-3D-region of interest (ROI) encompassing the lesion was placed on ADC map. Overlapping small-2D-ROIs were generated within 3D-ROI. The lowest mean ADC value of the each of 2D-small-ROI was used as representative value. ADC values at 0 to 60th percentile (5th-percentile increments) were calculated from 3D-ROI histogram. Area under the curve (AUC) of receiver operating characteristics was calculated in diagnosing clinically significant prostate cancer (csPCa) (Gleason score [GS] ≥7). Optimal size 2D-ROI to maximize the AUC values was selected. In part II of the study, a multi-reader study (10 radiologists) was performed with 40 cases: 1) 2D-ROI without specific instruction, (2) 2D-ROI with specific instruction to place optimal size ROI on the lowest ADC area, and (3) 3D-ROI method with an optimal percentile value. Interobserver variability was assessed using Bland-Altman plot.Results
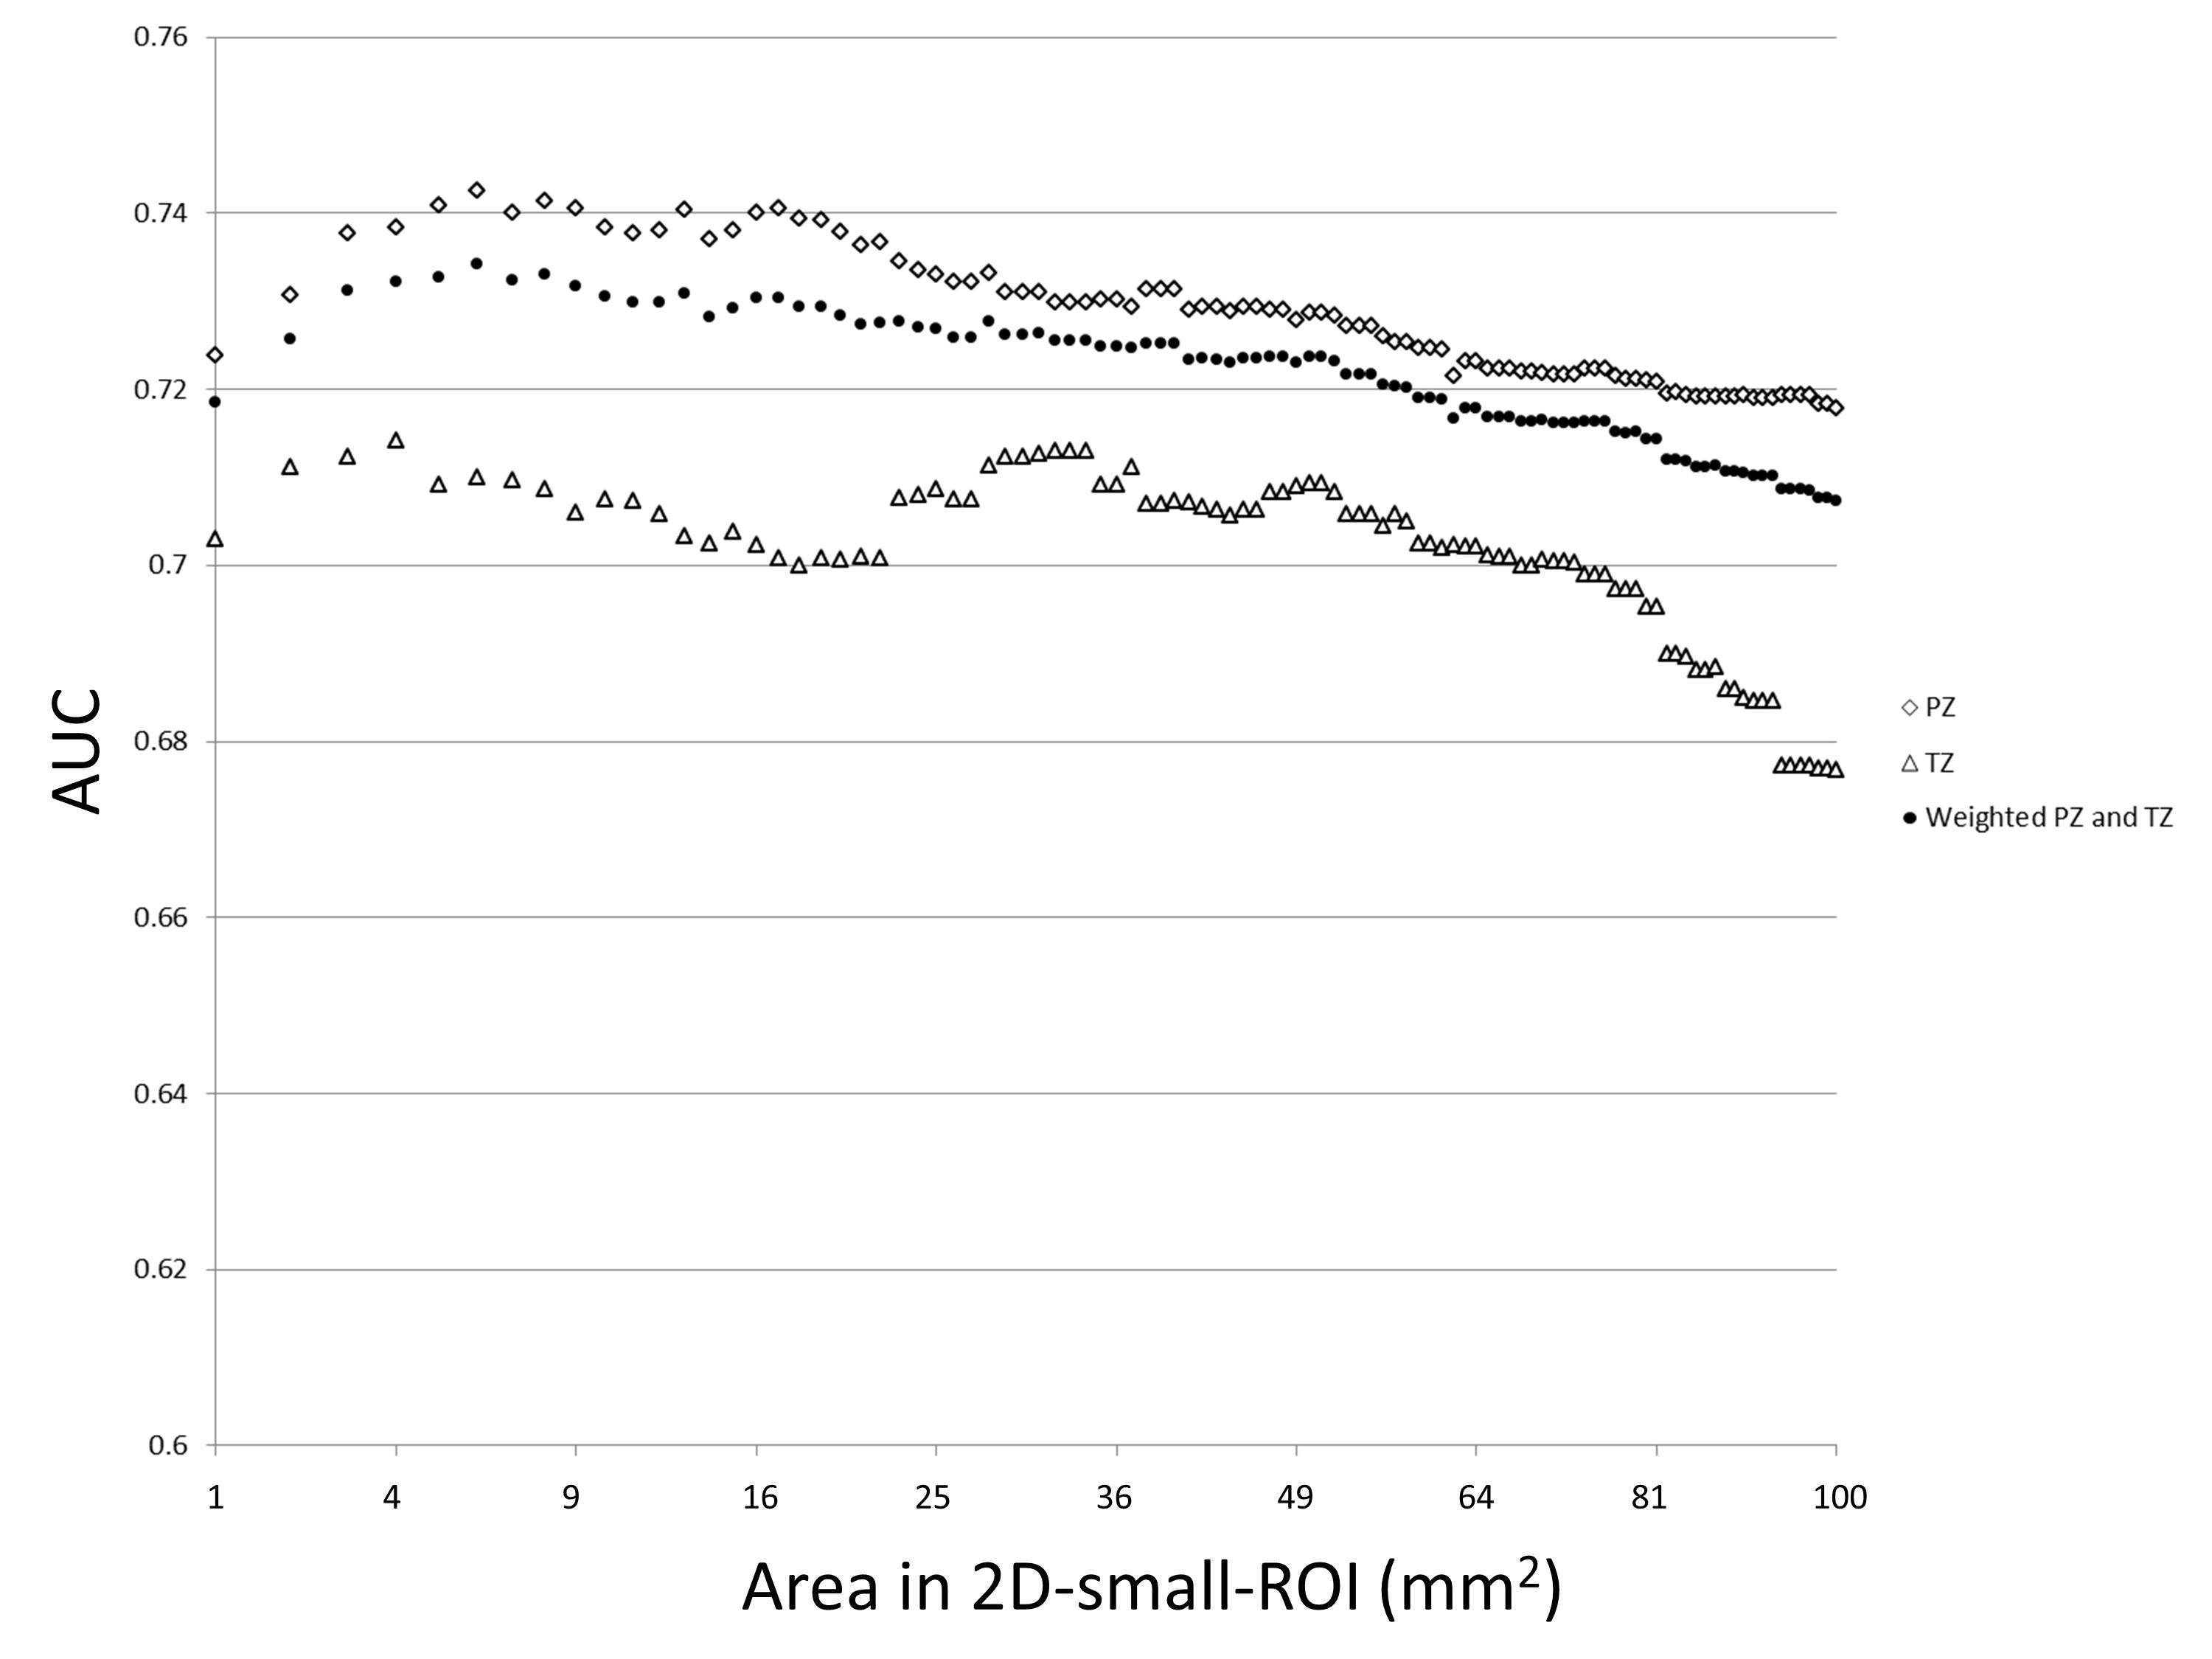
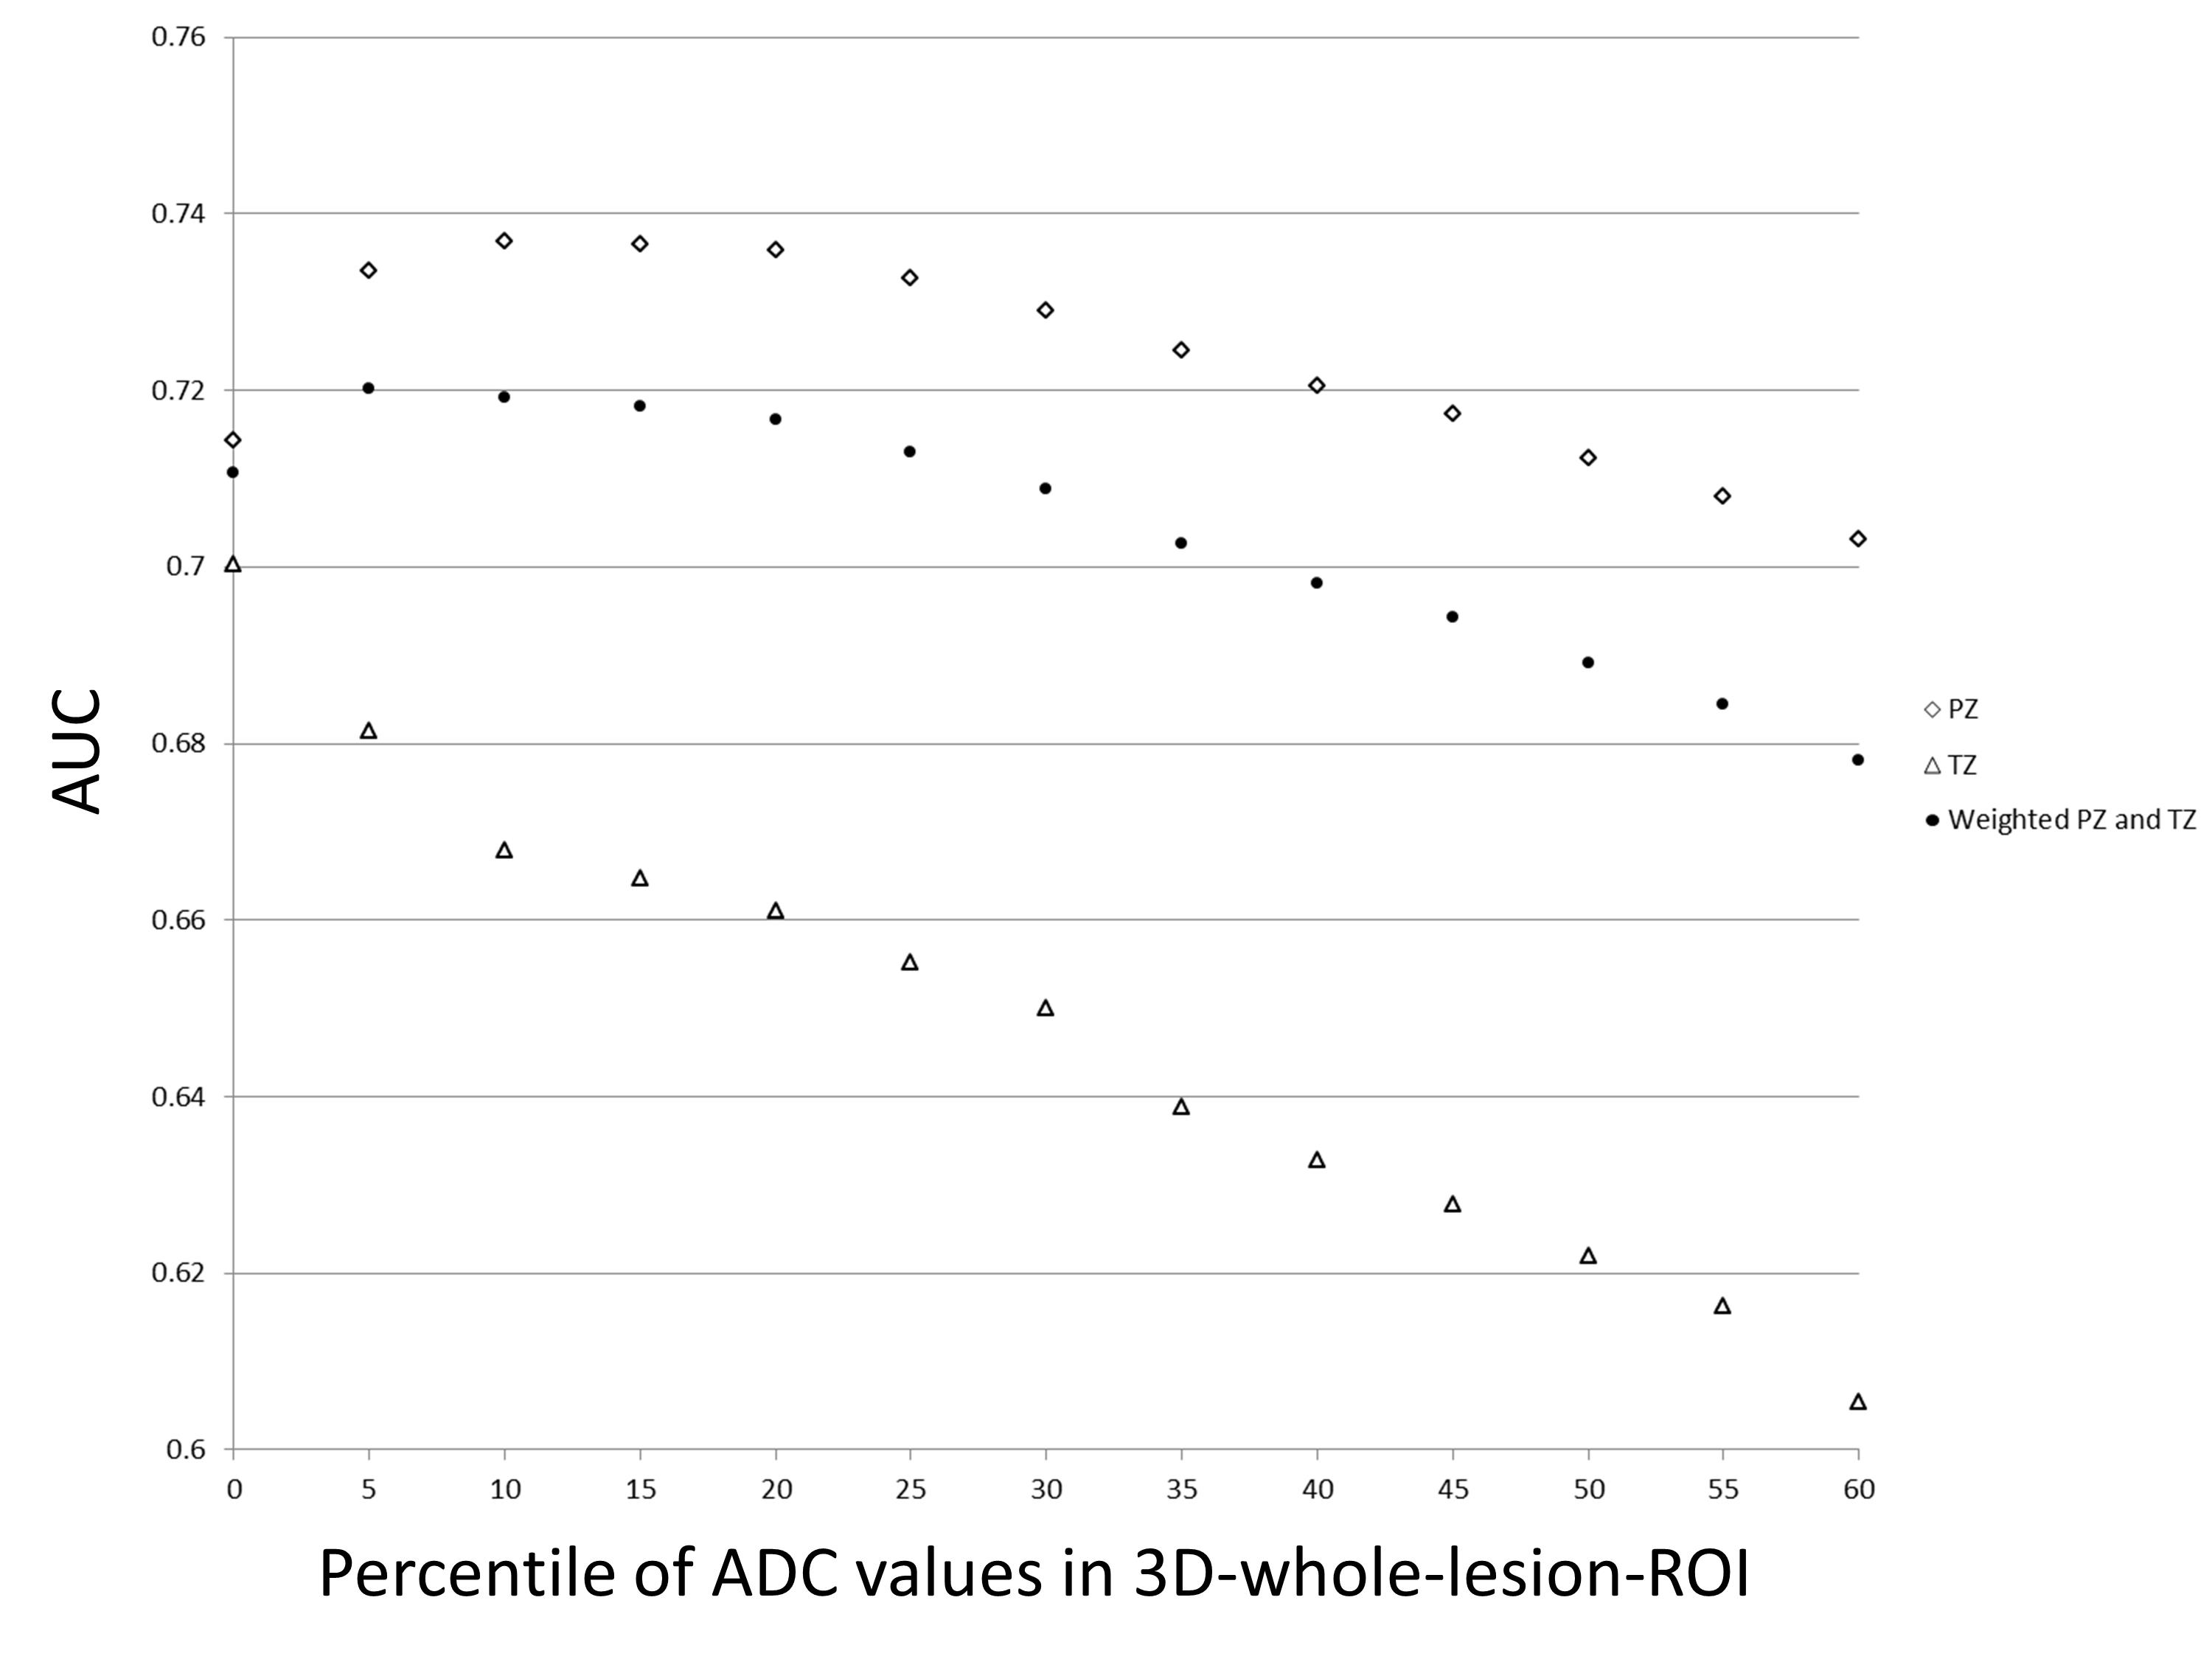
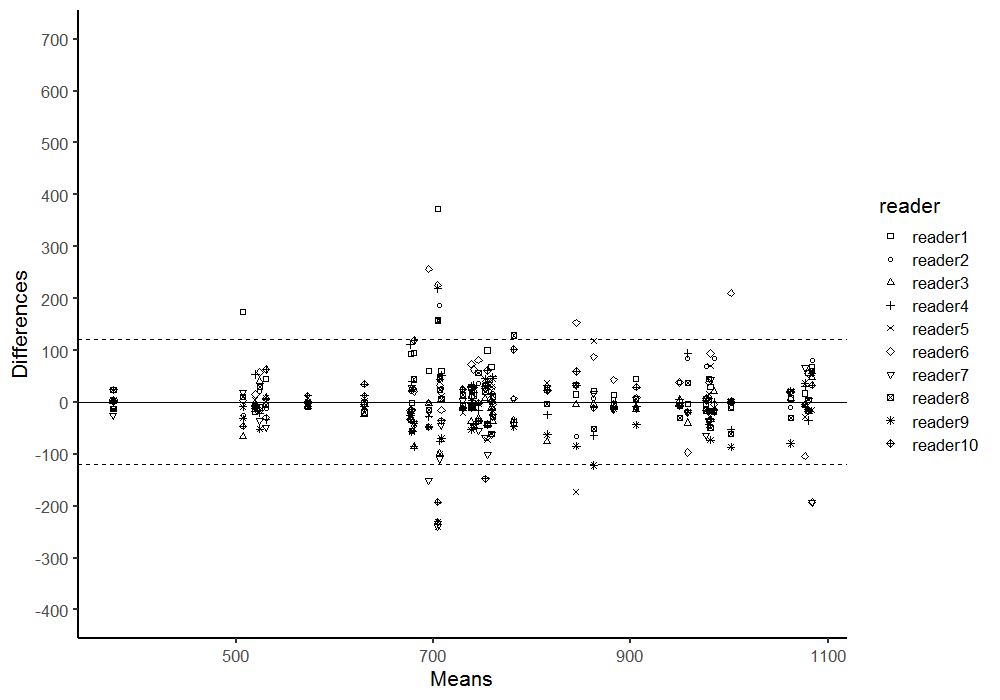
In part I of the study, 254 lesions (39%) were benign, 147 lesions (22%) were gleason score GS 6 PCa, and 255 lesions (39%) were csPCa (GS≥7). 488 lesions (74%) were in the peripheral zone (PZ) and 168 lesions (26%) were in the transition zone (TZ). The most accurate area for the 2D-small-ROI was determined to be 6-8 mm2 / 8-9 pixels (AUC: 0.740-0.743 / 0.742-0.743 in PZ, 0.709-0.710 / 0.711-0.713 in TZ) (Figure.1). The most accurate percentile values for the 3D-whole-lesion-ROI were determined to be 5th-10th percentile (AUC: 0.734-0.737 in PZ, 0.668-0.681 in TZ) (Figure.2). AUC in the differentiation of presence or absence of csPCa by using PI-RADS was 0.703 for the PZ lesions and 0.737 for the TZ lesions. 9 pixel-size for 2D-ROI and 10th percentile value for 3D-ROI were chosen as optimal methods for the part II multi-reader study. In part II of the study, The 95% limits of agreements among the readers were +/-205 for 2D-ROI without specific instruction (Figure 3), +/-120 for 2D-ROI with specific instruction to place 9 pixel-size ROI on the lowest ADC area (Figure 4), and +/-112 for 3D-ROI with 10th percentile (Figure 5).Discussion
2D-small-ROI method using 6-8 mm2 / 8-9 pixel-size ROI placed on the lowest ADC area yielded the highest accuracy in diagnosing csPCa and this optimal 2D-small-ROI method is probably equivalent to 3D-whole-lesion-ROI method with 10th percentile in accuracy and interobserver agreement. PCa is often heterogeneous and high-grade component may sparsely present within low-grade component or non-neoplastic tissue (3, 8). ADC images probably reflects the tumor heterogeneity, and using a small ROI (or percentile value) and measuring the lowest ADC area likely capture the small focus of higher grade tumor thus improving the accuracy. Wu et.al. reported that 2D-ROI-based method produced lower AUC than 10th percentile value of 3D-whole-lesion-ROI method (4). This could be explained by the large size of 2D-ROI used in their study (57 mm2) (4). ADC obtained with a large ROI may not reflect true tumor aggressiveness. Poor accuracy with use of extremely small ROI size (or percentile value) such as 1 pixel (or 0 percentile) is probably due to image noise, since ADC images often contains scattered area of extremely low ADC pixels (9). 2D-small-ROI method relies on radiologists’ detection of the smallest focus of low ADC area. Although it is an intuitive task, careful placement of ROI could probably result in a better interobserver agreement. The drawback of the 3D-method is that it takes longer time to draw 3D-ROI and requires calculation of a histogram which is not universally available. 3D-method does not take the location of low-ADC pixels into account, thus ADC values may vary by the degree of image noise (10). We think that ADC measurement using optimal and standardized 2D-ROI size could improve the subjective assessment for the degree of hypointensity on ADC map by PI-RADS scoring. In our study, 2D-small-ROI method using 6 mm2 ROI yielded a higher accuracy in diagnosing csPCa in the PZ than PI-RADS (AUC: 0.743 versus 0.703).Conclusion
The optimal method for measuring ADC values of suspected lesion for differentiating csPCa and non-csPCa on prostate MRI are 2D-small-ROI method placed on the lowest ADC area using 6-8 mm2. Use of a standardized ROI size improves interobsever variability.Acknowledgements
No acknowledgement found.References
1. Costa DN, Xi Y, Aziz M, Passoni N, Shakir N, Goldberg K, et al. Prospective Inclusion of Apparent Diffusion Coefficients in Multiparametric Prostate MRI Structured Reports: Discrimination of Clinically Insignificant and Significant Cancers. AJR Am J Roentgenol. 2019;212(1):109-16.
2. Barentsz JO, Weinreb JC, Verma S, Thoeny HC, Tempany CM, Shtern F, et al. Synopsis of the PI-RADS v2 Guidelines for Multiparametric Prostate Magnetic Resonance Imaging and Recommendations for Use. Eur Urol. 2016;69(1):41-9.
3. Tamada T, Huang C, Ream JM, Taffel M, Taneja SS, Rosenkrantz AB. Apparent Diffusion Coefficient Values of Prostate Cancer: Comparison of 2D and 3D ROIs. AJR Am J Roentgenol. 2018;210(1):113-7.
4. Wu CJ, Wang Q, Li H, Wang XN, Liu XS, Shi HB, et al. DWI-associated entire-tumor histogram analysis for the differentiation of low-grade prostate cancer from intermediate-high-grade prostate cancer. Abdom Imaging. 2015;40(8):3214-21.
5. Donati OF, Mazaheri Y, Afaq A, Vargas HA, Zheng J, Moskowitz CS, et al. Prostate cancer aggressiveness: assessment with whole-lesion histogram analysis of the apparent diffusion coefficient. Radiology. 2014;271(1):143-52.
6. Barrett T, Lawrence EM, Priest AN, Warren AY, Gnanapragasam VJ, Gallagher FA, et al. Repeatability of diffusion-weighted MRI of the prostate using whole lesion ADC values, skew and histogram analysis. Eur J Radiol. 2019;110:22-9.
7. Tamada T, Dani H, Taneja SS, Rosenkrantz AB. The role of whole-lesion apparent diffusion coefficient analysis for predicting outcomes of prostate cancer patients on active surveillance. Abdom Radiol (NY). 2017;42(9):2340-5.
8. Langer DL, van der Kwast TH, Evans AJ, Sun L, Yaffe MJ, Trachtenberg J, et al. Intermixed normal tissue within prostate cancer: effect on MR imaging measurements of apparent diffusion coefficient and T2--sparse versus dense cancers. Radiology. 2008;249(3):900-8.
9. Mazaheri Y, Vargas HA, Nyman G, Akin O, Hricak H. Image artifacts on prostate diffusion-weighted magnetic resonance imaging: trade-offs at 1.5 Tesla and 3.0 Tesla. Acad Radiol. 2013;20(8):1041-7.
10. Takahashi N, Takeuchi M, Sasaguri K, Leng S, Froemming A, Kawashima A. CT negative attenuation pixel distribution and texture analysis for detection of fat in small angiomyolipoma on unenhanced CT. Abdom Radiol (NY). 2016;41(6):1142-51.
Figures