4093
Characterization of prostate cancer and benign prostatic hyperplasia using IVIM-DKI with parameter-reconstruction method
Archana Vadiraj Malagi1, Virender Kumar2, Kedar Khare3, Chandan J. Das4, and Amit Mehndiratta1,5
1Centre for Biomedical Engineering, Indian Institute of Technology Delhi, New Delhi, India, 2Department of Nuclear Magnetic Resonance (NMR),, All India Institute of Medical Sciences Delhi, New Delhi, India, 3Department of Physics, Indian Institute of Technology Delhi, New Delhi, India, 4Department of Radiodiagnosis, All India Institute of Medical Sciences Delhi, New Delhi, India, 5Department of Biomedical Engineering, All India Institute of Medical Sciences Delhi, New Delhi, India
1Centre for Biomedical Engineering, Indian Institute of Technology Delhi, New Delhi, India, 2Department of Nuclear Magnetic Resonance (NMR),, All India Institute of Medical Sciences Delhi, New Delhi, India, 3Department of Physics, Indian Institute of Technology Delhi, New Delhi, India, 4Department of Radiodiagnosis, All India Institute of Medical Sciences Delhi, New Delhi, India, 5Department of Biomedical Engineering, All India Institute of Medical Sciences Delhi, New Delhi, India
Synopsis
IVIM-DKI was used to evaluate clinical utility and diagnostic performance of IVIM-DKI parameters in characterization of prostate cancer(PCa) against benign prostatic hyperplasia(BPH) and healthy tissues. Sixteen patients suffering from PCa and BPH were recruited and underwent IVIM-DKI with routine MR sequences and biopsy. IVIM-DKI signal was modelled using hybrid model with total variation (TV) penalty function which removes any spurious values in parameters adaptively. HY with TV method produced high diagnostic performance (AUC:D=0.94-0.98, f=0.82-0.85 and k=0.85-0.91) than HY method for all tissues and high-quality parameter maps. IVIM-DKI parameters (D,f,k) showed significant differences between tumor and BPH and healthy tissue.
Introduction
Most common prostatic disease comprises of benign prostatic hyperplasia(BPH) and prostate cancer(PCa). BPH arises in transition zone and PCa is mostly adenocarcinoma, which arises in peripheral zone(PZ) and less frequently in transition zone and in about 20% of cases BPH and PCa can coexists1,2. TRUS-guided biopsy is considered as the gold standard for confirmatory diagnosis. However, TURS biopsy has a low specificity for localization of small lesions and its charecterisation3. Diffusion-weighted Imaging(DWI) plays a major role in localization of PCa and BPH using apparent diffusion coefficient(ADC) which measures water diffusivity in tissues4. Whereas IVIM-DKI altogether captures fast and slow diffusion i.e. pseudo-diffusion and diffusion coefficient(D & D*) as well as perfusion information and tissue heterogeneity i.e. perfusion fraction and kurtosis(f & k)5-7. IVIM-DKI parameters can be evaluated using a Hybrid model(HY) for analysis, which suffers from inhomogeneity and thus is not widely used in clinical routine. This can be corrected using a constrained reconstruction method i.e., total variation(TV) penalty function which adaptively reduces sudden changes in the image8-10. Objective of this study is to evaluate whether IVIM-DKI parameter using hybrid model with TV can differentiate between heathy tissue, tumor and BPH.Methods
Patients and MR acquisition: Sixteen patients with PCa (n=16, age: 61.94±5.47years) were recruited and underwent TRUS biopsy. All patients were scanned in 1.5T MRI(Achieva; Philips Healthcare, Netherlands), with a T2-weighted imaging(TR=3.863s and TE=0.09s), including IVIM-DKI with 13b-values=0,25,50,75,100,150,200,500,800,1000,1250,1500,2000 s/mm2 using phased-array surface coil(TR=5.774s,TE=0.081s).Analysis: All parameters were estimated using Non-linear least square optimization with in-house toolbox using MATLAB. ADC was calculated voxelwise using monoexponential model, defined as below:
$$S⁄S_0=e^{-b.ADC}$$
IVIM-DKI parameters such as D, D*, f and k were obtained using two methods i) HY model7 and ii) HY with TV. HY model is defined below:
$$S⁄S_0=fe^{-bD^*}+(1-f)e^{-bD+b^2 D^2 k/6}$$
where S and S0 are diffusion signals with and without diffusion gradient b in s/mm2. In HY+TV model, iteratively image gradient was calculated, and parameter values were updated with TV parameters(alpha and beta) set to 0.005 and 0.99.
ROI localization: Multiple lesions were found in patients with high grade PCa, only biopsy proven lesion was selected for tumor and BPH ROI. For tumor ROI, DWI at b=2000 s/mm2(hyperintense) and ADC map(hypointense) was used to localize tumor. Healthy PZ and BPH were drawn on b=0 s/mm2 image as shown in Figure1. All ROIs were validated by radiologists with 10 years’ experience with prostate imaging.
Statistics: One-way ANOVA with Tukey's multiple comparison test was used for computing significant differences(p-value<0.05) between IVIM-DKI parameter values between healthy PZ, tumor and BPH. Diagnostic performances of HY and HY+TV were evaluated using receiver operating characteristics(ROC) analysis regression model with cut off values, sensitivity and specificity(MedCalc, version 19.1.7).
Results
Qualitative and quantitative assessment of PCa, BPH and Healthy PZ: Figure2 shows a representative patient for qualitative comparison between Healthy PZ, tumor and BPH having PCa with Gleason score of 6. Tumor appeared hypointense on ADC, D, and f, whereas it appeared hyperintense on D* and k maps. For healthy PZ and BPH, hyperintense region was observed on ADC, and D and hypointense on b=2000 s/mm2, D*, f and k maps. HY results showed significant difference between for tumor against healthy PZ(p-value<0.01) and BPH(p-value<0.01) only for D and f. HY+TV showed significant results for D, f and k for tumor against healthy PZ(p-value<0.01) and BPH(p-value<0.01). No significant results obtained for D*. Mean values of IVIM-DKI parameters from HY and HY+TV were significantly different(p<0.05) as shown in figure3.Diagnostic performance of HY and HY+TV model: For tumor vs BPH, diagnostic performance of IVIM-DKI parameters improved from HY+TV model with better AUC. D (HY+TV) showed highest AUC of 0.94 (cut off: 1.4x10⁻³ mm2/s) and other parameters showed poor AUC. For tumor vs healthy PZ diagnostic performance improved by using HY+TV except for f parameter. D and k showed highest AUC of 0.98 and 0.91 (cut off: D=1.4;k=0.7) respectively as shown in figure4.
Discussion
IVIM-DKI is not clinically reliable as HY model produces non-physiological inhomogeneity in parameter map. This was corrected by total variation penalty function along with HY model which removed spurious values. We wanted to evaluate whether using IVIM-DKI parameter maps obtained from HY+TV model can differentiate tumor from healthy PZ and BPH. Previous literature has shown ADC showed good accuracy for differentiating tumor vs BPH compared to IVIM parameters11-13. In this study, we were able to show IVIM-DKI parameters of tumor region, such as D and f decreased whereas k increased significantly against healthy tissue and BPH indicating that tumor region consisted of poor cell differentiation with faster cell growth which causes unobstructed water movement14. This also suggests that low f and high k in tumor due to poor vasculature and increase in tissue heterogeneity15. ROC analysis showed D(HY+TV) was able to better differentiate between tumor against BPH(AUC:0.94) and healthy PZ(AUC:0.98) with high sensitivity(94%) and specificity(88-94%). k and f improved in diagnostic performance with high AUC, sensitivity(81-100%) and specificity(63-94%) using HY+TV.Conclusion
IVIM-DKI parameters such as D, f and k from IVIM-DKI model with total variation method were able to classify tumor against BPH and healthy tissue. Also, IVIM-DKI with TV produced parameters with high diagnostic performance and clinically reliable parameter map.Acknowledgements
This study was supported by IIT Delhi and AIIMS Delhi. AVM was supported by research fellowship fund from the Ministry of Human Resource Development, Government of India.References
- McVary KT. BPH: Epidemiology and comorbidities. Am J Manag Care 2006;12 5 Suppl:S122-8.
- McNeal JE. Normal histology of the prostate. Am J SurgPathol 1988;12:619-33.
- Hodge KK, McNeal JE, Terris MK, Stamey TA. Random systematic versus directed ultrasound guided transrectal core biopsies of the prostate. J Urol 1989;142(1):71–4.
- Morgan VA, Kyriazi S, Ashley SE et al. Evaluation of the potential of diffusion-weighted imaging in prostate cancer detection. Acta Radiol 2007;48(6):695–703.
- Le Bihan D. et al. Separation of diffusion and perfusion in intravoxel incoherent motion MR imaging. Radiology.1988;168:497–505.
- Jensen J H, Helpern J A, Ramani A. et al. Diffusional Kurtosis Imaging : The Quantification of Non- Gaussian Water Diffusion by Means of Magnetic Resonance Imaging. Magn Reson Med.2005;1440:1432–1440.
- Wu W C, Yang S C, Chen Y F. et al. Simultaneous assessment of cerebral blood volume and diffusion heterogeneity using hybrid IVIM and DK MR imaging: initial experience with brain tumors. Eur. Radiol.2017;27:306–314.
- Rudin L I, Osher S & Fatemi E. Nonlinear total variation based noise removal algorithms. Phys. D nonlinear Phenom.1992;60:259–268.
- Kayal E B et al. Quantitative Analysis of Intravoxel Incoherent Motion (IVIM) Diffusion MRI using Total Variation and Huber Penalty Function. Med. Phys.2017;44:5849–5858.
- Malagi, A. V. et al. Effect of combination and number of b values in IVIM analysis with post-processing methodology: simulation and clinical study. Magn. Reson. Mater. Physics, Biol. Med. 2019;32, 519–527.
- Zhang Y D. et al. The histogram analysis of diffusion-weighted intravoxel incoherent motion (IVIM) imaging for differentiating the gleason grade of prostate cancer. Eur. Radiol.2015;25:994–1004.
- Shinmoto H. et al. An intravoxel incoherent motion diffusion-weighted imaging study of prostate cancer. Am. J. Roentgenol.2012;199:496–500.
- Tamura C. et al. Diffusion kurtosis imaging study of prostate cancer: preliminary findings. J. Magn. Reson. Imaging.2014;40:723–729.
- Döpfert J et al. Investigation of prostate cancer using diffusion-weighted intravoxel incoherent motion imaging. Magn Reson Imaging.2011;29:1053–1058.
- Ding Y et al. Differentiating between malignant and benign renal tumors: do IVIM and diffusion kurtosis imaging perform better than DWI? Eur Radiol. 2019;6930-6939
Figures
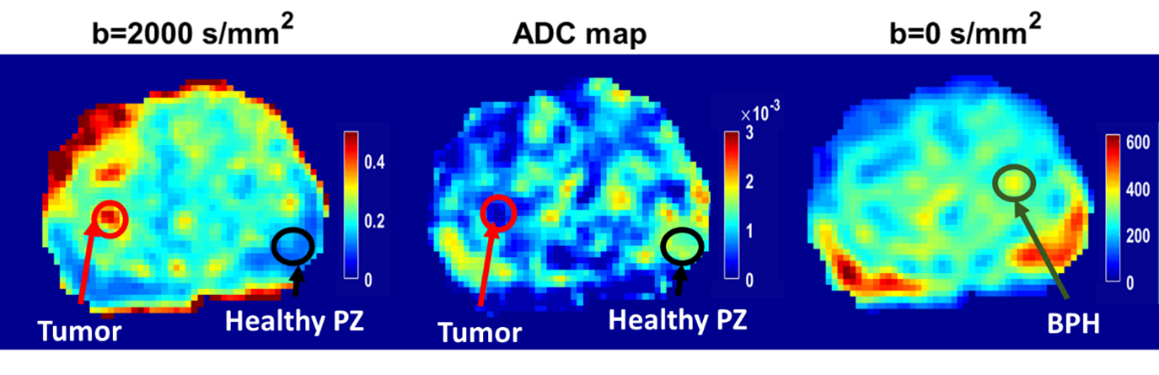
Figure1 ROI localization of tumor
(red circle), healthy PZ (black circle) and BPH (green circle) using IVIM-DKI
at b=0 and 2000 s/mm2 and ADC map of one representative patient
having Prostate cancer with a Gleason score of 7.
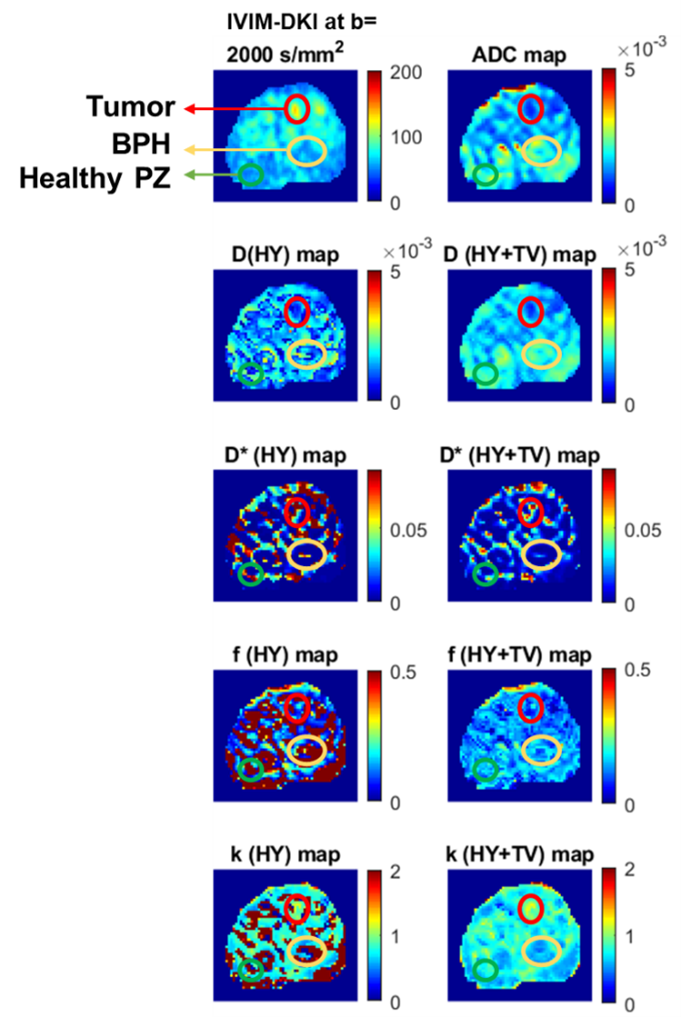
Figure2 For BPH (yellow), the hyperintense region was observed
on (b) ADC, (c) D, and (e) f; whereas hypointense region was observed on, (a)
High b-value map, (d) D*, and (f) k of a representative patient diagnosed with
PCa and BPH.
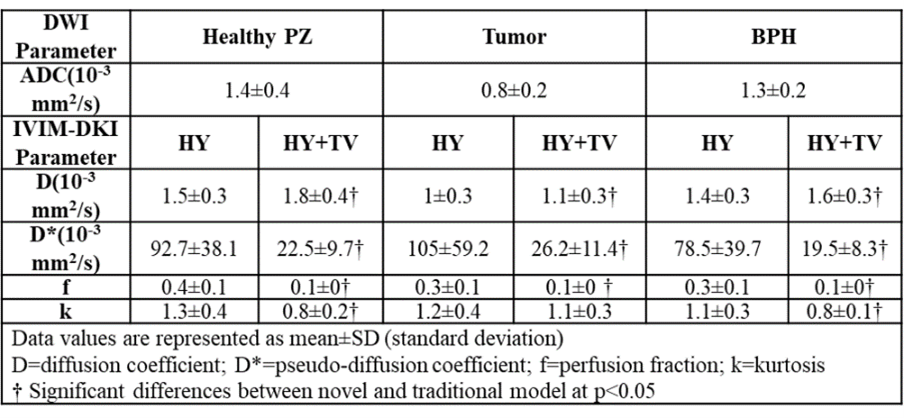
Figure3 ADC and IVIM-DKI parameter mean values of healthy PZ, tumor
and BPH in Patients diagnosed with PCa and BPH.
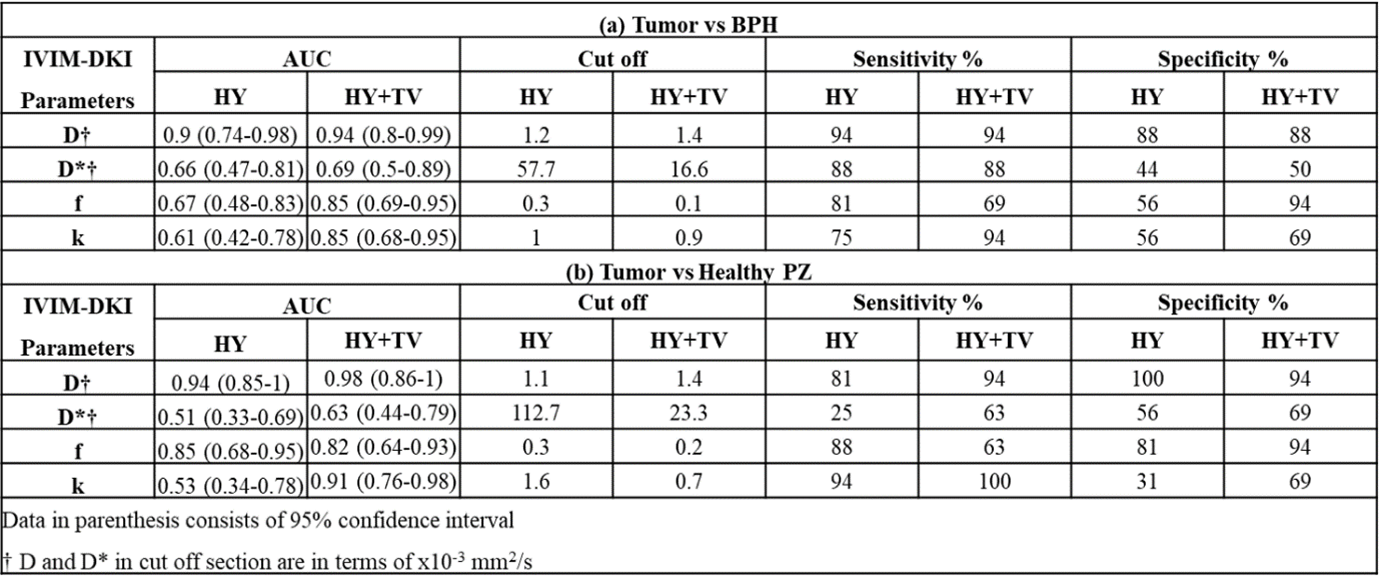
Figure4
Diagnostic performance of IVIM-DKI parameters obtained from HY and HY+TV model
to differentiate from (a) Tumor vs BPH and (b) Tumor vs Healthy PZ.