4092
Clinical application of single-shot echo-planer diffusion-weighted imaging with compressed SENSE in prostate MRI
Ayumu Kido1, Tsutomu Tamada1, Yu Ueda2, Masami Yoneyama2, and Akira Yamamoto1
1Radiology, Kawasaki Medical School, Okayama, Japan, 2Phillips Japan, Tokyo, Japan
1Radiology, Kawasaki Medical School, Okayama, Japan, 2Phillips Japan, Tokyo, Japan
Synopsis
Image quality of DWI with single-shot echo-planar imaging (ssEPI) suffers from low SNR in high b-value acquisition. Compressed SENSE (C-SENSE) allow for a reduction of the noise. A total of 26 patients with prostate cancer (PC) underwent mpMRI including DWI with ssEPI and SENSE (EPIS) and DWI with ssEPI and C-SENSE (EPICS). SNR was significantly higher in EPICS than in EPIS. In comparison between ADC of clinically significant PC and ADC of clinically insignificant PC, only EPICS had significant difference. Compared with EPIS, EPICS improves the image quality and may contribute to increased diagnostic performance of tumor aggressiveness in PC.
INTRODUCTION:
Diffusion-weighted imaging (DWI) is key components of prostate multiparametric MRI (mpMRI) in patients with prostate cancer (PC) that contributes to tumor detection as well as assessment of tumor aggressiveness.1-3 Currently, DWI is routinely performed using the single-shot echo-planar imaging (ssEPI) technique. However, the image quality of ssEPI suffers from low signal to noise ratio (SNR) in high b-value acquisition recommended in PI-RADS v2.1, marked anatomic distortion, and susceptibility artifact as a result of factors including the very rapid acquisition, B0- and B1-field inhomogeneities, and eddy currents. Compressed SENSE (C-SENSE) which is a combination of SENSE (sensitivity encoding) with compressed sensing allow for a reduction of the noise therefore enabling increasing of the SNR. Therefore, ssEPI with C-SENSE may improve SNR of ssEPI and has potential for clinical application of the ssEPI with C-SENSE for tumor detection and assessment of tumor aggressiveness using tumor apparent diffusion coefficient (tADC) in PC. Thus, the aim of this study is to compare the image quality, PC detection ability, and discrimination ability of PC aggressiveness between DWI with ssEPI and SENSE (EPIS) and DWI with ssEPI and C-SENSE (EPICS) using 3-T system.METHODS:
A total of 26 patients with MRI-ultrasonography fusion-guided prostate-targeted biopsy (MRGB) with or without prostatectomy proven PC (mean age, 73 years; range, 50-91 years) underwent mpMRI including DWI on a 3-T system with a 32-channel phased-array coil (Ingenia Elition 3.0T; Philips Healthcare, Best, The Netherlands) before prostate biopsy. Axial EPIS DWI and EPICS DWI were acquired with the imaging parameters described in Figure 1. In qualitative visual assessment, anatomical distortion score of prostate (AD, 1= severe; 2= moderate, 3= mild; 4= none), lesion conspicuity score (LCS, 1= invisible for surrounding normal site; 2= slightly high, 3= moderately high; 4= very high) were assessed, and in quantitative analysis, SNR (SNR= normal prostate SI (mean) / internal obturator muscle standard deviation (SD)), contrast to noise ratio (CNR= lesion SI (mean) - normal prostate SI (mean) / internal obturator muscle SD), and apparent diffusion coefficient (ADC, ×10-3 mm2/s) of the lesion (ADCmean) and normal peripheral zone (PZ) (ADCmean) were measured. AD, LCS, SNR, and CNR were compared between EPIS and EPICS. In addition, ADCmean between normal PZ and lesion, and tumors with Gleason score (GS) ≤ 3+4 and tumors with GS ≥ 4+3 was compared in EPIS as well as in EPICS. Relationships between tADCmean in both EPIS and EPICS and tumor Gleason grade (GG; GG1, GS = 3+3; GG2, GS = 3+4; GG3, GS = 4+3; GG4, GS = 8; GG5, GS = 9 or 10) were also assessed.4 The Wilcoxon signed rank test, Mann–Whitney U test, and Spearman's rank correlation coefficient (ρ) were used for statistical analysis.RESULTS:
The 26 PCs comprised GS = 3+3 (GG1) in 2 tumors, GS = 3+4 (GG2) in 11 tumors, GS = 4+3 (GG3) in 7 tumors, GS = 4+4 (GG4) in 1 tumors, and GS = 4+5 (GG5) in 5 tumors. AD and SNR were significantly higher in EPICS than in EPIS (2.88 ± 0.33 vs. 2.04 ± 0.71, P < 0.001 and 21.0 ± 9.66 vs. 16.2 ± 6.85, P = 0.003) (Figure 2). LCS and CNR was comparable between EPIS and EPICS (P = 1.000 and P = 0.118). On the other hand, in both EPIS and EPICS, tADCmean was significantly lower than normal ADCmean (0.65 ± 0.12 vs. 1.46 ± 0.23, P < 0.001 and 0.68 ± 0.11 vs. 1.42 ± 0.36, P < 0.001). In comparison between ADCmean of GS ≤ 3+4 tumors and ADCmean of GS ≥ 4+3 tumors, EPICS had significant difference (0.73 ± 0.08 vs. 0.64 ± 0.12, P = 0.034), but there was no significant difference in EPIS (0.69 ± 0.08 vs. 0.61 ± 0.14, P = 0.064). The tADCmean in EPICS had a significant negative correlation with GG (ρ = –0.389, P = 0.049), but not tADCmean in EPIS (ρ = –0.376, P = 0.058).DISCUSSION:
In the comparison of image quality using AD and SNR, EPICS was higher in EPIS. These results suggest that EPICS has image quality that can be applied clinically, which is expected to improve detection ability of small PC and diagnostic performance of tADC in assessment of tumor aggressiveness. The results of qualitative and quantitative tumor detection ability using LCS, CNR, and ADCmeanbetween normal PZ and PC was comparable between EPIS and EPICS. However, the discrimination ability between clinically significant PC with GS ≥ 4+3 and clinically insignificant PC with GS ≤ 3+4 and correlation coefficient between tADCmean and GG were higher in EPICS than in EPIS.4 These results is expected the usefulness of ADC measurement derived from EPICS for not only PC detection but also assessment of tumor aggressiveness in PC, which is essential for prostate biopsy indication and treatment strategy decisions including active surveillance. The present results may need further validation in prospective studies with a larger number of patients.CONCLUSION:
The present findings suggest that compared with EPIS DWI and EPICS DWI, EPICS DWI improves the image quality and may contribute to increased diagnostic performance of tumor aggressiveness in PC.Acknowledgements
No acknowledgement found.References
- Turkbey B, Rosenkrantz AB, Haider MA, et al. Prostate Imaging Reporting and Data System Version 2.1: 2019 Update of Prostate Imaging Reporting and Data System Version 2. Eur Urol. 2019;76(3):340-351.
- Le Bihan D. Apparent diffusion coefficient and beyond: what diffusion MR imaging can tell us about tissue structure. Radiology. 2013;268(2):318–322.
- Tamada T, Sone T, Jo Y, et al. Diffusion-weighted MRI and its role in prostate cancer. NMR Biomed. 2014;27(1):25-38.
- Epstein JI, Egevad L, Amin MB, et al. The 2014 International Society of Urological Pathology (ISUP) Consensus Conference on Gleason Grading of Prostatic Carcinoma: Definition of Grading Patterns and Proposal for a New Grading System. Am J Surg Pathol 2016;40(2):244-252.
Figures
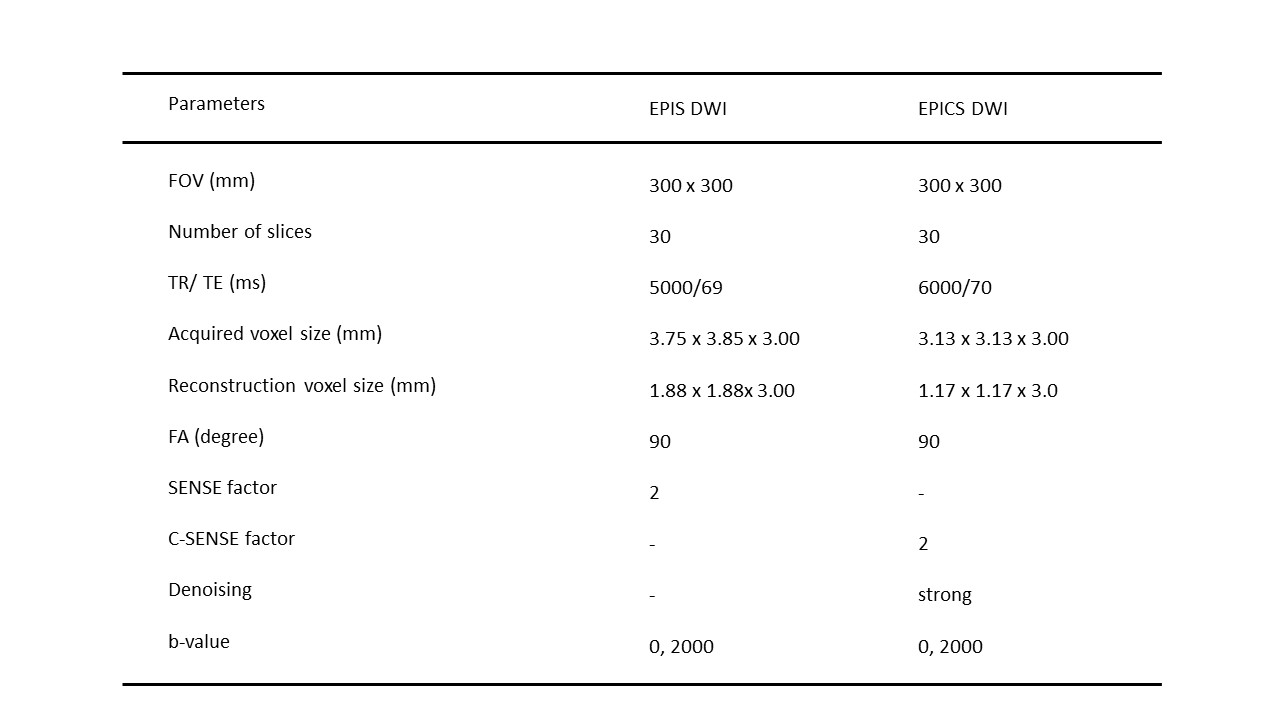
Details of the imaging parameters
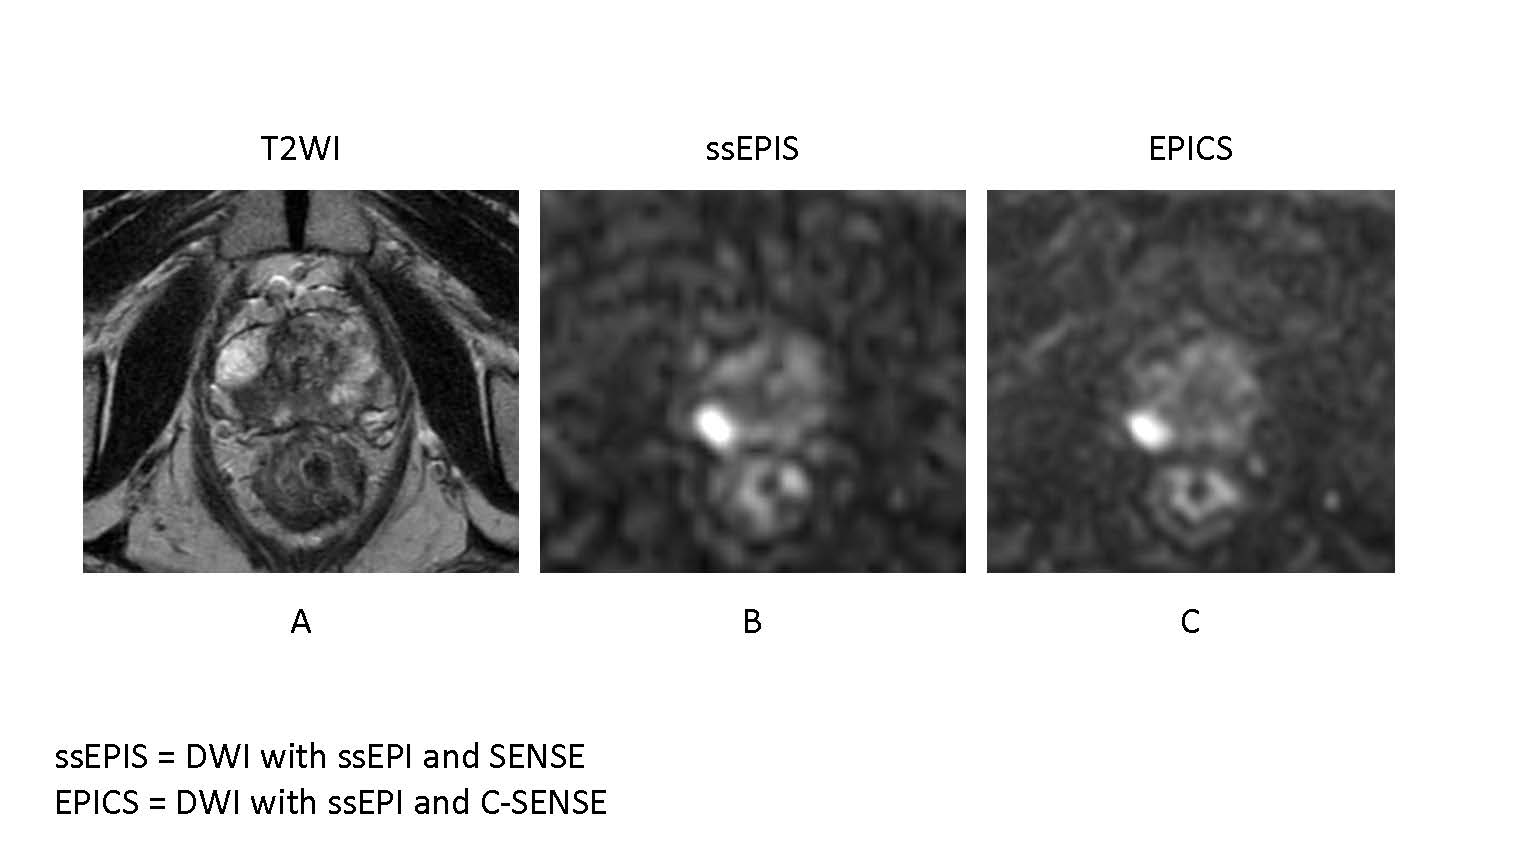
A 82-year-old male with prostate cancer (PSA level of 6.56 ng/mL, Gleason score of 4+3) in the right peripheral zone. Cancer lesion is shown as a homogeneous hypointense lesion with mass effect on T2-weighted imaging (A). The lesion with focal hyperintensity is depicted clearly in the both DWI image (ssEPIS and EPICS) (B, C). Signal to noise ratio is higher in EPICS than in EPIS.