4090
Automated patient-level detection of grade group ≥2 prostate cancer using quantitative restriction spectrum imaging MRI
Allison Y Zhong1, Leonardino A Digma1, Troy Hussain1, Christine H Feng1, Christopher C Conlin2, Karen Tye1, Asona J Lui1, Maren MS Andreassen3, Ana E Rodríguez-Soto2, Roshan Karunamuni1, Joshua Kuperman2, Rebecca Rakow-Penner2, Michael E Hahn2, Anders M Dale2,4, and Tyler M Seibert1,2,5
1Department of Radiation Medicine and Applied Sciences, University of California San Diego, La Jolla, CA, United States, 2Department of Radiology, University of California San Diego, La Jolla, CA, United States, 3Department of Circulation and Medical Imaging, Norwegian University of Science and Technology, Trondheim, Norway, 4Department of Neurosciences, University of California San Diego, La Jolla, CA, United States, 5Department of Bioengineering, University of California San Diego, La Jolla, CA, United States
1Department of Radiation Medicine and Applied Sciences, University of California San Diego, La Jolla, CA, United States, 2Department of Radiology, University of California San Diego, La Jolla, CA, United States, 3Department of Circulation and Medical Imaging, Norwegian University of Science and Technology, Trondheim, Norway, 4Department of Neurosciences, University of California San Diego, La Jolla, CA, United States, 5Department of Bioengineering, University of California San Diego, La Jolla, CA, United States
Synopsis
Multiparametric MRI (mpMRI) improves prostate cancer diagnosis, but conventional apparent diffusion coefficient (ADC) and PI-RADS have poor reliability. We evaluated restriction spectrum imaging MRI (RSI-MRI) as a quantitative, patient-level classifier of higher-grade prostate cancer (grade group ≥2) and compared performance to conventional ADC and PI-RADS. Area under the receiver operating characteristic curve values for ADC, RSI-C1, and PI-RADS were 0.58 [0.51,0.67], 0.76 [0.68,0.83], and 0.78 [0.71,0.85], respectively. RSI-C1 was superior to ADC (p=0.003) as a patient-level classifier of higher-grade prostate cancer. Performance of RSI-C1 was comparable to that of PI-RADS (p=0.59).
Introduction
Multiparametric MRI (mpMRI), the current standard imaging test for prostate cancer diagnosis, improves detection of clinically significant cancer1. However, the standardized qualitative scoring system, PI-RADS, yields inconsistent results2–4. The standard quantitative DWI metric, conventional apparent diffusion coefficient (ADC), depends on multiple scan parameters and also suffers from poor reliability5.Restriction spectrum imaging (RSI) is an advanced diffusion modeling framework that allows for more complex tissue microstructure. A recent study found that male pelvic tissues can be optimally modeled with four diffusion compartments6. Prostate tumor conspicuity was highest using the model coefficient for the slowest diffusion compartment, RSI-C1. Voxel-level prostate cancer detection was also more accurate using RSI-C1 than ADC7.
Here, we compared RSI-C1 to ADC and PI-RADS for detection of higher-grade prostate cancer. We hypothesized that RSI-C1 would be a superior quantitative marker for higher-grade prostate cancer than conventional ADC.
Methods
Study PopulationThis retrospective study included men who underwent RSI-MRI for suspected prostate cancer at UC San Diego between January 2017 and December 2019 and had a prostate biopsy within 180 days of MRI. RSI-MRI exams included standard mpMRI, as well as an RSI series with four b-values in a single acquisition. This study was approved by the Institutional Review Board.
MRI Acquisition and Processing
Scans were collected on a 3T clinical MRI scanner (Discovery MR750, GE Healthcare, Waukesha, WI, USA) using a 32-channel phased-array body coil. A T2-weighted sequence was acquired with identical scan coverage to the RSI series (TR: 3850 ms, TE: 100 ms, resolution: 0.39x0.39 mm, acquisition matrix: 384x320, slice thickness: 3 mm). The RSI acquisition used field-of-view optimized and constrained undistorted single shot imaging and sampled b-values of 0, 500, 1000, and 2000 s/mm2 at 2, 6, 6, and 12 unique gradient directions, respectively (TR: 4500 ms, TE: 68.7 ms, resolution: 2.5x2.5 mm, acquisition matrix: 96x48, slice thickness: 6 mm). The b=0 s/mm2 volumes were acquired using forward and reverse phase encoding to allow for correction of B0-inhomogeneity distortions. RSI acquisition time was approximately 2 minutes.
Post-processing of MRI data was completed using in-house programs written in MATLAB (MathWorks, Natick, MA, USA). Diffusion data were corrected for distortions arising from B0 inhomogeneity, gradient nonlinearity, and eddy currents8,9. Conventional ADC was calculated for each voxel using distortion-corrected DWI sequences performed with b-values of 0, 500, and 1000 s/mm2.
RSI calculations were as previously described6,7. Diffusion signals were corrected for noise and distortion, then scaled by the median b=0 signal within each patient’s prostate. Corrected signal intensity for each b-value, Scorr(b), was modeled as a linear combination of exponential decays representing four diffusion compartments (i=1-4) with fixed diffusion coefficients Di and voxel-wise estimated signal contributions Ci.
$$S_{corr}(b)=C_{1}e^{-bD_{1}}+C_{2}e^{-bD_{2}}+C_{3}e^{-bD_{3}}+C_{4}e^{-bD_{4}}$$
Optimal Di values for each compartment were previously determined for pelvic and prostate tissues: 1.0 e-4, 1.8 e-3, 3.6 e-3, and >>3.0 e-3 mm2/s, approximately representing restricted, hindered, free diffusion, and flow, respectively. The prostate gland was manually segmented on T2-weighted imaging and verified on DWI volumes using MIM (MIM Software Inc, Cleveland, OH, USA).
Clinical Data
Clinical records were reviewed to obtain histopathology results (highest grade group10 on biopsy or prostatectomy, if applicable) and imaging results (highest PI-RADS category reported). MRI exams were read by board-certified and subspecialty-fellowship-trained radiologists, using all available clinical images and standard PI-RADS criteria (transition to v2.1 from v2 occurred in 20192,3).
Patient-Level Analysis
Receiver operating characteristic (ROC) curves were generated for detection of higher-grade prostate cancer (grade group ≥2) using ADC, RSI-C1, and PI-RADS. For ADC and RSI-C1, the most suspicious voxel-level value within the prostate was used (i.e., smallest ADC and largest RSI-C1). Gleason ≤6 cancers or fully benign biopsies were considered negative results. Performance was assessed by area under the ROC curve (AUC). Statistical comparisons were made via 10,000 bootstrap samples to calculate 95% confidence intervals and bootstrap p-values for the difference between the performance of ADC, RSI-C1, and PI-RADS. Significance was set at two-sided α=0.05.
Results
151 patients were included. The median age was 66 years (IQR 59-72). The median time from MRI to biopsy was 16 days (IQR 1-35). PI-RADS and pathology characteristics are summarized in Table 1. 104 patients were scored using PI-RADS v2, 47 using v2.1.The AUC values for ADC, RSI-C1, and PI-RADS were 0.58 [0.51,0.67], 0.76 [0.68,0.83], and 0.78 [0.71,0.85], respectively. RSI-C1 was superior to ADC (p=0.003) as a patient-level classifier of higher-grade prostate cancer. The performance of RSI-C1 was comparable to that of PI-RADS (p=0.59).
Discussion
RSI-C1 performed well as a quantitative, automated detector of higher-grade prostate cancer. The performance of RSI-C1 was superior to that of ADC. RSI-C1, based only on a two-minute diffusion MRI acquisition, also had performance comparable to PI-RADS categories assigned by experts using all standard imaging in a clinical multi-parametric MRI exam.Limitations include retrospective design, single institution, lack of prostatectomy specimen in all patients, and inclusion of only patients who underwent biopsy with results available in our institutional patient records. Future work will evaluate the incorporation of spatial characteristics and other mpMRI modalities, as well as separate analyses for lesions in the peripheral and transition zones.
Acknowledgements
No acknowledgement found.References
- Fütterer JJ, Briganti A, De Visschere P, et al. Can Clinically Significant Prostate Cancer Be Detected with Multiparametric Magnetic Resonance Imaging? A Systematic Review of the Literature. Eur Urol. 2015;68(6):1045-1053. doi:10.1016/j.eururo.2015.01.013
- Weinreb JC, Barentsz JO, Choyke PL, et al. Prostate Imaging Reporting and Data System Version 2. Eur Urol. 2016;69(1):16-40.
- Turkbey B, Rosenkrantz AB, Haider MA, et al. Prostate Imaging Reporting and Data System Version 2.1: 2019 Update of Prostate Imaging Reporting and Data System Version 2. Eur Urol. 2019;76(3):340-351. doi:10.1016/j.eururo.2019.02.033
- Westphalen AC, McCulloch CE, Anaokar JM, et al. Variability of the Positive Predictive Value of PI-RADS for Prostate MRI across 26 Centers: Experience of the Society of Abdominal Radiology Prostate Cancer Disease-focused Panel. Radiology. 2020;296(1):76-84. doi:10.1148/radiol.2020190646
- Kallehauge JF, Tanderup K, Haack S, et al. Apparent Diffusion Coefficient (ADC) as a quantitative parameter in diffusion weighted MR imaging in gynecologic cancer: Dependence on b-values used. Acta Oncol. 2010;49(7):1017-1022. doi:10.3109/0284186X.2010.500305
- Conlin CC, Feng CH, Rodriguez-Soto AE, et al. Improved Characterization of Diffusion in Normal and Cancerous Prostate Tissue Through Optimization of Multicompartmental Signal Models. J Magn Reson Imaging. Published online October 31, 2020. doi:10.1002/jmri.27393
- Feng CH, Conlin CC, Batra K, et al. Voxel-level Classification of Prostate Cancer Using a Four-Compartment Restriction Spectrum Imaging Model. medRxiv. Published online July 28, 2020:2020.07.25.20162172. doi:10.1101/2020.07.25.20162172
- White NS, McDonald C, McDonald CR, et al. Diffusion-weighted imaging in cancer: physical foundations and applications of restriction spectrum imaging. Cancer Res. 2014;74(17):4638-4652. doi:10.1158/0008-5472.CAN-13-3534
- Holland D, Kuperman JM, Dale AM. Efficient correction of inhomogeneous static magnetic field-induced distortion in Echo Planar Imaging. Neuroimage. 2010;50(1):175-183. doi:10.1016/j.neuroimage.2009.11.044
- Egevad L, Delahunt B, Srigley JR, Samaratunga H. International Society of Urological Pathology (ISUP) grading of prostate cancer - An ISUP consensus on contemporary grading. APMIS. 2016;124(6):433-435. doi:10.1111/apm.12533
Figures
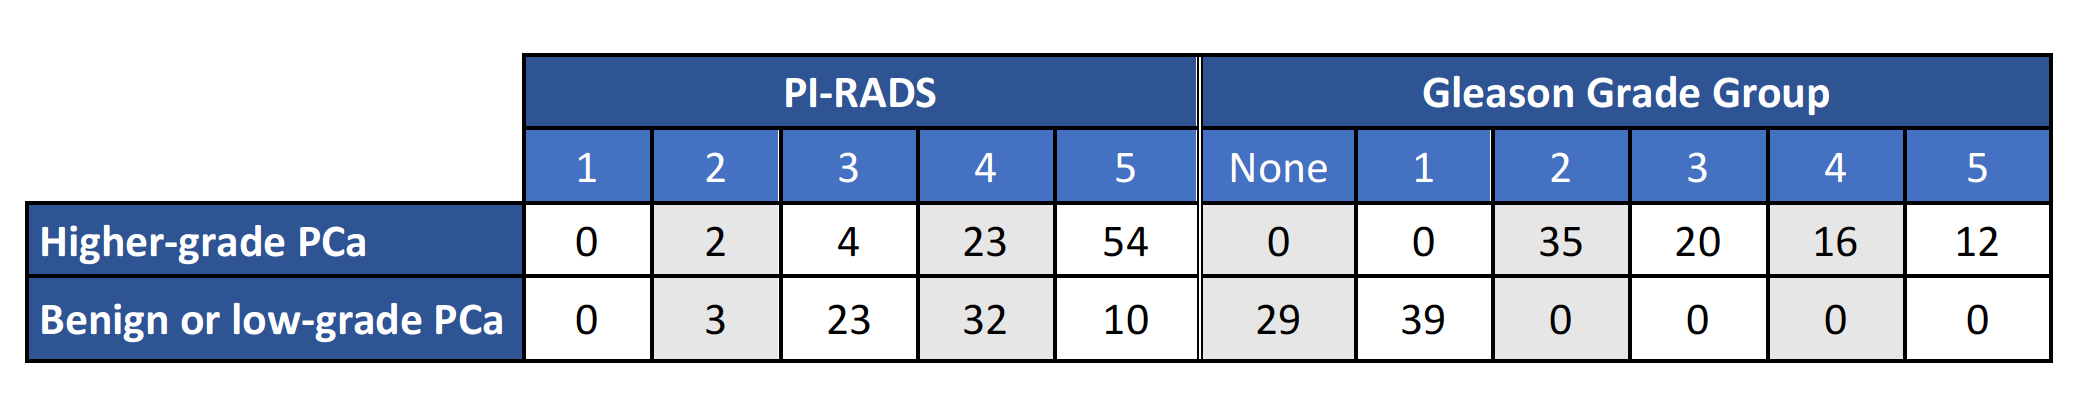
Table 1. PI-RADS and pathology characteristics of patients involved in this study.
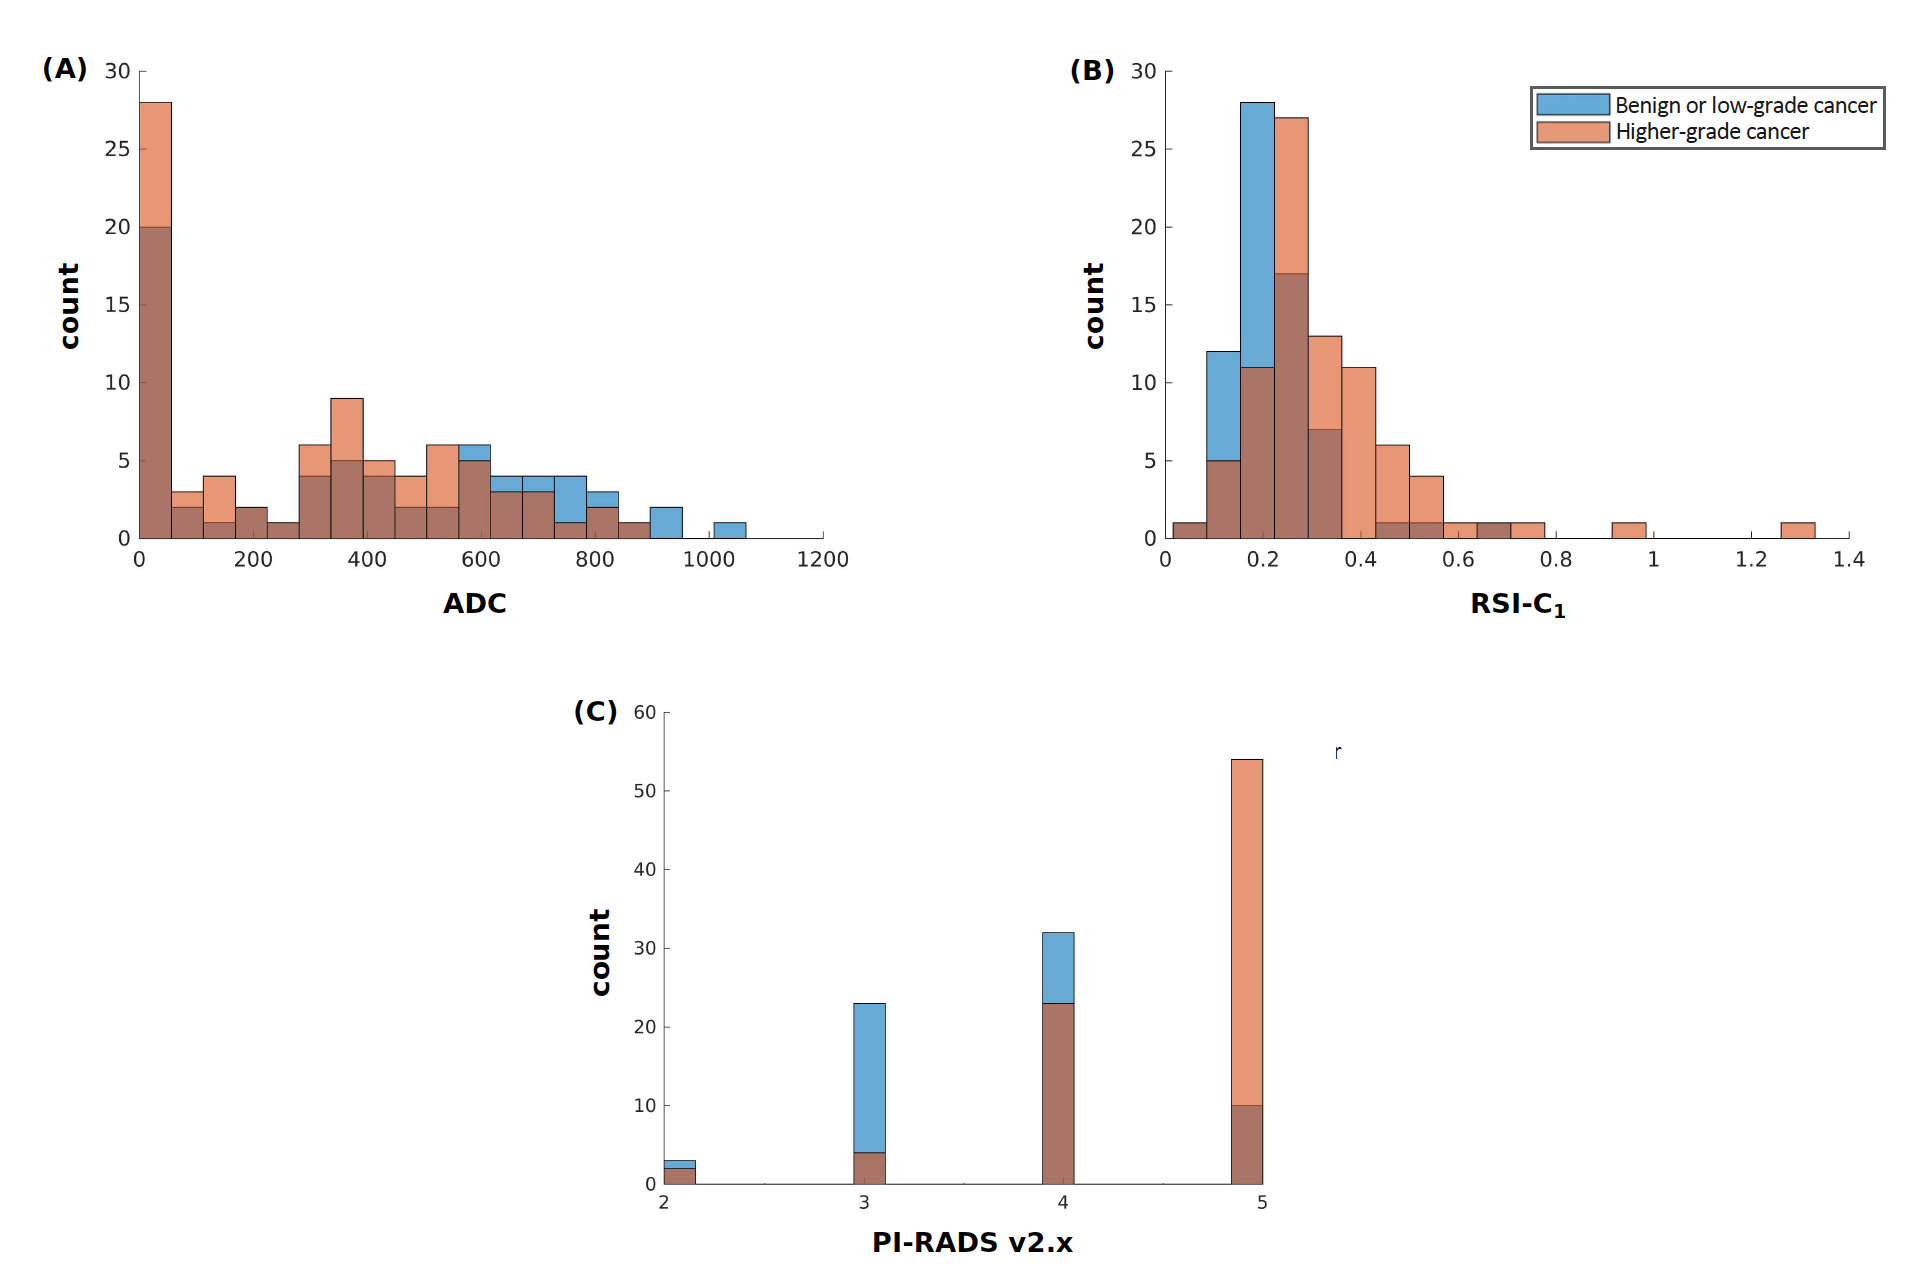
Figure 1. Histograms of (A) conventional ADC (lowest voxel value in prostate), (B) RSI-C1 (highest voxel value in prostate), and (C) highest PI-RADS category (v2 prior to 2019, v2.1 in 2019). Blue: Patients with no cancer or low-grade cancer. Orange: Patients with higher-grade (grade group ≥2) prostate cancer. Brown: where blue and orange overlap.
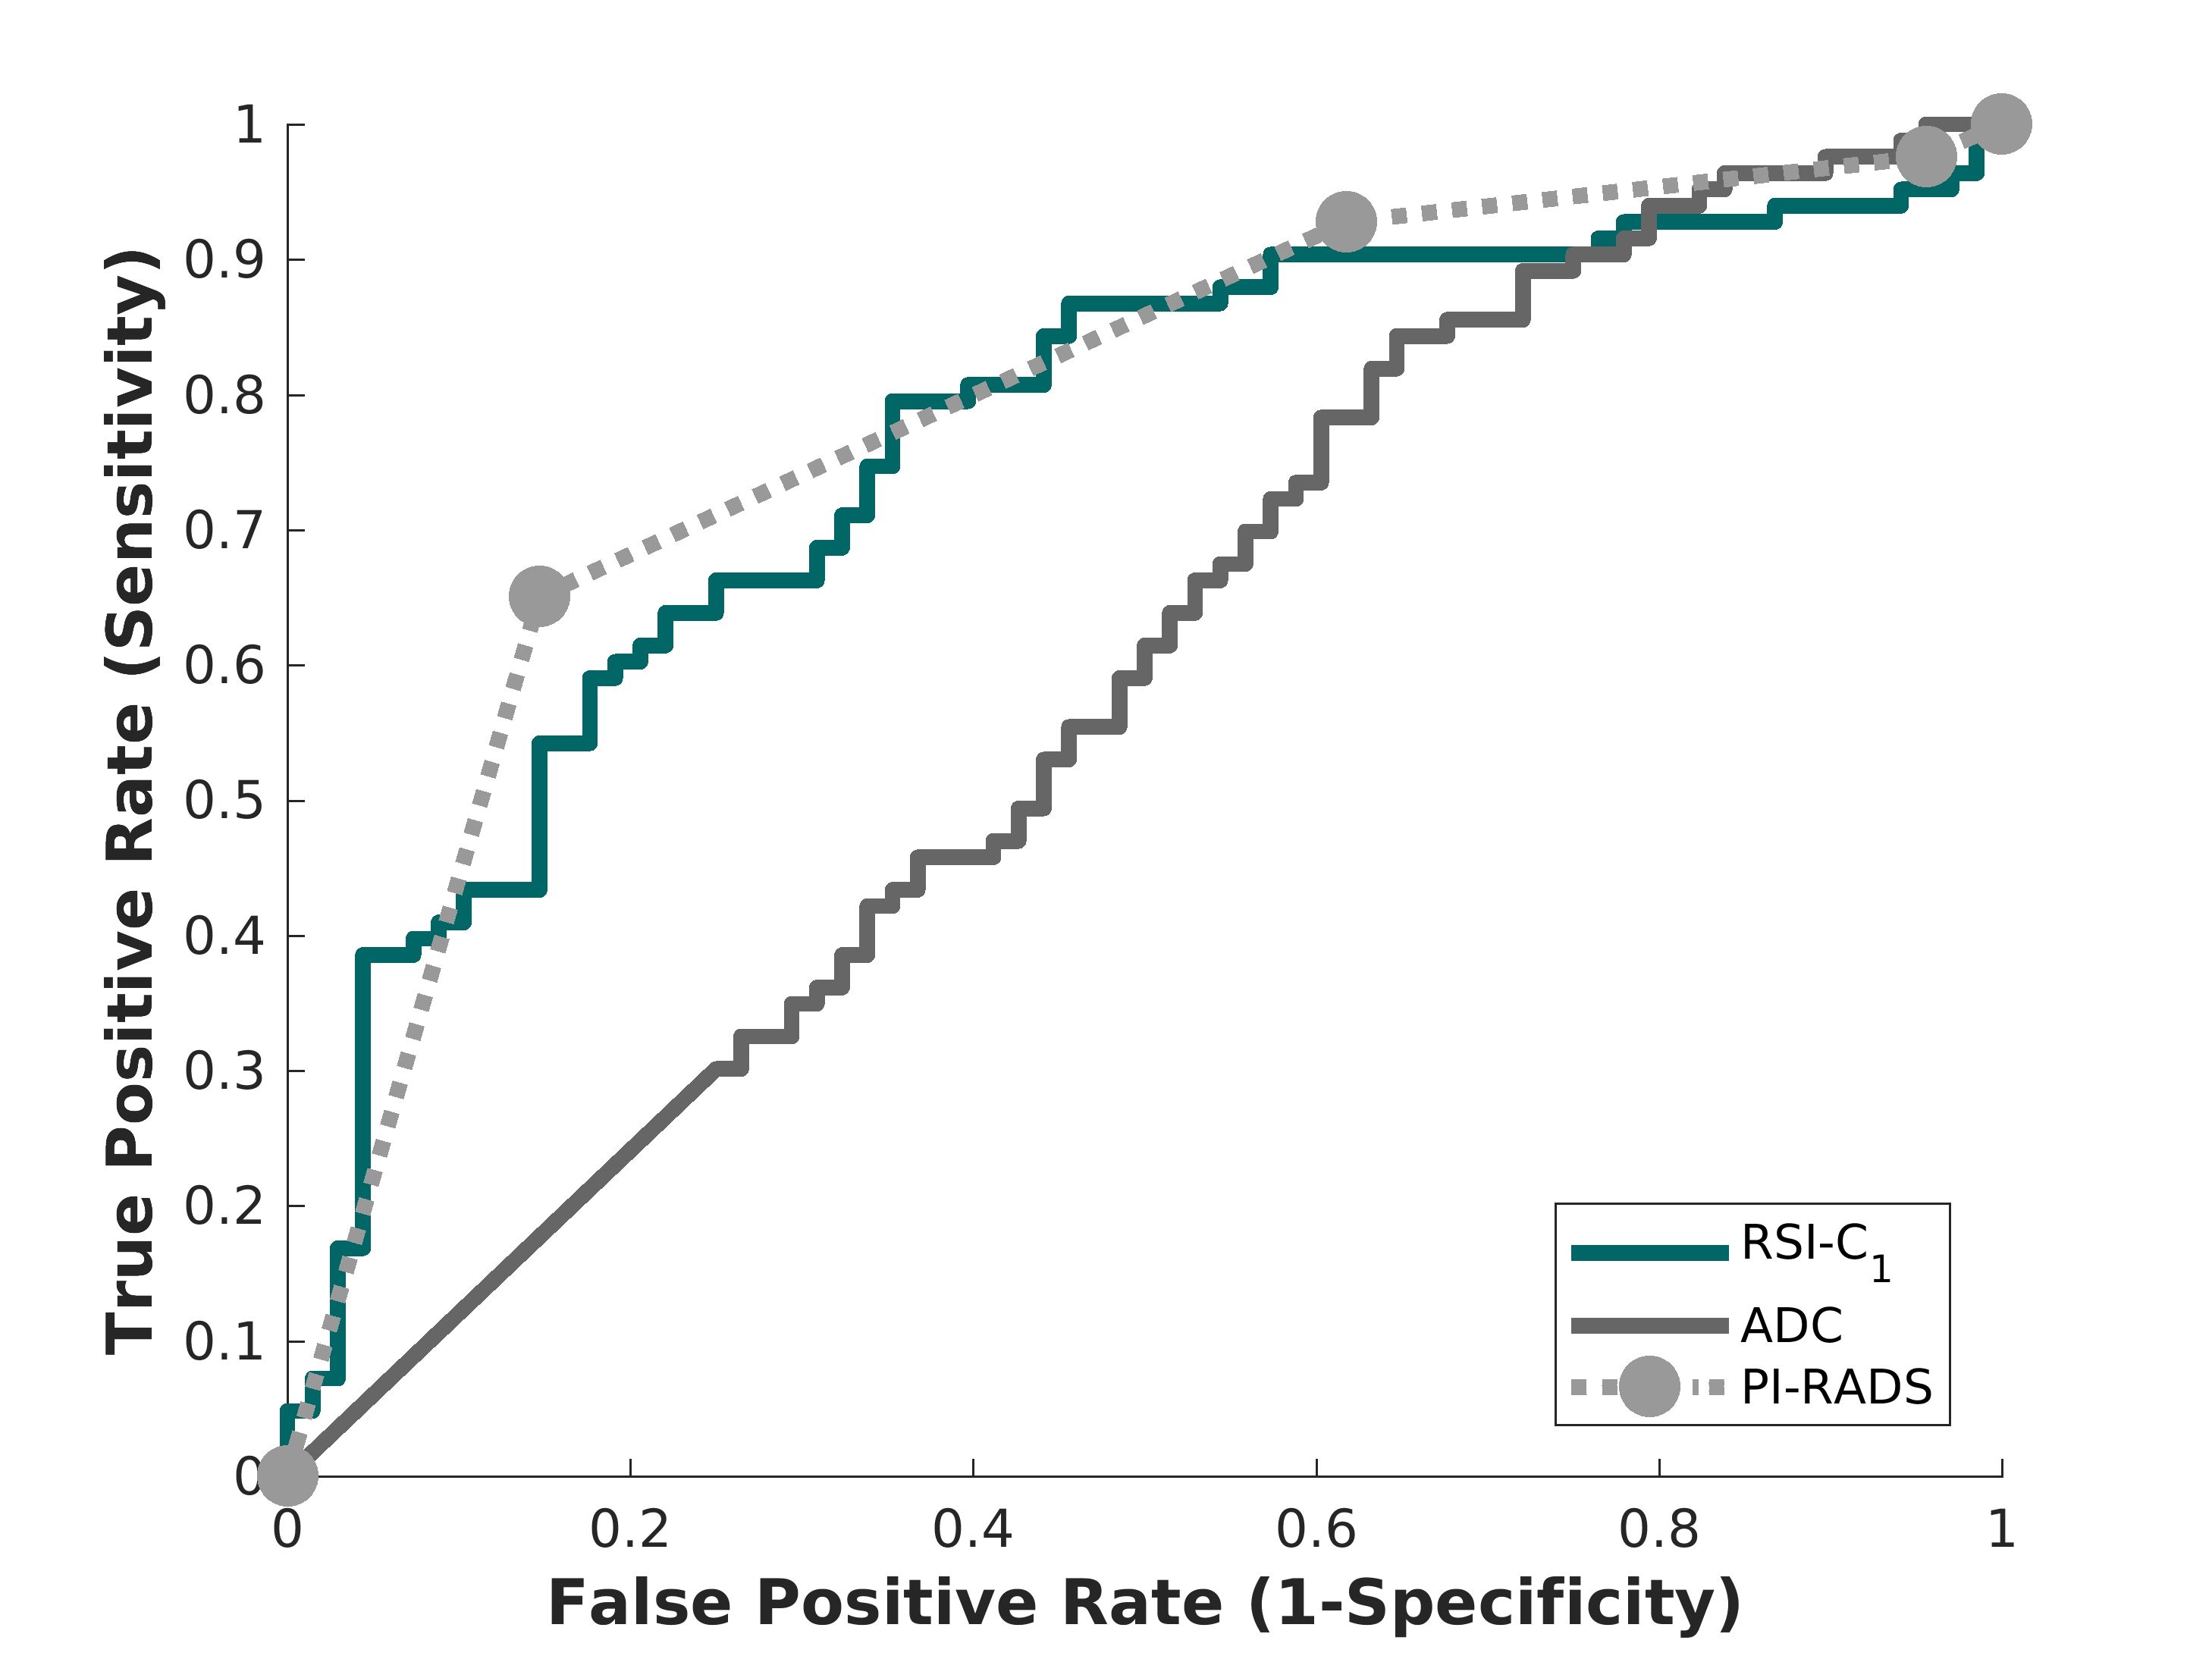
Figure 2. Receiving operator characteristic (ROC) curves for conventional ADC (dark gray), RSI-C1 (green), and PI-RADS v2.x (light gray), for the patient-level detection of higher-grade prostate cancer.