4086
Multi-Readout Diffusion-Weighted Imaging for Studying Coupling between Apparent Diffusion Coefficient and Echo Time1Center for MR Research, University of Illinois at Chicago, Chicago, IL, United States, 2Department of Bioengineering, University of Illinois at Chicago, Chicago, IL, United States, 3Departments of Radiology and Neurosurgery, University of Illinois at Chicago, Chicago, IL, United States
Synopsis
The dependence of apparent diffusion coefficient (ADC) on echo time (TE) has been observed in a number of biological tissues. Such coupling can be exploited to extract tissue microstructural information. We herein introduce a time-efficient sequence that is capable of studying the interplay between ADC and TE. The sequence incorporated multiple echo-train readouts into diffusion-weighted echo planar imaging, together with a 2D RF excitation pulse to reduce the FOV, thereby allowing multiple effective TEs in an acquisition. With this sequence, ADCs were evaluated at three TEs and T2*s at three b-values. The proposed technique has been demonstrated in the prostate.
Introduction:
It has been observed that the measured apparent diffusion coefficient (ADC) depends on the TE in a number of biological tissues1–4. Such coupling can be exploited to extract tissue microstructural information for improved characterization of lesions, such as prostate cancer3,4. In a method known as hybrid multidimensional imaging4, images with multiple b-values and multiple TEs are acquired to study the interplay between ADC and T2, which typically require multiple acquisitions. The approach not only lengthens the scan times but also increases susceptibility to motion. We herein report a time-efficient pulse sequence to acquire diffusion-weighted signals at multiple TEs following a single excitation. This sequence, which we call multi-readout DWI, is capable of obtaining ADC values at different TEs, as well as generating T2* maps at different b-values. This ability has been demonstrated in both healthy prostate tissues and prostatic carcinoma.Methods:
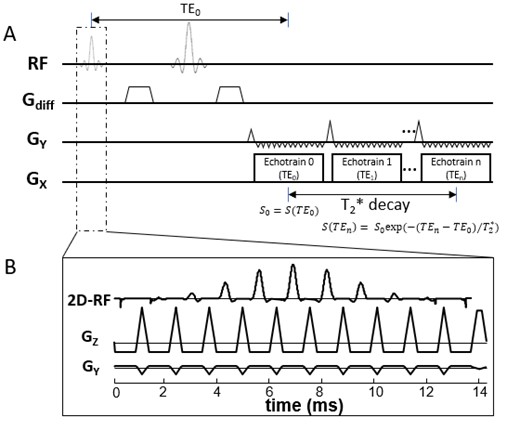
Sequence design: The multi-readout DWI sequence was built upon a spin-echo diffusion-weighted EPI sequence in which multiple (e.g., 3) EPI readout echo-trains were placed after a Stejskal-Tanner diffusion preparation module5 (Figure 1A). Each EPI readout echo-train corresponded to a distinct effective TE, where the effective TE was defined as the TE when k-space center is sampled. The first echo-train coincided with the nominal TE (TE0). Large gradient blips (Figure 1A) along the phase-encoding direction were applied between adjacent echo-trains to re-position the start point of the k-space trajectory for the next echo-train acquisition. To reduce the duration of each echo-train without compromising the spatial resolution so that multiple echo-trains could be acquired, a 2D RF pulse (Figure 1B) was used to limit the FOV6. The 2D RF pulse was designed by employing a fly-back EPI-like excitation k-space trajectory. Eleven sub-pulses with a time-bandwidth product (TBP) of 3.01 were modulated by an envelope pulse whose TBP was 3.53 and pulse width was 14.7 ms. A tilted excitation k-space strategy was employed to enable multi-slice imaging6.Image analysis: Diffusion-weighted images acquired at different TEs were separately reconstructed. The image from the first echo-train (TE0) corresponded to a conventional diffusion-weighted image. Images from the subsequent echo-trains were subject to T2* decay as described by7:
$$S(TE_n) = S_0exp(-(TE_n-TE_0)/T_2^{*})$$
where S0 is the diffusion-weighted signal at TE0. T2* maps at each b-value were obtained from images acquired with three TEs. Similarly, ADC maps were calculated based on three b-values at each TE. From the T2* and ADC maps, the mean values of T2* and ADC were calculated over an ROI and used for comparisons among different b-values and TEs.
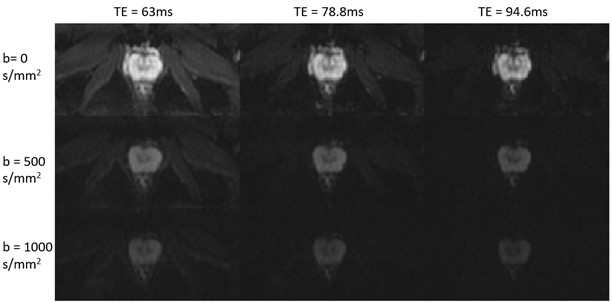
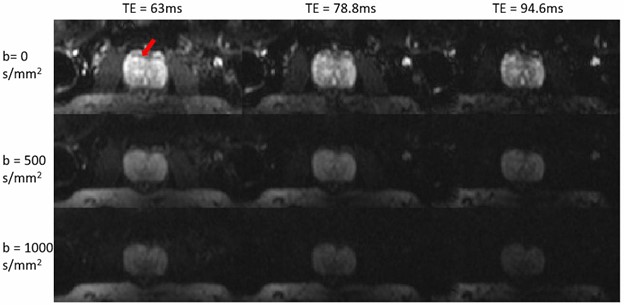
Experiments: The multi-readout DWI sequence was implemented on a GE MR750 3T scanner. To demonstrate the sequence, axial prostate MRI scans were performed using a 32‐channel cardiac coil on healthy volunteers and a patient with confirmed prostate cancer with the following parameters: FOV = 180x90 mm2, reconstruction matrix = 128x64, number of slices = 18, slice thickness = 3 mm, slice spacing = 1 mm, TR = 4000 ms, number of echo-trains = 3, TEs = 63/78.8/94.6 ms, and b = 0/500/1000 s/mm2, NEX = 6, and the scan time = 3 min and 40 s.
Results:
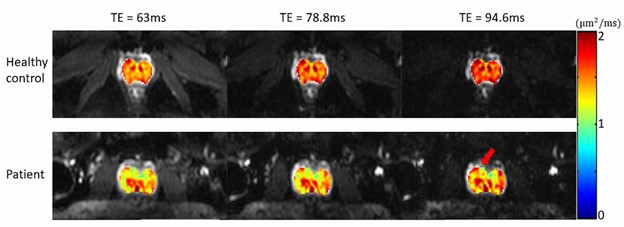
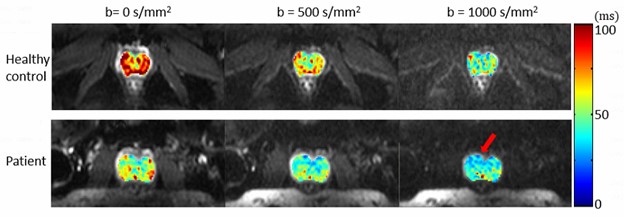
Figures 2 and 3 display a set of multi-dimensional diffusion-weighted prostate images, with different b-values and TEs, for a representative healthy subject and the patient with prostate cancer, respectively. The ADC maps at each TE values for the two subjects are shown in Figure 4, whereas the T2* maps at each b-value are illustrated in Figure 5. In both healthy and cancerous prostate tissues, ADC increased with TEs (Figure 4). However, the ADC values in the prostate cancer exhibited a higher degree of heterogeneity and a lower value than those in the healthy prostate gland. Figure 5 indicates that T2* values decreased as b-valued increased for both subjects. Additionally, the prostate cancer exhibited a lower T2* value.Discussion and conclusion:
In this study, we have demonstrated a novel sequence – multi-readout DWI – that was capable of producing diffusion-weighted images at different TEs following an excitation without extending the scan time. This approach also resulted in a set of spatially co-reregistered images across multiple TEs, reducing or eliminating the problems caused by motion. In normal prostate tissue, ADC and T2* values changed with TE and b-values, respectively, consistent with the observations reported in previous studies3,4. These coupling was likely a reflection of the underlying tissue microstructures related to the amounts of stroma, epithelium, and lumen in the prostate3. For example, fluid in the glandular lumina has a long T2* and a high ADC, while stroma and epithelium have shorter T2* and lower ADC values. DWI with high b-values suppressed signals from rapidly diffusing spins in the glandular lumen, and thus highlighted shorter T2* signals from stroma and epithelium. Alternatively, long TEs highlighted long T2* signals in lumen, which are characterized by a high ADC. Although this study employed prostate imaging as an example, the multi-readout DWI sequence is expected to find other applications in tissues where the coupling of ADC and TEs may provide useful information to aid in diagnosis.Acknowledgements
This work was supported in part by the National Institutes of Health (5R01EB026716-01 and 1S10RR028898-01). The content is solely the responsibility of the authors and does not necessarily represent the official views of the National Institutes of Health. The authors are grateful to Drs. Muge Karaman, Qingfei Luo, Kezhou Wang, and Cui Feng for helpful discussions.References
1. Stanisz GJ, Henkelman RM. Diffusional anisotropy of T2 components in bovine optic nerve. Magn Reson Med. 1998.
2. Does MD, Gore JC. Compartmental study of diffusion and relaxation measured in vivo in normal and ischemic rat brain and trigeminal nerve. Magn Reson Med. 2000.
3. Wang S, Peng Y, Medved M, et al. Hybrid multidimensional T2 and diffusion-weighted MRI for prostate cancer detection. J Magn Reson Imaging. 2014.
4. Chatterjee A, Bourne RM, Wang S, et al. Diagnosis of prostate cancer with noninvasive estimation of prostate tissue composition by using hybrid multidimensional MR imaging: A feasibility study. Radiology. 2018.
5. Stejskal EO, Tanner JE. Spin diffusion measurements: Spin echoes in the presence of a time-dependent field gradient. J Chem Phys. 1965.
6. Finsterbusch J. Fast-spin-echo imaging of inner fields-of-view with 2D-selective RF excitations. J Magn Reson Imaging. 2010.
7. Eichner C, Paquette M, Mildner T, et al. Increased sensitivity and signal-to-noise ratio in diffusion-weighted MRI using multi-echo acquisitions. Neuroimage. 2020.
Figures