4084
Diagnostic value of intro-voxel incoherent movement (IVIM) for infrapatellar fat pad high signal intensity in patient with osteoarthritis
Hui Tan1, Bin Wang1, Wulin Kang1, Nan Yu1, Yong Yu1, Shaoyu Wang2, Yue Li1, and Tuona Di1
1Shaanxi University of Chinese Medicine, Xianyang, China, 2Siemens Healthineers, Shanghai, China
1Shaanxi University of Chinese Medicine, Xianyang, China, 2Siemens Healthineers, Shanghai, China
Synopsis
This study aimed to investigate the role of IVIM in assessing infrapatellar fat pad high signal intensity in patients with osteoarthritis. Totally 43 patients with mild to moderate (K/L score = 1,2 and 3) KOA were included. The results show that D value, VAS, WOMAC, K/L score with T2FS-hyperintense regions were significantly higher than those without T2FS-hyperintense regions. Furthermore, D value was significantly positive associated with VAS and K/L score.
Introduction:
The infrapatellar fat pad (IPFP) has been proposed as possible source of knee pain in patients suffering from osteoarthritis (OA). And the fat-suppressed T2 (T2FS) hyperintense regions of IPFP is an important imaging feature of knee OA, which is considered as the manifestation of inflammation[1]. The aim of this study was to quantitatively evaluate blood perfusion parameters of IPFP within T2FS-hyperintense regions in patients with symptomatic mild to moderate KOA by using IVIM in 3 T MR.Methods:
In this study, the patients' knee radiographs were first acquired and scored according to the K/L score. Totally 43 patients with mild to moderate (K/L score = 1,2 and 3) KOA were included and underwent MRI, comprising fat-suppressed T2WI and IVIM sequences. The Knee joint of each subject was examined using a 3 Tesla (3T) MR scanner (MAGNETOM Skyra, Siemens Healthcare, Erlangen, Germany). An eight-channel knee coil was used for all the MR knee scanning in a supine position and feet first mode. The IVIM sequence with the following parameters: TR/TE= 3700/50ms, 6 b values (0, 50, 100, 200, 400 and 800 sec/mm2) on 3 gradient directions, FOV= 170 × 170 mm2, voxel size 1.8 × 1.8 × 4 mm3, slice thickness of 4 mm with no gap, acquisition time 6 minutes 30 seconds. The regions of interest (ROIs) were delineated in T2FS-hyperintense IPFP regions on IVIM parameter images and a reference region was drawn in IPFP tissue with normal signal intensity. The visual analogue scale (VAS) and Western Ontario and McMaster Universities Osteoarthritis Index (WOMAC) total score were also assessed. The independent samples t-test were performed to evaluate the significance of the inter-group difference in IVIM parameters (D, D* and f), K/L score, VAS and WOMAC.Results:
T2FS-hyperintense IPFP regions were present in 29 of 43 (67.4%) OA patients, including a non-T2FS-hyperintense (nT2H) group (n=14, 8 male, age= 53.9 ± 9.6 years), and a T2FS-hyperintense (T2H) group (n=29, 15 male, age= 56.7 ± 11.2 years). D value, VAS, WOMAC, K/L score in the T2H group were significantly higher than those in nT2H group (1.639 versus 0.440, 17.06 versus 12.40, 85.01 versus 70.22 and 2.10 versus 1.57, respectively; all P values < 0.05), while there were no statistical significant difference in D* and f (P > 0.05). Furthermore, D value was significantly positive associated with VAS (r2=0.376, p = 0.013) and K/L score (r2=0.332, p = 0.030), but not with WOMAC.Conclusion:
IPFP T2FS-hyperintense regions are associated with higher perfusion measured by IVIM, which could quantitatively evaluate the pathological changes of infrapatellar fat pad in patients with knee OA.Acknowledgements
No acknowledgement found.References
1. Vries B A D , Heijden R A V D , Poot D H J , et al. Quantitative DCE-MRI demonstrates increased blood perfusion in Hoffa's fat pad signal abnormalities in knee osteoarthritis, but not in patellofemoral pain[J]. European Radiology, 2020(30): 335–347.Figures
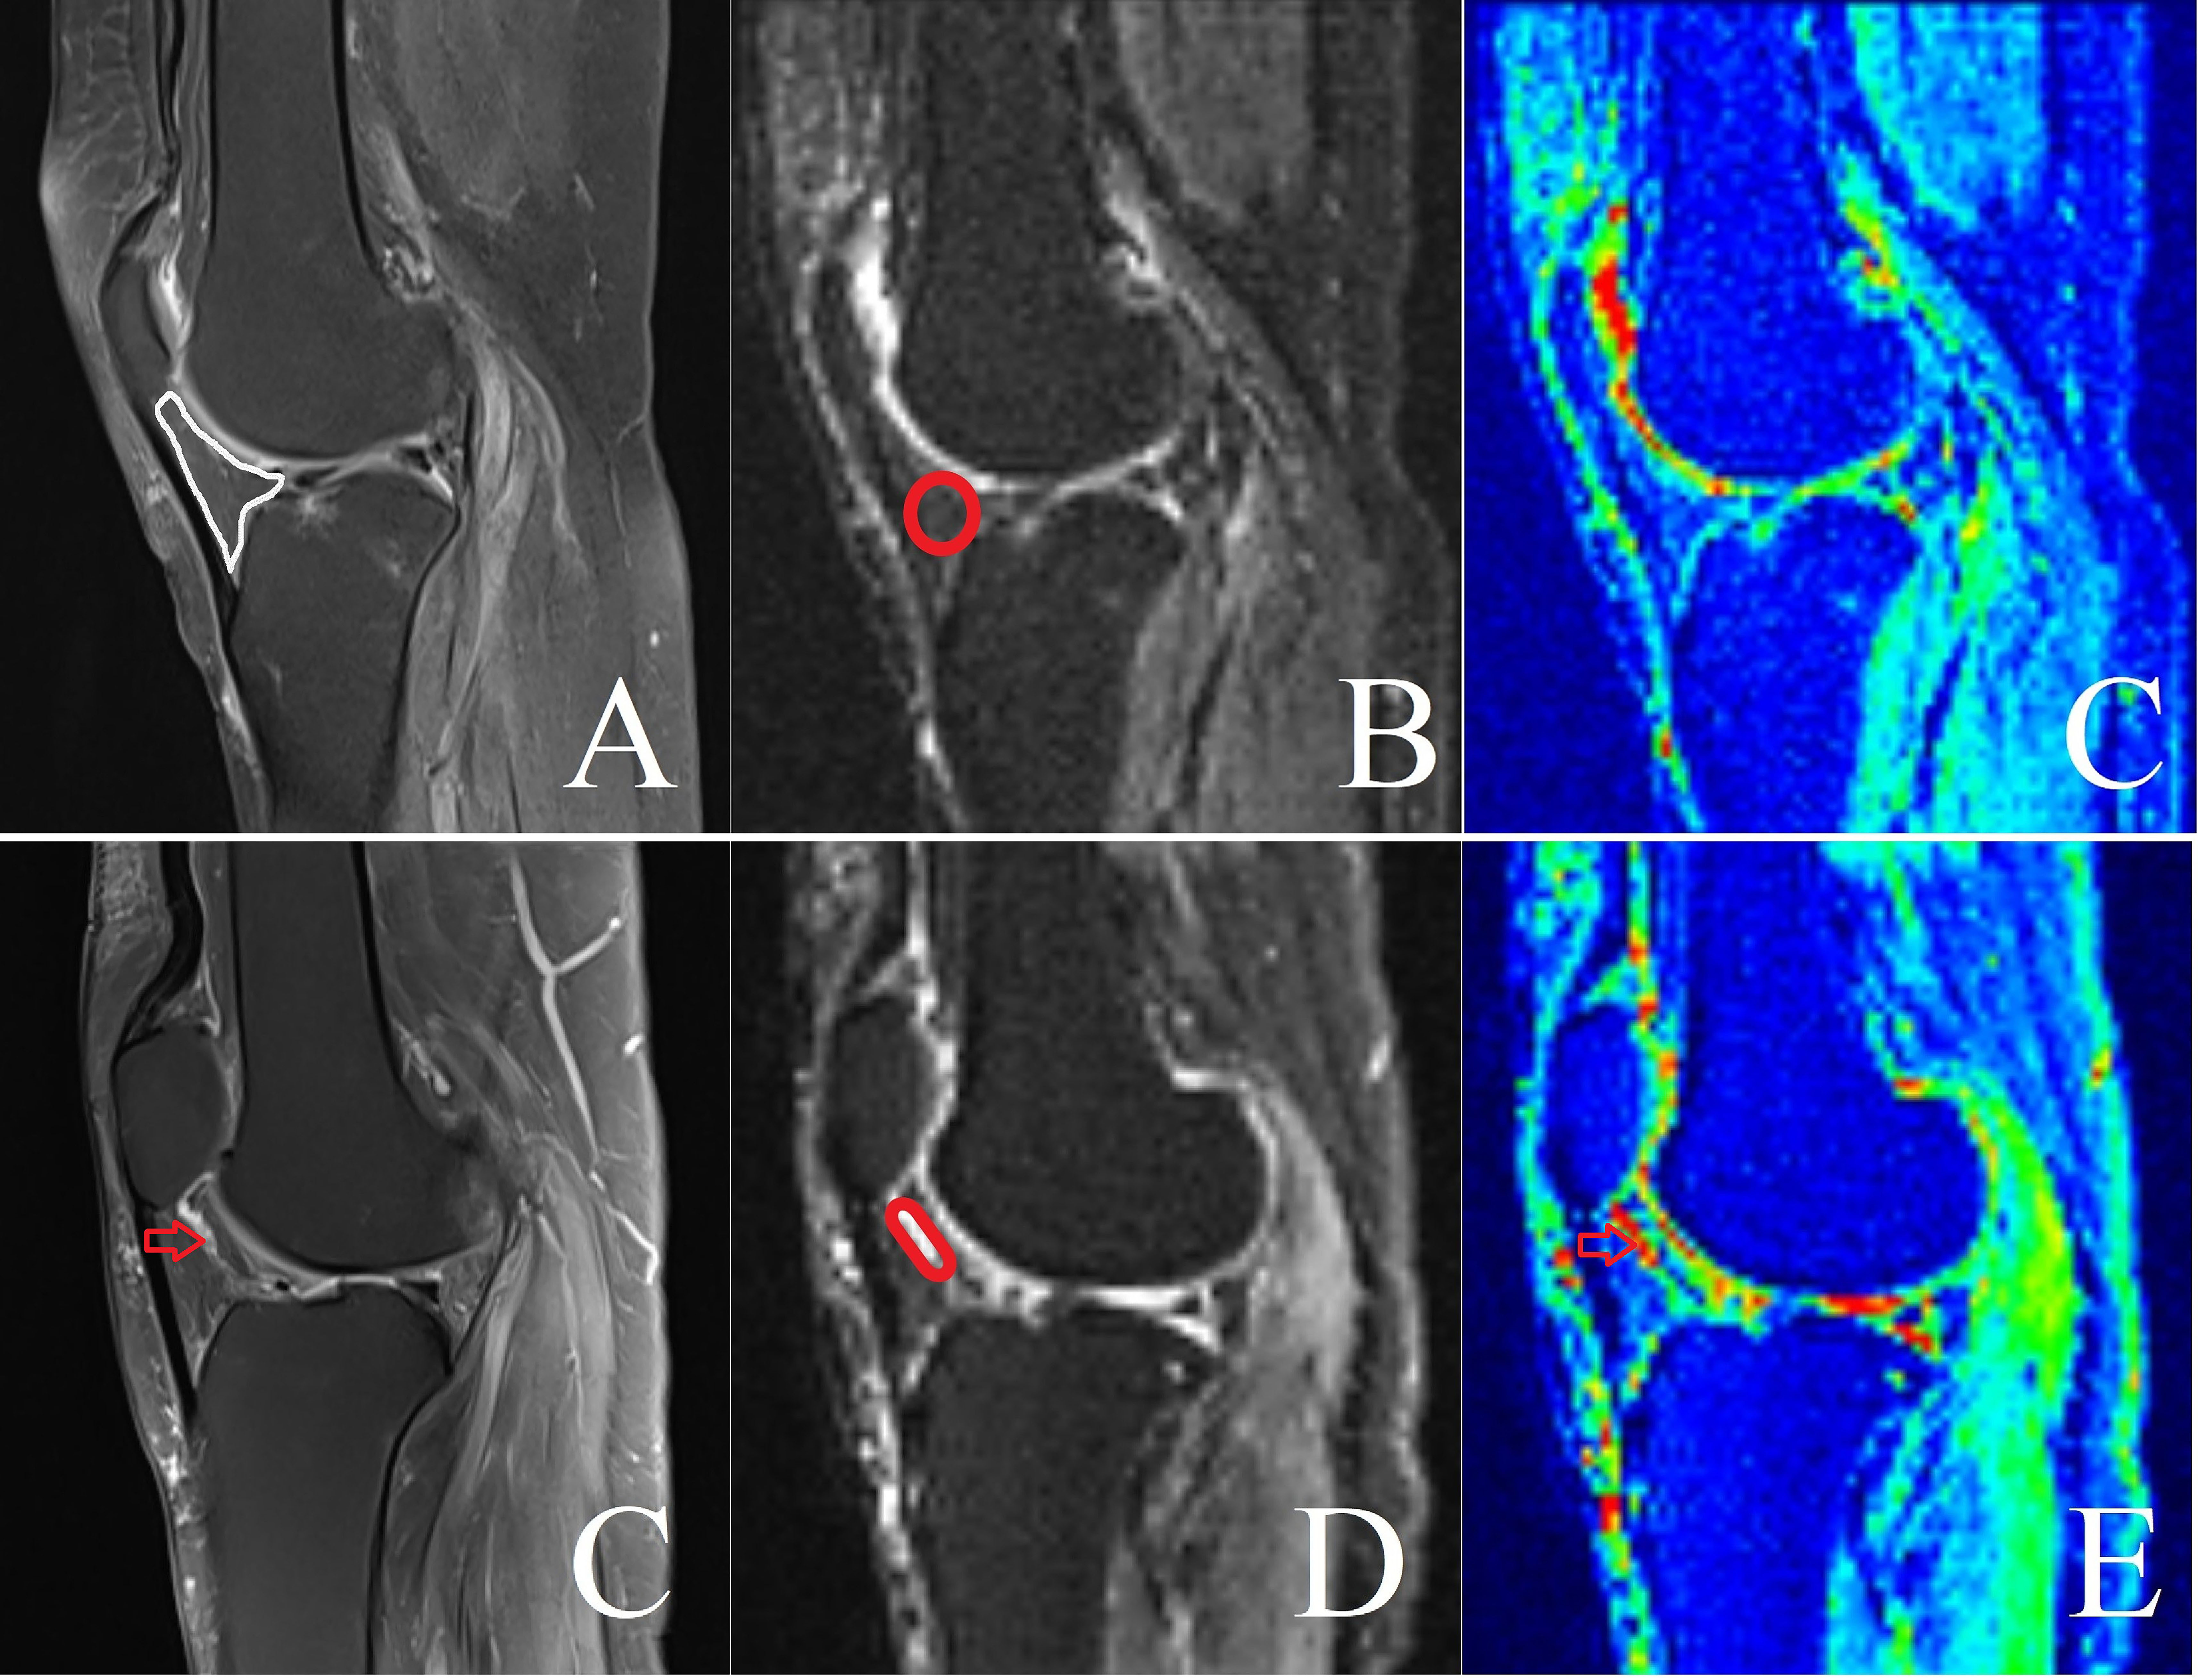
Figure.
A-C: A 62 years old female patient with OA, K/L score=1, VAS=15, WOMAC= 60.
Representative sagital images T2FS (A), IVIM (B), and pseudo-color map of the
IVIM (C). The ROI was drawn in the IPFP without T2FS-hyperintense regions in
IVIM map. D-F: A 66 years old female patient with OA, K/L score =2, VAS= 22,
WOMAC=79. Red arrow indicated T2FS-hyperintense region within IPFP on T2 map(D)
and pseudo-color map of the IVIM (F), and high perfusion were depicted in red
(F). The ROI was drawn in the T2FS-hyperintense region in IVIM map (E).