4082
Diffusion MRI of THAs for the Classification of Synovial Reactions1Radiology and Imaging, Hospital of Special Surgery, New York, NY, United States, 2Medical College of Wisconsin, Milwaukee, WI, United States
Synopsis
The classification of synovial reactions caused by adverse local tissue reactions or prosthetic joint infections in total hip arthroplasty patients has remained a challenge due to the in-plane and through-plane distortions caused by metallic components. MAVRIC-based diffusion weighted imaging (DWI) is an innovative MRI technique sensitive to microstructural fluid changes and utilizes apparent diffusion coefficient values for the differentiation of diseased and non-diseased tissues. This study evaluated the effectiveness of MAVRIC-based DWI and T2 mapping in differentiating between types of synovial reactions. Our DWI ADC biomarker showed promise in differentiating between normal and abnormal synovial reaction subtypes within THA patients.
Introduction
Many total hip arthroplasty (THA) devices function well overtime1, but some patients have reported the development of adverse local tissue reactions (ALTR)2 or prosthetic joint infections (PJI)3. Non-invasive monitoring of THAs for adverse effects in soft tissues using magnetic resonance imaging (MRI) may be beneficial for THA patients. MRI of THA is challenging due to the significant in-plane and through-plane distortions caused by the metallic components4. Multi-spectral imaging techniques such as multi-acquisition variable-resonance image combination (MAVRIC)5 can mitigate these distortions to generate clinically viable images for the evaluation of periprosthetic tissues. Quantitative MRI techniques, such as diffusion-weighted imaging (DWI) and T2 mapping, are sensitive to microstructural changes in articular cartilage6,7 and other soft tissues, but conventional quantitative MRI acquisitions are not typically performed with MAVRIC. MAVRIC based DWI8 and T2 mapping5 have been recently developed and applied for the evaluation of tissues near total joint arthroplasty5. These sequences may prove to be sensitive to microstructural fluid changes due to ALTR and PJI. Specifically, DWI images provide apparent diffusion coefficient (ADC) values that may help differentiate between diseased and non-diseased tissue9. The objective of this study was to evaluate DWI-MAVRIC and T2-MAVRIC in classifying synovial tissue reactions in patients with THA. We hypothesized that DWI ADC and T2 differences would be found between different classifications of synovial reactions.Methods
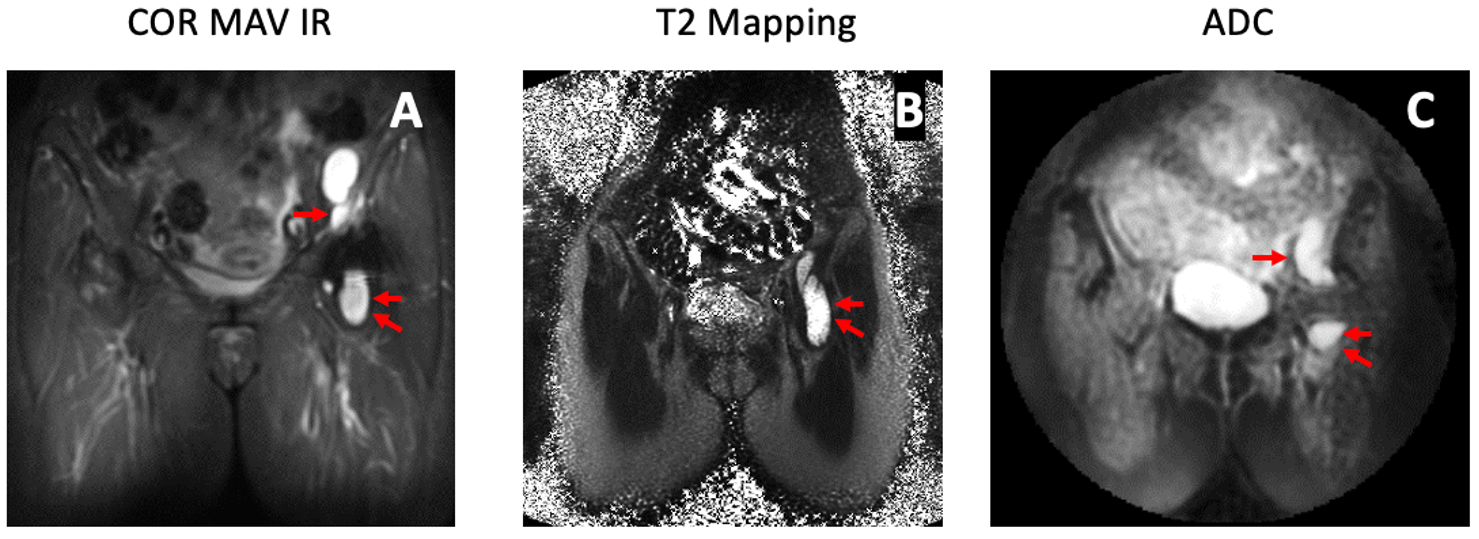
Following IRB approval with informed written consent, patients with THA undergoing routine MRI at our institution were enrolled. To date, we have evaluated 33 THAs, with 38 distinct synovial regions-of-interest (ROI) (30 subjects, age=66.6±8.7 years, 16F/14M; 3 subjects had bilateral THAs, of which 3 hips had two distinct ROIs and 1 hip had three distinct ROIs) with the DWI-MAVRIC and T2-MAVRIC sequences. All images were acquired using a clinical 1.5T MR450 scanner (GE Healthcare) with an 8-channel cardiac coil (Invivo). Morphologic imaging was performed using 2D-FSE10 and MAVRIC-SL acquisitions11. Next, T2-MAVRIC (2 TEs: 9.8/50 ms, TR: 3.5s, Matrix: 512x256, slice thickness: 3.5 mm, FOV: 36-40 cm, ETL: 48, scan time: ~6 min) and DWI-MAVRIC (TR: 2s, TE: 65ms, Matrix: 96x96, ETL:32, scan time: ~5 min) series were acquired. Morphologic images were evaluated for the presence of synovitis, and radiological impression of synovial reaction type: (fluid-like, or mixed [i.e. solid and fluid]), and global synovial reaction classification12: normal, metallosis, polymeric, infection, or mixed polymeric/metallosis. T2 maps were calculated from the dual-echo acquisition13, and ADC maps were generated from the DWI acquisition (Figure 1).Statistical Analysis: To facilitate data comparisons, the synovial reaction classifications were divided into ‘normal’ (i.e. synovial fluid present, but without synovitis present) and ‘abnormal’ (all non- ‘normal’ classes). Marginal linear models were used to compare the differences in synovial and reference (surrounding unaffected muscle) ROIs between synovial classifications and types, adjusted for ROI area and within-subject regional correlations. Statistical significance was deemed if p<0.05 (SAS V.9.4).
Results
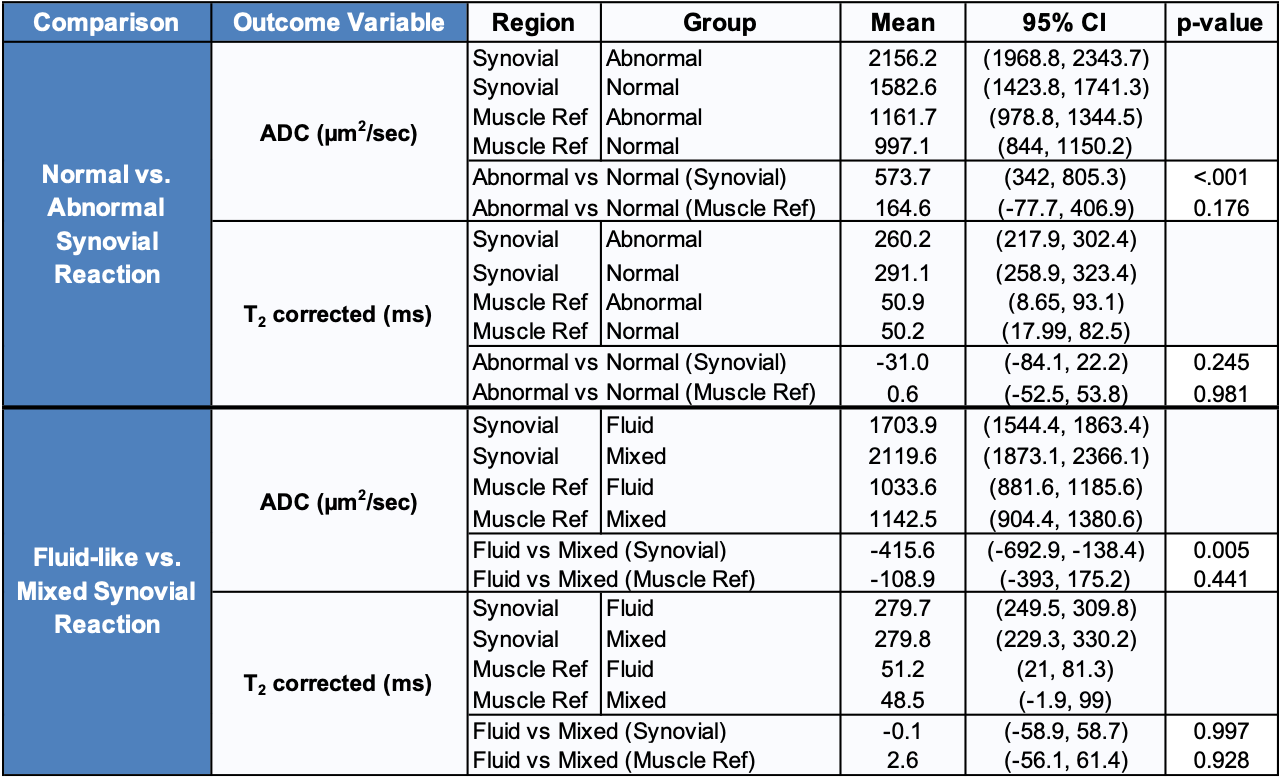
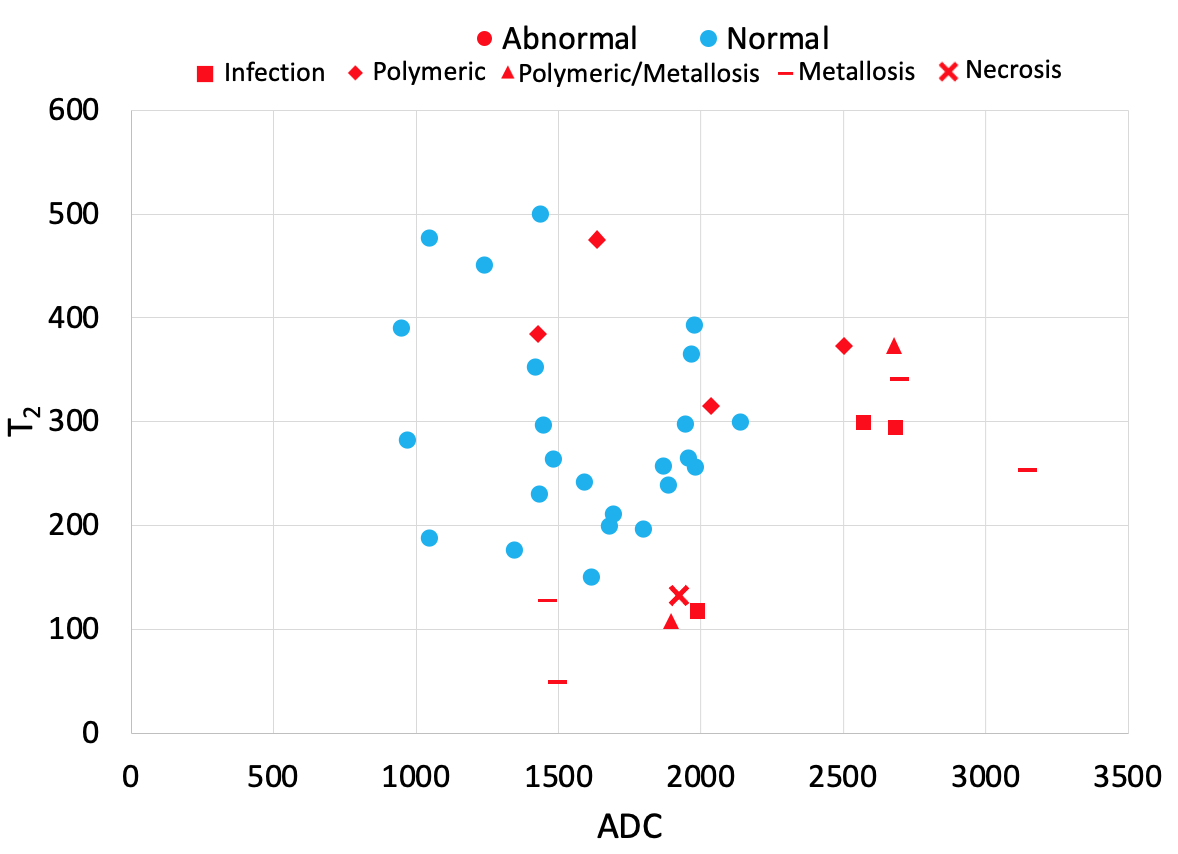
A majority of ROIs had a global synovial classification of ‘normal’ (24/38, 63.2%), and most had a fluid-like synovial reaction (28/38, 73.7%). All ROIs classified as ‘normal’ were of fluid-like type. The ROIs with the classification of ‘abnormal’ were infection (3/14, 21%), necrosis (1/14, 7%), metallosis (4/14, 29%), polymeric (4/14, 29%), and mixed polymeric/metallosis (2/14, 14%). These abnormal ROIs had a synovitis type of fluid (4/14, 29%) or mixed (10/14, 71%). The synovial ADC for ‘abnormal’ was higher than ‘normal’ (mean difference of 573.7 µm2/s, p<0.001, Table 1, Figure 2). Synovial ADC for fluid was lower than mixed (mean difference of 415.6 µm2/s, p<0.001). Other comparisons were not statistically significant. A weak (R2=0.0005) and insignificant correlation was found between ADC and T2 mapping.Discussion
Our preliminary study showed MAVRIC-based DWI could quantitatively differentiate between abnormal/normal and fluid/mixed synovial reactions in THA subjects. While T2 differences were not significant, joint T2-ADC analysis may help stratify between ‘abnormal’ categories. We will continue to increase subject enrollment, with the potential for evaluation of patients undergoing revision surgery for direct histologic validation of the imaging.Conclusion
DWI ADC is a promising biomarker for identifying abnormal synovial reactions within THA patients. Furthermore, the combined analysis of ADC with T2 mapping may provide stratification of abnormal synovitis type.Acknowledgements
The research reported in this abstract was supported by NIH/NIAMS under award number R01AR064848. The content is solely the responsibility of the authors and does not necessarily represent the official views of the NIH. The authors thank VE Arpinar for technical support.References
1. Berry DJ, Harmsen WS, Cabanela ME, et al. Twenty-five-year survivorship of two thousand consecutive primary Charnley total hip replacements: factors affecting survivorship of acetabular and femoral components. J Bone Joint Surg Am. 2002;84(2):171-177.
2. Hart AJ, Sabah S, Henckel J, et al. The painful metal-on-metal hip resurfacing. J Bone Joint Surg Br. 2009 Jun;91(6):738-44.3. Galley J, Sutter R, Stern C, et al. Diagnosis of Periprosthetic Hip Joint Infection Using MRI with Metal Artifact Reduction at 1.5 T. Radiology. 2020 Jul;296(1):98-108.
4. Koff MF, Shah P, Koch KM, et al. Quantifying image distortion of orthopedic materials in magnetic resonance imaging. J Magn Reson Imaging. 2013 Sep;38(3):610-8.
5. Bhave S, Koff MF, Sivaram Kaushik S, et al. 3D-multi-spectral T2 mapping near metal implants. Magn Reson Med. 2019 Aug;82(2):614-621.
6. Pedoia V, Li X, Su F, et al. Fully automatic analysis of the knee articular cartilage T1ρ relaxation time using voxel-based relaxometry. J Magn Reson Imaging. 2016 Apr;43(4):970-80.
7. Ferizi U, Ruiz A, Rossi I, et al. A robust diffusion tensor model for clinical applications of MRI to cartilage. Magn Reson Med. 2018 Feb;79(2):1157-1164.
8. Koch KM, Bhave S, Gaddipati A, et al. Multispectral diffusion-weighted imaging near metal implants. Magn Reson Med. 2018 Feb;79(2):987-993.
9. Yao K, Troupis JM. Diffusion-weighted imaging and the skeletal system: a literature review. Clin Radiol. 2016 Nov;71(11):1071-82.
10. Hayter CL, Koff MF, Potter HG. Magnetic resonance imaging of the postoperative hip. J Magn Reson Imaging. 2012 May;35(5):1013-25.
11. Zochowski KC, Miranda MA, Cheung J, et al. MRI of Hip Arthroplasties: Comparison of Isotropic Multiacquisition Variable-Resonance Image Combination Selective (MAVRIC SL) Acquisitions With a Conventional MAVRIC SL Acquisition. AJR Am J Roentgenol. 2019 Dec;213(6):W277-W286.
12. Koff MF, Esposito C, Shah P, et al. MRI of THA Correlates With Implant Wear and Tissue Reactions: A Cross-sectional Study. Clin Orthop Relat Res. 2019 Jan;477(1):159-174.
13. Koff MF, Amrami KK, Felmlee JP, et al. Bias of cartilage T2 values related to method of calculation. Magn Reson Imaging. 2008 Nov;26(9):1236-43.
Figures