4081
A preliminary study on the effect of compressed SENSE with multiple acceleration factors on knee examination
Nan Zhang1, Qingwei Song2, Ailian Liu2, Renwang Pu2, Haonan Zhang2, Jiazheng Wang3, and Liangjie Lin3
1The First Affilliated Hospital of Dalian Medical University, Dalian, China, 2The First Affiliated Hospital of Dalian Medical University, Dalian, China, 3Philips Healthcare, Beijing, China, Beijing, China
1The First Affilliated Hospital of Dalian Medical University, Dalian, China, 2The First Affiliated Hospital of Dalian Medical University, Dalian, China, 3Philips Healthcare, Beijing, China, Beijing, China
Synopsis
2D scans remain as standard for routine examination of joint lesions due to the short scan time. This study aims to explore feasibility of compressed SENSE with different acceleration factors in 3D high-resolution PD weighted imaging of knee joint.
Introduction:
MRI scans of the knee joint are in great clinical demand. The European Society of Musculoskeletal Radiology (ESSR) and the American College of Radiology (ACR) provide general guidance for knee-joint MRI protocols that recommend the use of two-dimensional (2D) turbocharging [1,2]. The spin echo (TSE) sequence and suggests that an additional 3D sequence should be used. However, the existing guidelines do not explicitly provide guidance for the use of accelerated techniques, which is necessary in clinical practice, especially for three-dimensional (3D) sequences with long scan times. The application of compressed sensing (CS) technology solves this problem [3, 4].Methods:
MR scans on 11 volunteers (44.00±19.65, range:11-64 years ,3 women) were performed on a 3.0 T scanner (Ingenia CX, Philips Healthcare, Best, the Netherlands) using a 16‐channel knee coil. The 3D high-resolution (HR) proton density (PD) weighted imaging (3D-HR-PD) was scanned without (CS0, as a reference scan) and with acceleration by compressed SENSE (acceleration factor, AF: 4 ,6, 8 ,10 and 12; CS4-CS12). The other scan parameters were listed in Table 1. Raw data were transfer to the Philips IntelliSpace Portal for signal-to-noise ratios (SNRs) and contrast-to-noise ratios (CNRs) measurement. (Fig 1). Regions of interest (ROIs) were drawn on bone (distal femur), muscle (gastrocnemius muscle), meniscus (the anterior horn of the lateral meniscus and the posterior angle of the lateral meniscus) and ligament (anterior cruciate ligament and posterior cruciate ligament). SNRs for bone, muscle, meniscus and synovial fluid were calculated from the ROIs by dividing the average signal intensity (SI) value by the standard deviation (SD) of the tissue, as described previously [引文]. The independent samples Kruskal-Wallis test was used to identify the differences of SNRs and CNRs among scans with different AFs.Results:
The scan time significantly decreased as the CS factor increased (Table 1). The SNRs and CNRs measured for femur, posterior side of meniscus, anterior cruciate ligament and posterior cruciate ligament were significantly different among the 6 scans. CS8 has shown well before, CS10 and CS12 are significantly different from CS0. No difference was observed for SNRs measured from the anterior cruciate ligament of posterior cruciate ligament among the scans with different AFs.Discussion and Conclusion:
Although applications of CS in musculoskeletal imaging are still limited, previous work already showed significantly reduced scan times especially with 3D sequences. However, it has also been suggested that optimization based on the scanned anatomy is essential to enable this new technology to be implemented in clinical routine. Our results show that compressed SENSE enables acceleration (with a factor up to 8) of 3D high resolution knee-joint imaging without loss of image quality or diagnostic certainty.Acknowledgements
No acknowledgement found.References
[1] European Society of Skeletal Radiology, Guidelines for MR Imaging of Sports Injuries, (n.d.). [2] American College of Radiology, ACR–SPR–SSR PRACTICE PARAMETER FOR THE PERFORMANCE AND INTERPRETATION OF MAGNETIC RESONANCE IMAGING (MRI) OF THE KNEE, (n.d.). [3]Bratke G, et al. Accelerated MRI of the Lumbar Spine Using Compressed Sensing: Quality and Efficiency. J Magn Reson Imaging 2018; 49: e164-e175; [4]Vu KN, Gilbert G, Chalut M, et al. MRI-determined liver proton density fat fraction, with MRS validation: Comparison of regions of interest sampling methods in patients with type 2 diabetes. J Magn Reson Imaging, 2016, 43(5): 1090-1099.Figures
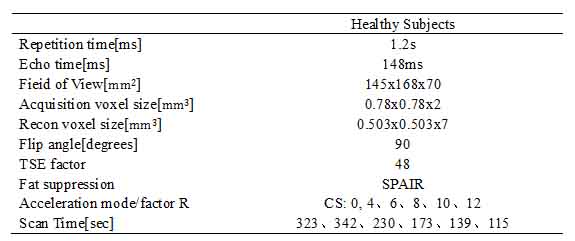
Table1 MR Parameters of 3D VIEW PD Sequences of knee imaging
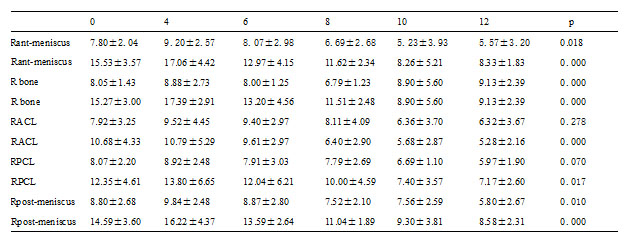
Table 2
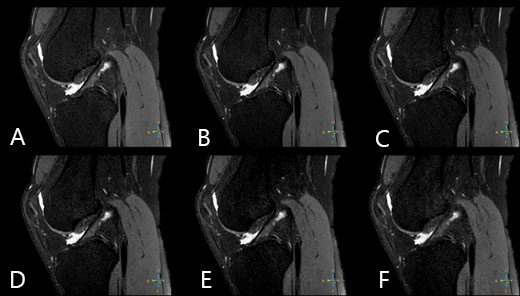
Figure 1. 3D-HR-PD imaging of the knee joint for a 25 year old healthy volunteer: a. CS0; b. CS4; c. CS6; d. CS8; e. CS10; f. CS12. Visualization of anterior cruciate ligament (ACL) was significantly worse
at CS=10 and 12.
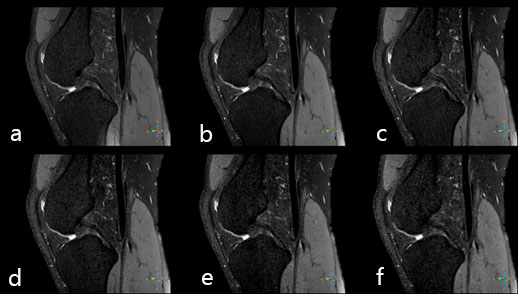
Figure 2. a.CS 0 3D 3D VIEW PD. b. CS 4 3D 3D VIEW PD. c. CS 6 3D 3D VIEW PD. d. CS 8 3D 3D VIEW PD. e. CS 10 3D 3D VIEW PD. f. CS 0 3D 3D VIEW PD 25 year old healthy volunteer, the posterior cruciate ligament was significantly
worse at CS=10 and 12.
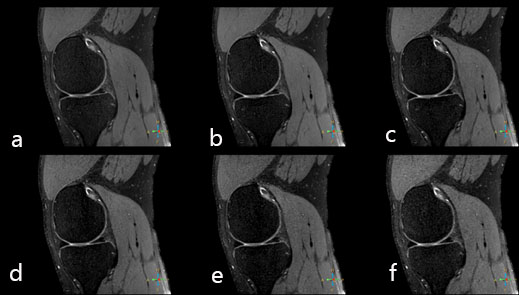
Figure 3. a.CS 0
3D 3D VIEW PD. b. CS 4 3D 3D VIEW PD. c. CS 6 3D 3D VIEW PD. d. CS 8 3D 3D VIEW PD. e. CS 10 3D 3D VIEW PD. f. CS 0 3D 3D VIEW PD 25 year old healthy volunteer, anterior and
posterior angles of the meniscus was significantly worse at CS=10 and 12.