4080
A Comparison of Synovitis Severity in the Knee Assessed Using Contrast-Enhanced MRI and FDG-PET1Department of Radiology, Stanford University, Stanford, CA, United States, 2Department of Radiology, University of Cambridge, Cambridge, United Kingdom, 3Norwich Medical School, University of East Anglia, Norwich, United Kingdom, 4Department of Radiology, Norfolk and Norwich University Hospital, Norwich, United Kingdom
Synopsis
T1-weighted contrast-enhanced MRI (CE-MRI) is used to evaluate synovitis, but fluctuations in severity of synovial inflammation may be slow to manifest as volumetric changes seen on CE-MRI. We compared metabolic activity using FDG-PET to CE-MRI synovitis gradings, MOAKS effusion- and Hoffa-synovitis gradings, and the transfer constant Ktrans in the overall synovial region and four subregions. Moderate to very strong correlation was seen between maximum FDG uptake (SUVmax) and corresponding synovitis grades, MOAKS effusion synovitis, and corresponding regional median Ktrans both within the entire synovium and in four synovial subregions, with the exception of median Ktrans at one subregion.
Introduction
Synovitis, or inflammation of the synovial membrane lining the joint space, is an important component of osteoarthritis (OA) and is thought to play a key role in disease progression1. Synovitis can be evaluated using MRI, typically following the intravenous injection of a gadolinium-based contrast agent, and is generally characterized by thickening of the synovial membrane. However, this semi-quantitative analysis of morphologic changes may poorly reflect actual inflammatory activity at a tissue level. The transfer constant Ktrans measures the rate of gadolinium uptake and offers a quantitative assessment of synovitis severity, but requires dynamic imaging and custom post-processing and analysis2. Synovial inflammation may also be examined using positron emission tomography (PET), a molecular imaging modality that uses radiotracers to track uptake and localization of target molecules. PET imaging with the 18F-Fluorodeoxyglucose (FDG) radiotracer, a glucose analog, can assess increased glucose uptake utilization by activated inflammatory cells and is thus widely utilized as a reference standard of early inflammatory activity. This study aims to evaluate several contrast-enhanced MRI methods of assessing synovitis and its severity including regional semi-quantitative assessment, MRI Osteoarthritis Knee Score (MOAKS) scoring, and median Ktrans values, using FDG-PET as a reference standard.Methods
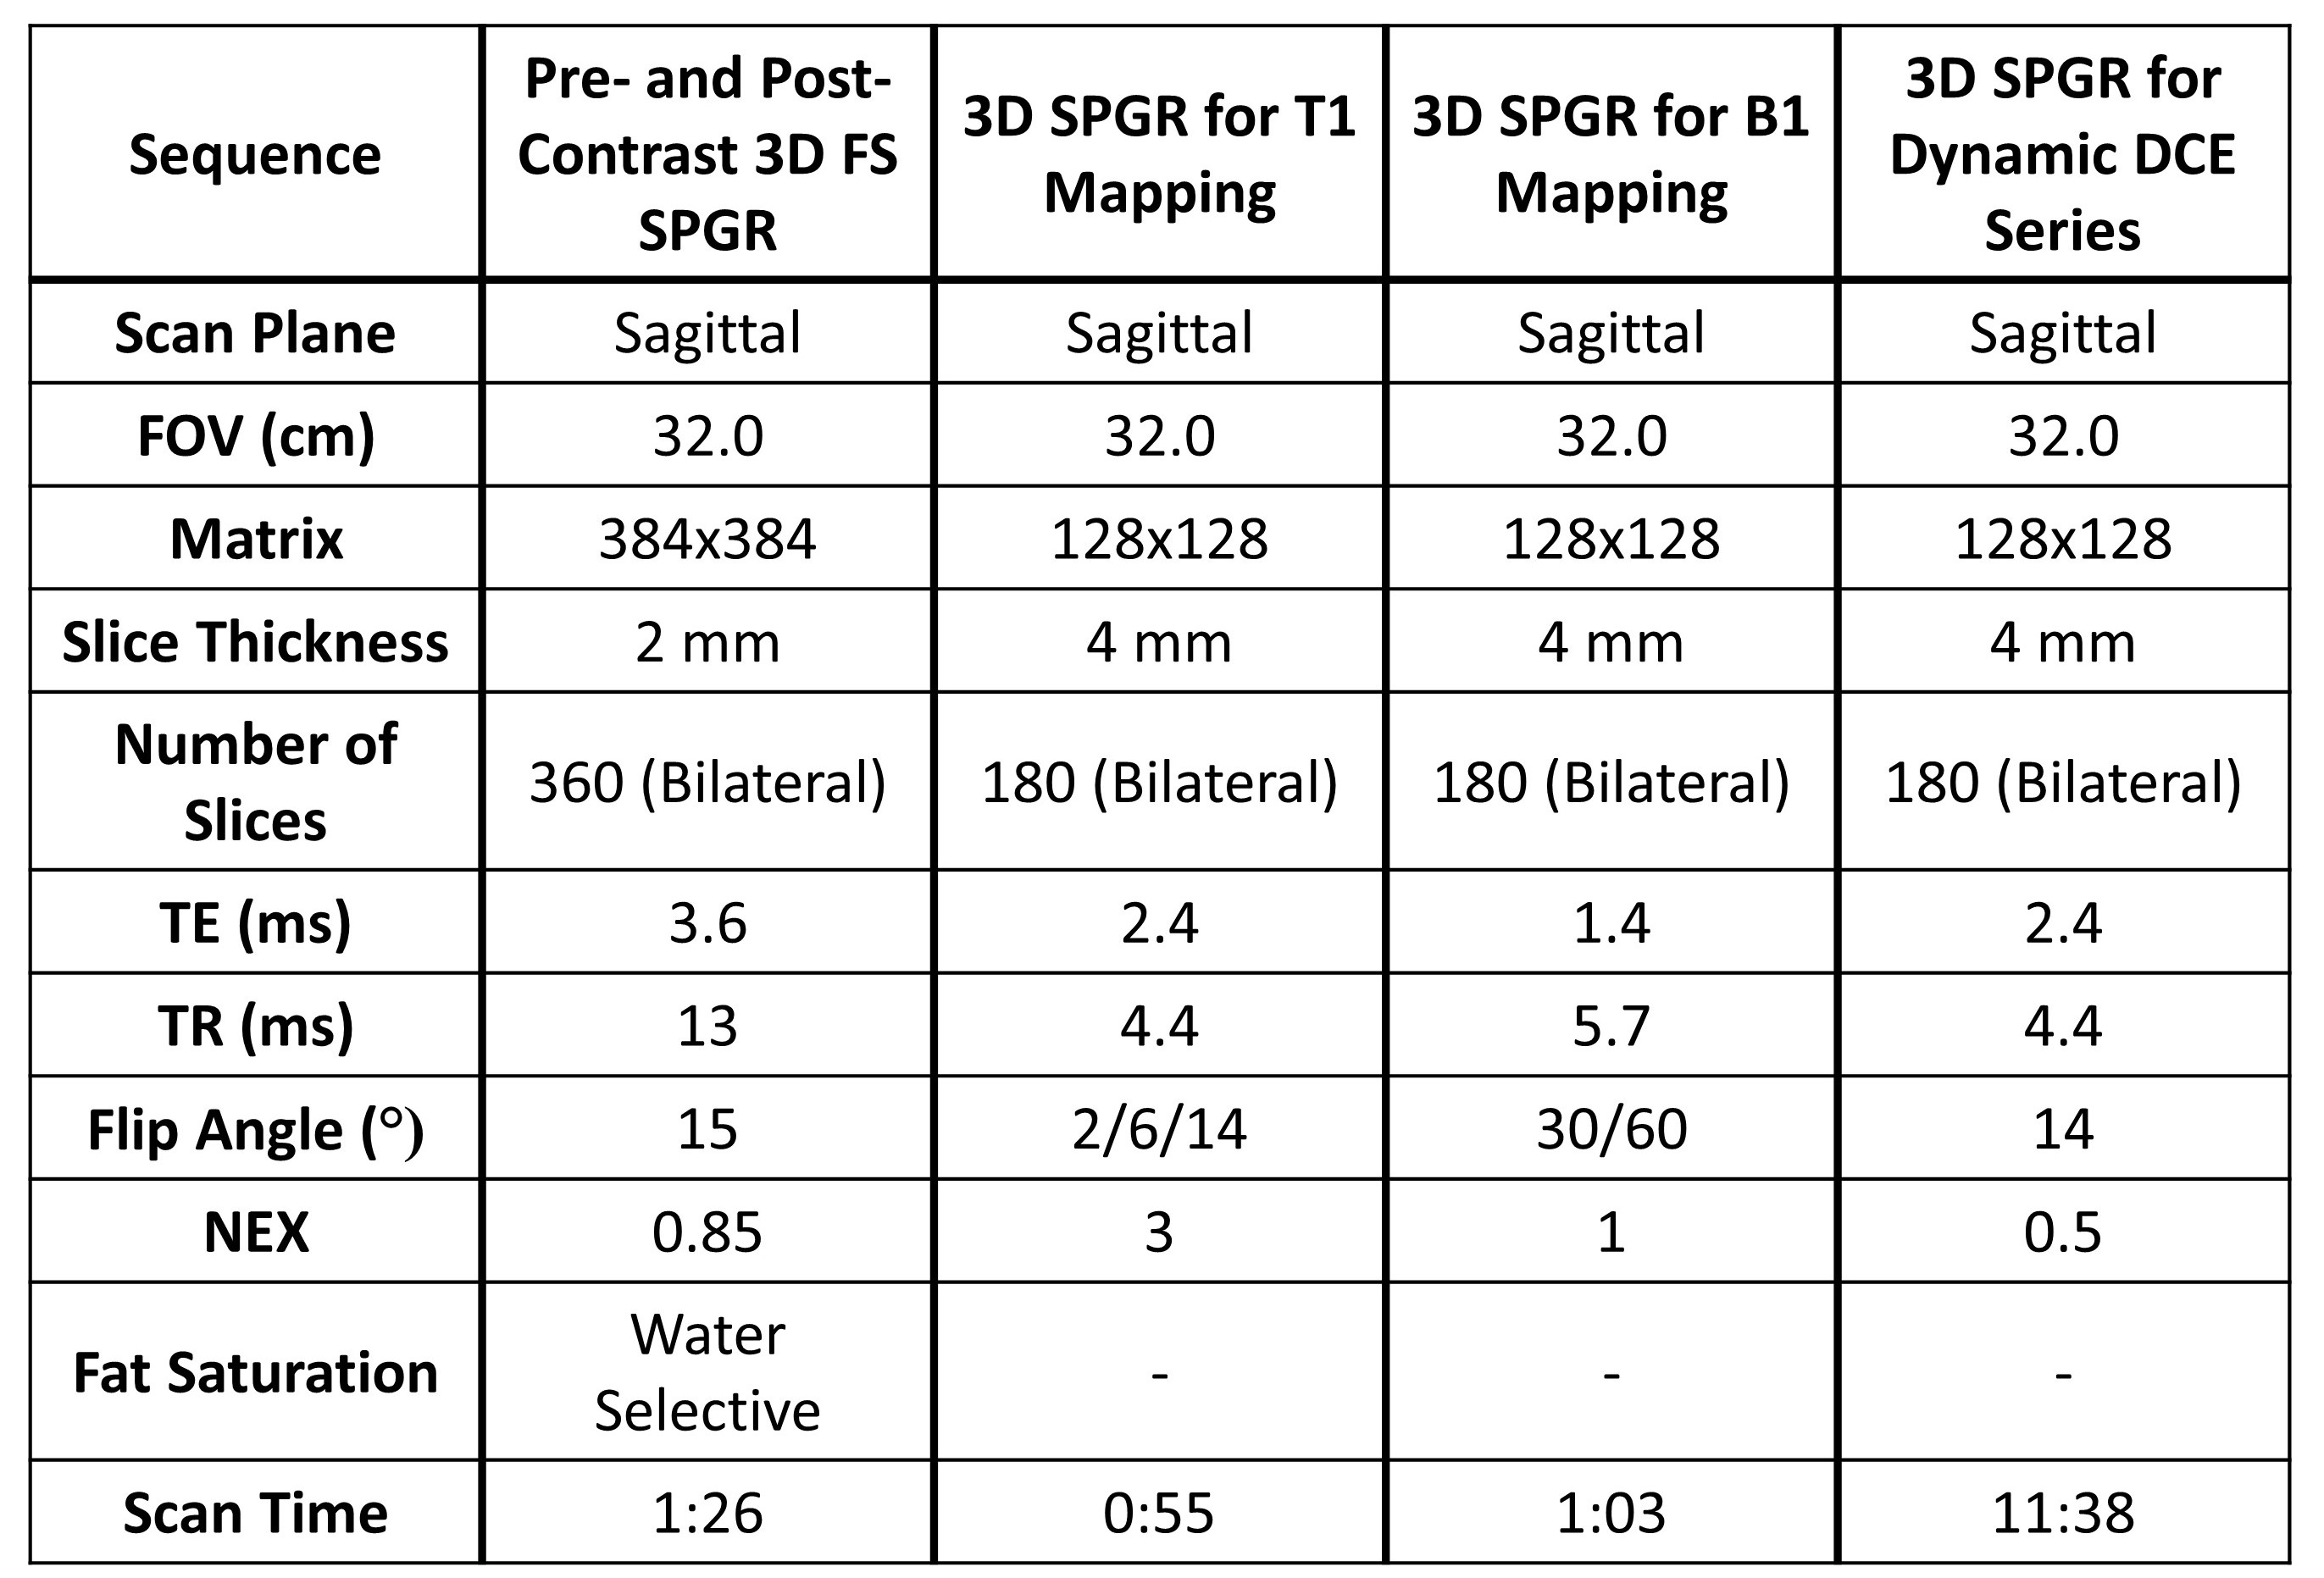
Both knees of five subjects were scanned using a 3.0 T hybrid PET/MR scanner (GE Healthcare). 3D pre- and post-contrast SPGR fat-saturated (FS) T1-weighted sequence (CE-MRI) were acquired for grading of synovitis. Additionally, a 3D T1-weighted dynamic contrast-enhanced sequence with 65 phases, a 3D SPGR B1 mapping sequence, and a 3D SPGR T1 mapping sequence were acquired for calculation of Ktrans (Protocol in Table 1). Details of these scans can be found in Table 1. PET imaging was performed simultaneously following injection of 4 mCi of the FDG radiotracer.Standardized uptake value (SUV) images of FDG tissue activity normalized to patient weight and injected dose were created in Horos (Nimble Co.). To create Ktrans maps, B1 maps were first created using the double angle method3 and T1 maps were created using a B1 map correction. These B1 and T1 maps were then used to create Ktrans maps using the extended Tofts model4 and Parker's population arterial input function5. The entire synovial region and four subregions - the suprapatellar pouch, posterior surface of Hoffa’s fat pad, and medial and lateral parapatellar recesses – were manually segmented using the CE-MRI images. Segmentations were refined using a shuffle transform and subtraction of the pre and post-contrast SPGR images6 in MATLAB (Mathworks, Inc). These segmentations, along with Ktrans and SUV images, were uploaded into 3D Slicer7, and Ktrans and SUV values were extracted for each region.
Four radiologists graded synovitis in each region on a four-point scale from 0-3, where 0 indicated no synovitis and 3 indicated severe synovitis. One radiologist also graded effusion-synovitis and Hoffa-synovitis on a four-point scale according to the MOAKS semi-quantitative scoring tool8.
Maximum SUV values (SUVmax) for each region were compared to regional median Ktrans, the mean corresponding regional synovitis grade, and MOAKS effusion- and Hoffa-synovitis grades using Spearman's correlation coefficients (ρ, α < 0.05). Correlation coefficients of < 0.20 were considered poor correlation, 0.21-0.40 were considered low, 0.41-0.70 were considered moderate, 0.71-0.90 were considered strong, and 0.91-1.00 were considered very strong9.
Results
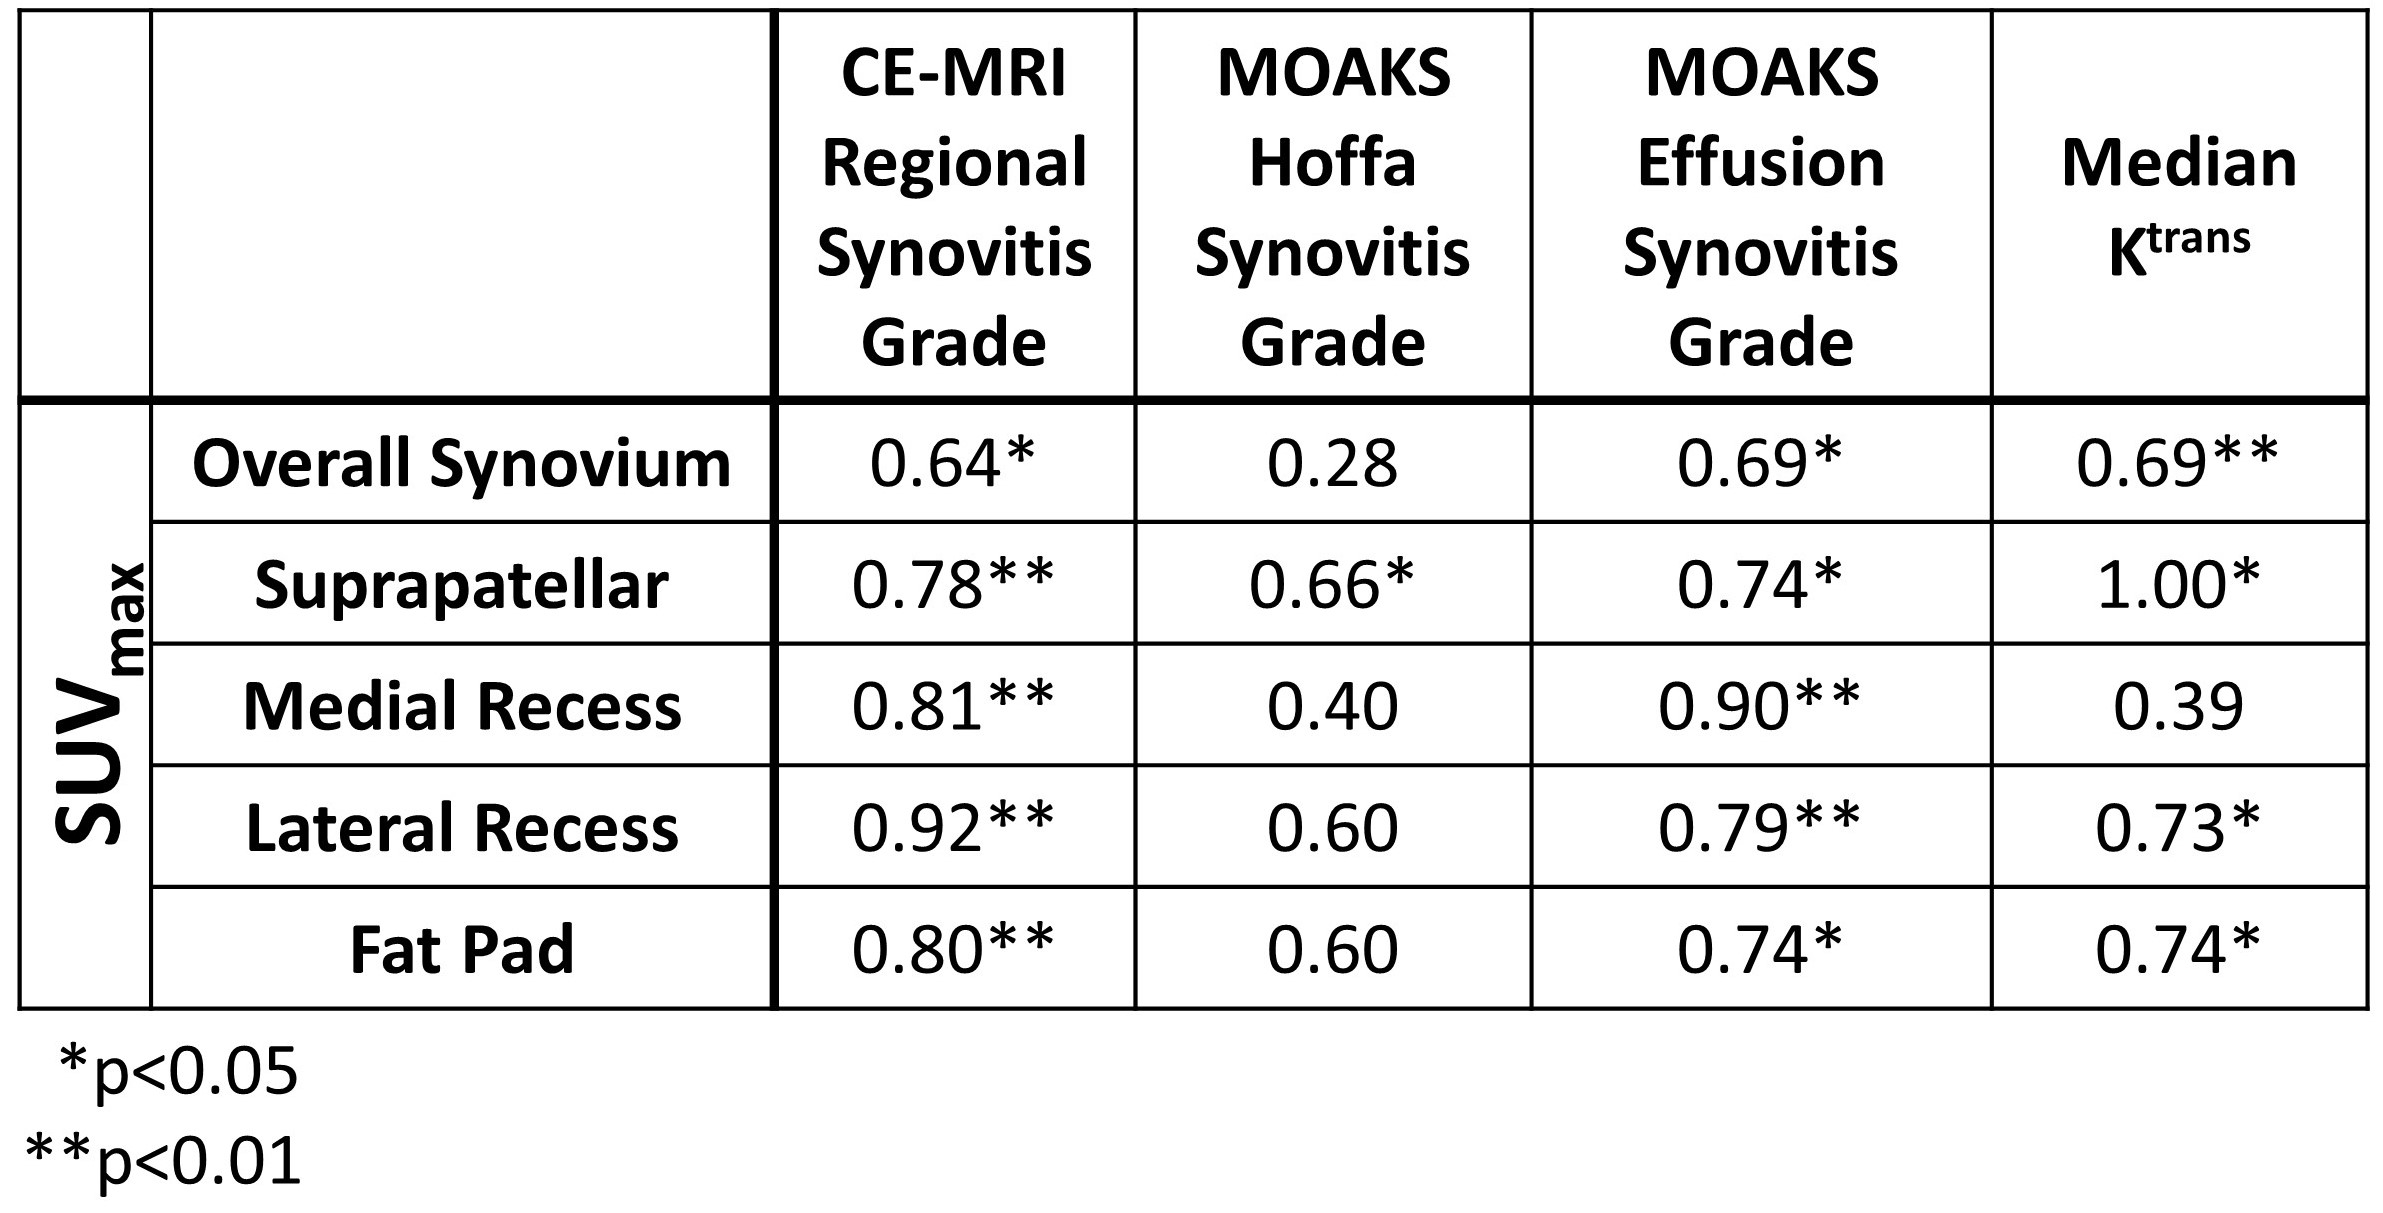
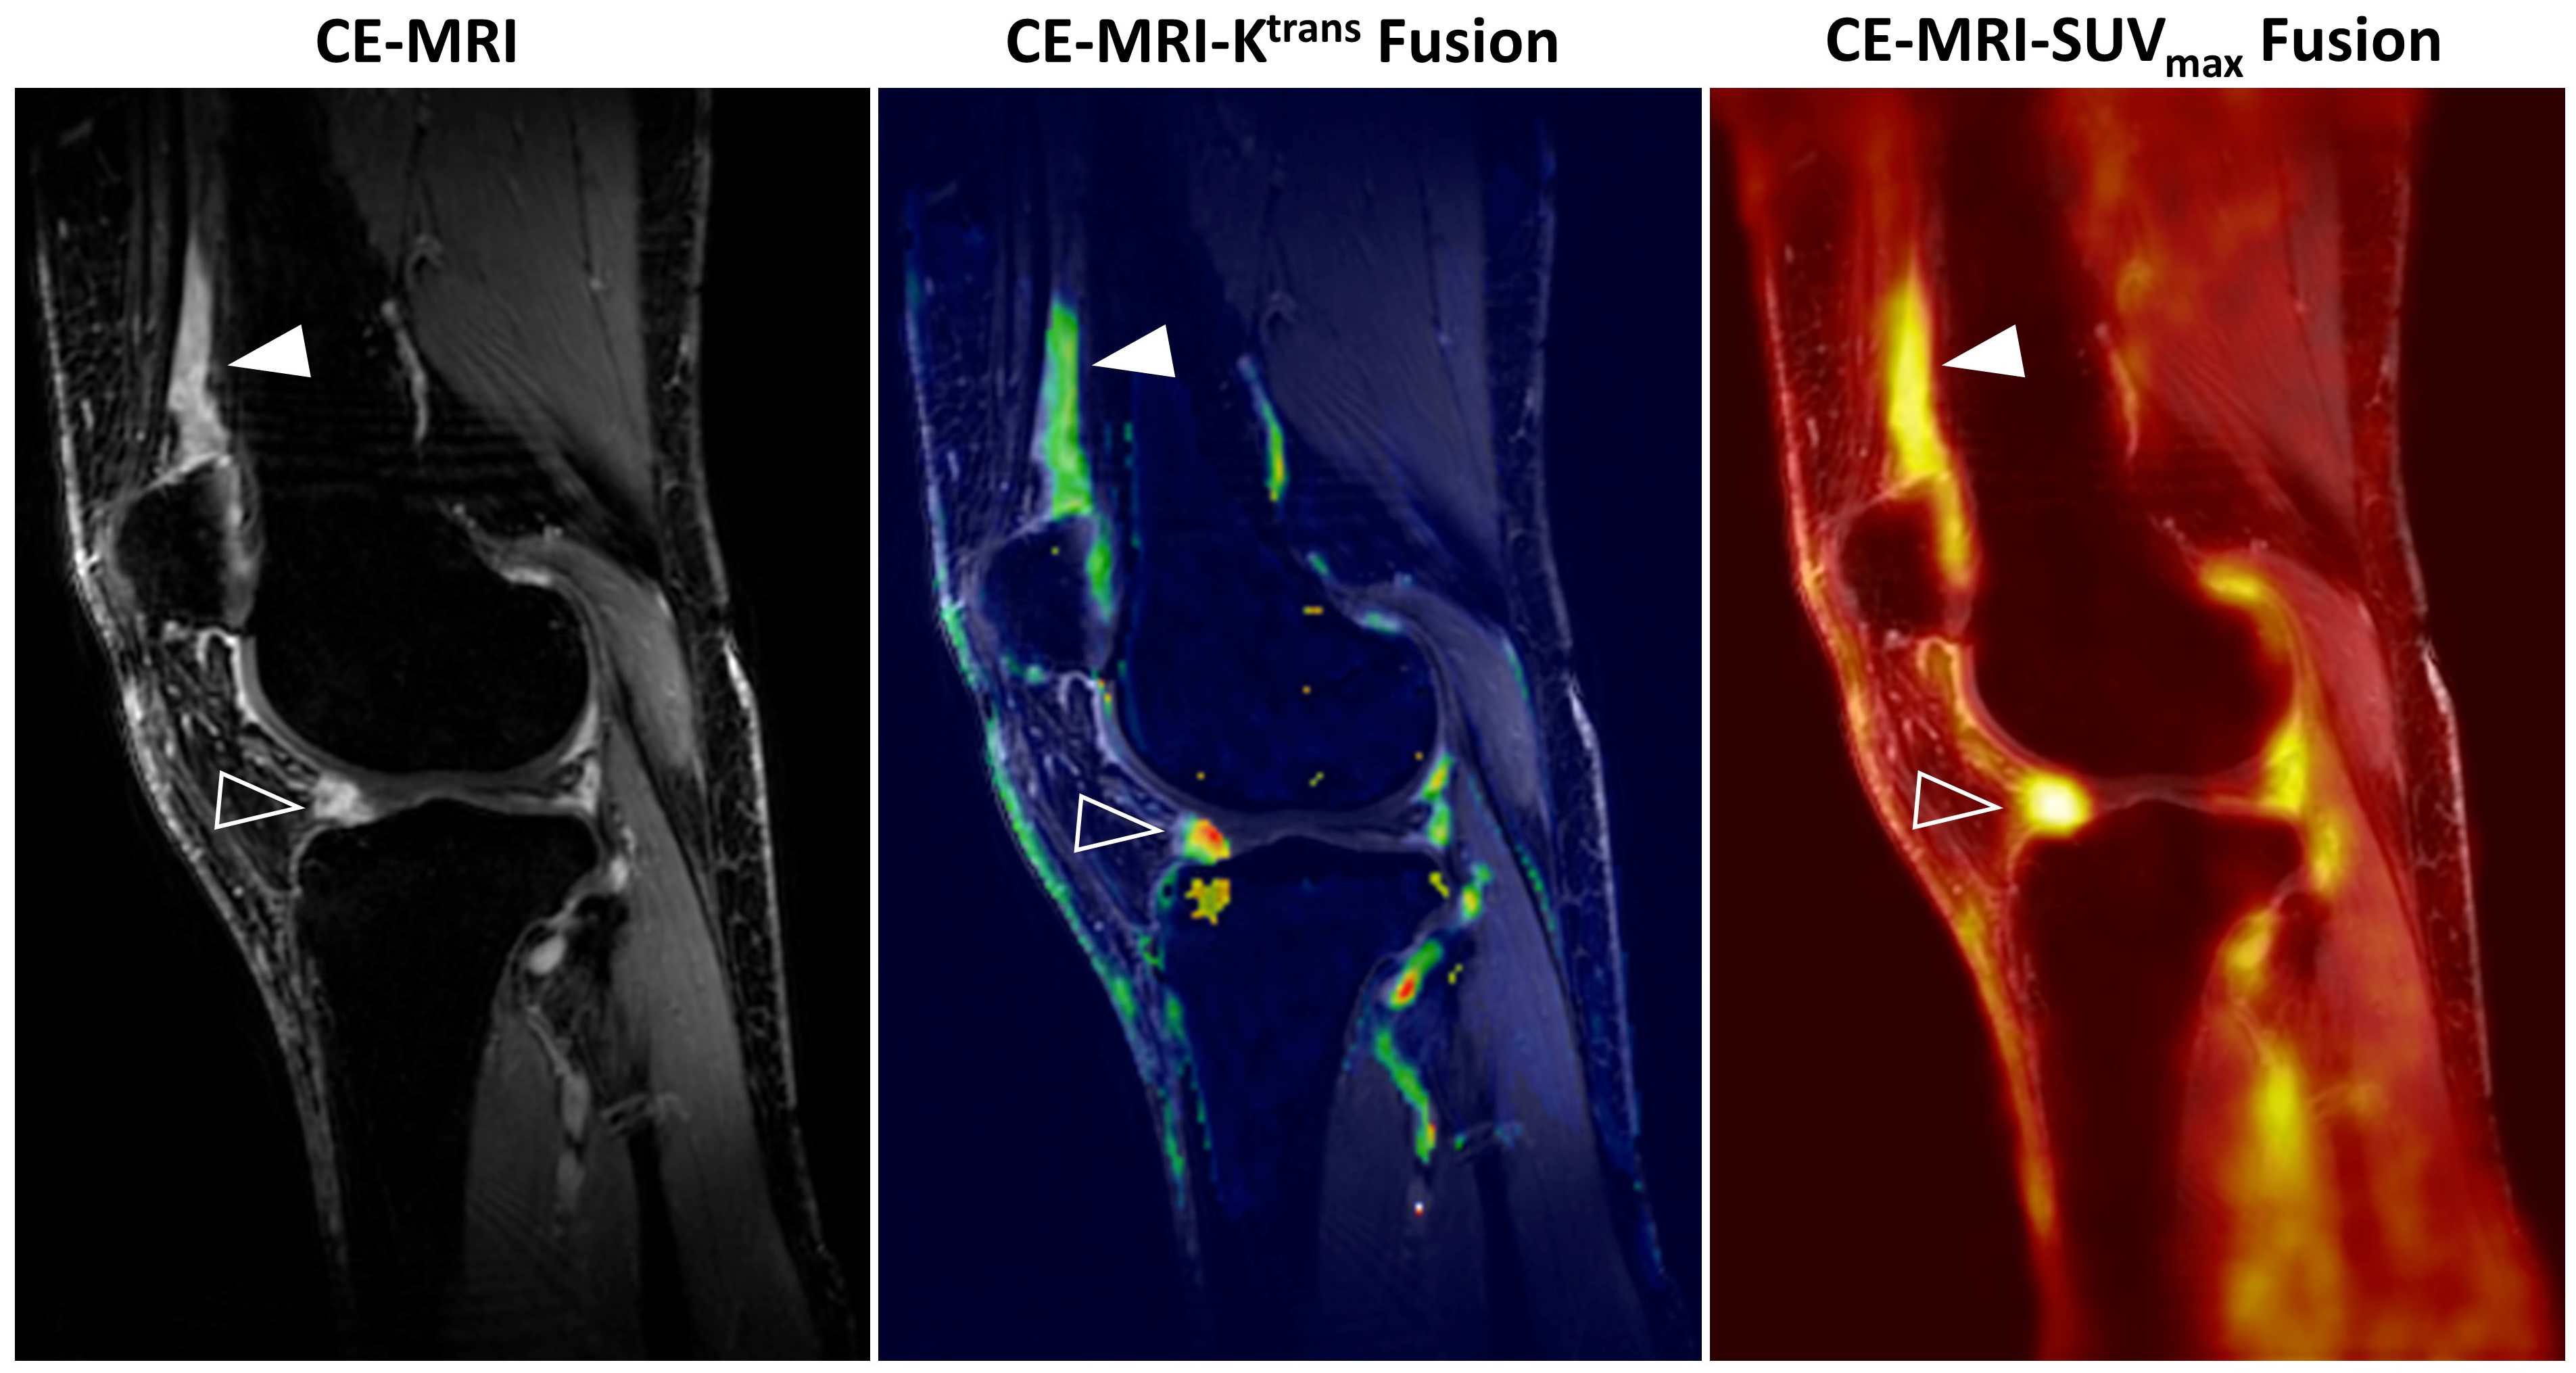
A strong to very strong correlation was seen between SUVmax and the mean regional synovitis score from CE-MRI grades for all four subregions (ρ=0.78-0.92, α < 0.01) (Table 2). There was also a moderate correlation between the overall synovium SUVmax and the mean synovitis grade for the overall knee (ρ=0.64, α < 0.05). A strong correlation was seen between SUVmax for each subregion and MOAKS effusion-synovitis grades for each subregion (ρ= 0.74-0.90, α < 0.05), and a moderate correlation over the entire synovium (ρ=0.69, α < 0.05). Correlation was lower for MOAKS Hoffa synovitis grades, with nonsignificant poor to moderate correlation seen for the overall synovium (ρ=0.28, α > 0.05) and all subregions (ρ=0.40-0.60, α > 0.05) with the exception of the suprapatellar pouch, which showed moderate correlation (ρ=0.66, α < 0.05). When SUVmax was compared to Ktrans, very strong correlation was seen for the suprapatellar region (ρ=1.00, α < 0.05), strong correlation was seen for the lateral recess and fat pad (ρ=0.73 and 0.74 respectively, α < 0.05), and moderate correlation was seen for the overall knee (ρ=0.69, α < 0.01). The medial recess showed non-significant, low correlation (ρ=0.39, α > 0.05). Example CE-MRI, Ktrans, and SUVmax images are shown in Figure 1.Discussion
This study has shown a moderate to very strong correlation between synovial SUVmax and corresponding synovitis grades, MOAKS effusion synovitis, and corresponding regional median Ktrans both within the entire synovium and in four synovial subregions, with the exception of median Ktrans at the medial recess. While there have been concerns that volumetric changes in the synovium may be less specific to the severity of inflammation, this preliminary study has shown a strong correlation between metabolic uptake and degree of synovial thickening seen using MRI for each subregion, indicating that synovial volume likely tracks closely as a measure of severity of synovial inflammation. Further work with a larger sample size is necessary to confirm these observations.Acknowledgements
This work was funded by grant support from GE Healthcare and NIH grants R01-EB002524-14, R01 AR0063643, R01AR077604, R24-AR062068, R00 EB022634References
1. Local Treatment of Inflammatory Joint Diseases: Benefits and Risks. Springer Berlin Heidelberg; 2015.
2. Tofts, P. S. Modeling tracer kinetics in dynamic Gd-DTPA MR imaging. J. Magn. Reson. Imaging JMRI 7, 91–101 (1997)
3. Cunningham CH, Pauly JM, Nayak KS. Saturated double-angle method for rapid B1+ mapping. Magnetic Resonance in Medicine. 2006;55(6):1326-1333. doi:10.1002/mrm.20896
4. Tofts PS. Modeling tracer kinetics in dynamic Gd-DTPA MR imaging. J Magn Reson Imaging. 1997;7(1):91-101. doi:10.1002/jmri.1880070113
5. Parker GJM, Roberts C, Macdonald A, et al. Experimentally-derived functional form for a population-averaged high-temporal-resolution arterial input function for dynamic contrast-enhanced MRI. Magn Reson Med. 2006;56(5):993-1000. doi:10.1002/mrm.21066
6. Xanthopoulos E, Hutchinson CE, Adams JE, et al. Improved wrist pannus volume measurement from contrast-enhanced MRI in rheumatoid arthritis using shuffle transform. Magn Reson Imaging. 2007;25(1):110-116. doi:10.1016/j.mri.2006.10.018
7. Fedorov A, Beichel R, Kalpathy-Cramer J, et al. 3D Slicer as an Image Computing Platform for the Quantitative Imaging Network. Magn Reson Imaging. 2012;30(9):1323-1341. doi:10.1016/j.mri.2012.05.001
8. Hunter DJ, Guermazi A, Lo GH, Grainger AJ, Conaghan PG, Boudreau RM, Roemer FW. Evolution of semi-quantitative whole joint assessment of knee OA: MOAKS (MRI Osteoarthritis Knee Score). (2011) Osteoarthritis and cartilage. 19 (8): 990-1002. doi:10.1016/j.joca.2011.05.004
9. Guilford JP. Fundamental Statistics in Psychology and Education. 5th edition. McGraw-Hill; 1973.
Figures