4079
Evaluation of Synovitis of Hand in Patients with Rheumatoid Arthritis Using Diffusion Kurtosis Imaging: Initial Findings1Departments of Radiology, Nanjing Drum Tower Hospital Clinical College of Nanjing Medical University, Nanjing, China
Synopsis
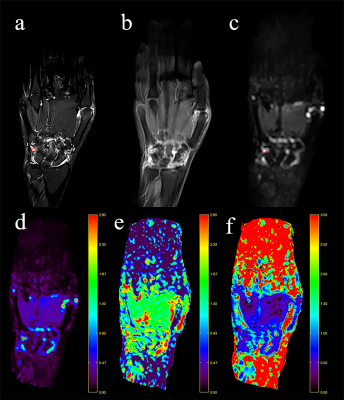
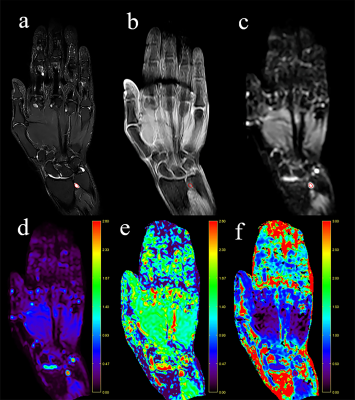
Thirty patients with RA and 10 patients suspected of RA were enrolled to explore the application value of DKI in the noninvasive identification of synovitis in hand arthritis. The suspected synovitis or joint effusion was scored on a scale of 0 (joint effusion) to 3 (mild, moderate, severe synovitis), referring to RAMRIS (RA-MRI-Scoring) system. ADC, D, and K from DKI were recorded and compared. There were significant differences in ADC, D, and K values among different enhancing degree scores. The diagnostic performance provided by the D values is similar to the ADC value and higher than the K value.
INTRODUCTION
Proliferative synovitis is the core of pathophysiology of rheumatoid arthritis (RA), and is considered to be the best predictive marker of joint damage. Since irreversible joint destruction occurs more often in late stage, the detection and evaluation of synovitis is essential for early diagnosis, making therapeutic decisions, assessing response to treatment, and improving the long-term prognosis. However, conventional MRI cannot distinguish between synovitis and effusion. At present, diffusion kurtosis imaging (DKI), as an advanced DWI model, can quantify the non-Gaussian behavior of water molecular diffusion, and may be superior to DWI for better characterizing the complex microstructures of tissues. Thus, the purpose of this study is to characterize the DKI features of synovitis and joint effusion in the hands of RA patients and to explore the application value of DKI parameters in the diagnosis and grading of synovitis.METHODS
Thirty patients with RA and 10 patients suspected of RA were enrolled. 3.0T MRI including the DKI (b = 0, 500, 1000, 1500, 2000 s/mm2) and contrast-enhanced MRI were performed. A total of 210 regions of interest (ROIs) were identified and DKI parameters were generated. The suspected synovitis or joint effusion was scored on a scale of 0 to 3 in each joint, referring to modified RAMRIS (RA-MRI-Scoring) system.1 Score 0 is no enhanced (joint effusion), and 1–3 (mild, moderate, severe) are by thirds of the presumed maximum volume of enhancing tissue in the synovial compartment. Differences in DKI parameters among different scores were tested by one-way analysis of variance (Bonferroni test for pairwise comparison). The difference of DKI parameters were tested between the patients with RA in score 0 and score (1+2+3) by using an independent two-sample t-test. The Spearman correlation was used to evaluate the association of DKI parameters with contrast enhancement degrees. The diagnostic performance of DKI parameters for distinguishing different contrast enhancement degrees was analyzed with receiver operating characteristic (ROC) curve and the area under the ROC curve (AUC).RESULTS
Contrast enhancement degrees were negatively correlated with the ADC and D values significantly (r= –0.725, –0.757, respectively, all P< 0.001), but positively correlated with the K values significantly (r=0.429, P<0.001). There were significant differences in ADC, D, and K values among different enhancing degree scores (all P< 0.001). ADC values differed significantly between different scores (0 vs. 1, 0 vs. 2, 0 vs. 3, 1 vs. 3, 2 vs. 3, and 0 vs. 1-3, all P<0.05) expect scores 1 vs. 2 (P=0.174). D values showed significant difference in all scores (0 vs. 1, 0 vs. 2, 0 vs. 3, 1 vs. 2, 1 vs. 3, 2 vs. 3, and 0 vs. 1-3, all P<0.05). K values differed significantly between different scores (0 vs. 1, 0 vs. 2, 0 vs. 3, and 0 vs. 1-3, all P<0.05), whereas no significant differences of K value were observed between different scores 1 vs. 2, scores 1 vs. 3 and scores 2 vs. 3, all P > 0.05. D and ADC have similar AUC, and both are higher than K for differentiating synovitis. No significant differences was found between the ADC and D values. The AUC values of D, ADC, and K values were 0.884, 0.874, and 0.728 for score (1+2+3) from score 0, respectively.DISCUSSION
This study demonstrates that DKI parameters differed significantly between different scores. ADC, D, and K values correlated significantly with the degree of synovial enhancement. This may be explained by the infiltration of inflammatory cells hindering the mobility of molecular water.2 This finding agrees with prior reports in which the D and ADC values of IVIM,3,4 and ADC values of DWI5,6 could be used to differentiate synovitis from joint effusion, and showed similar correlation. Our findings indicate that DKI parameters showed good diagnostic performance for differentiating synovitis from joint effusion. The AUC of ADC and D values were similar, and both were higher than the AUC of K values. However, there was no statistically significant difference between D values and ADC values. Although some previous studies have shown that DKI may be superior to standard DWI in tumor diagnosis and prognostic evaluation. No additional increased value of DKI in comparison with conventional DWI has been found by Ding et al7 in renal tumors, Roethke et al8 and Tamura et al9 in prostate cancer, Li et al10 in ovarian tumors, and Yang L et al11 in liver fibrosis. Fujimori et al.3 found that the D and ADC values of IVIM were significantly different in the diagnosis of synovitis, but D offered slightly beneficial diagnostic performance to ADC values. Fujimori et al.3 reported that small areas such as in the hands may affect magnetic field inhomogeneity and geometric distortion. Our results were in accordance with those studies.CONCLUSION
DKI may be feasible as a noninvasive and contrast-free method for differentiating synovitis from joint effusion in the hands of RA patients, while D and ADC values have similar performance.Acknowledgements
No acknowledgement found.References
1.Ostergaard M, Edmonds J, McQueen F, et al. An introduction to the EULAR-OMERACT rheumatoid arthritis MRI reference image atlas. Ann Rheum Dis 2005;64 Suppl 1:i3-7.
2.Qu J, Lei X, Zhan Y, et al. Assessing Synovitis and Bone Erosion With Apparent Diffusion Coefficient in Early Stage of Rheumatoid Arthritis. J Comput Assist Tomogr 2017;41(5):833-838.
3.Fujimori M, Murakami K, Sugimori H, et al. Intravoxel incoherent motion MRI for discrimination of synovial proliferation in the hand arthritis: A prospective proof-of-concept study. J Magn Reson Imaging 2019;50(4):1199-1206.
4.Hilbert F, Holl-Wieden A, Sauer A, et al. Intravoxel incoherent motion magnetic resonance imaging of the knee joint in children with juvenile idiopathic arthritis. Pediatr Radiol 2017;47(6):681-690.
5.Sauer A, Li M, Holl-Wieden A, et al. Readout-segmented multi-shot diffusion-weighted MRI of the knee joint in patients with juvenile idiopathic arthritis. Pediatr Rheumatol Online J 2017;15(1):73.
6.Li M, Sauer A, Holl-Wieden A, et al. Diagnostic value of diffusion-weighted MRI for imaging synovitis in pediatric patients with inflammatory conditions of the knee joint. World J Pediatr 2020;16(1):60-67.
7.Ding Y, Tan Q, Mao W, et al. Differentiating between malignant and benign renal tumors: do IVIM and diffusion kurtosis imaging perform better than DWI? Eur Radiol 2019;29(12):6930-6939.
8.Roethke MC, Kuder TA, Kuru TH, et al. Evaluation of Diffusion Kurtosis Imaging Versus Standard Diffusion Imaging for Detection and Grading of Peripheral Zone Prostate Cancer. Invest Radiol 2015;50(8):483-489.
9.Tamura C, Shinmoto H, Soga S, et al. Diffusion kurtosis imaging study of prostate cancer: preliminary findings. J Magn Reson Imaging 2014;40(3):723-729.
10.Li HM, Zhao SH, Qiang JW, et al. Diffusion kurtosis imaging for differentiating borderline from malignant epithelial ovarian tumors: A correlation with Ki-67 expression. J Magn Reson Imaging 2017;46(5):1499-1506.
11.Yang L, Rao S, Wang W, et al. Staging liver fibrosis with DWI: is there an added value for diffusion kurtosis imaging? Eur Radiol 2018;28(7):3041-3049.
Figures


