4078
MRI-based radiomic features and machine learning for differentiating myelodysplastic syndrome and aplastic anemia1Department of Diagnostic Radiology, Hiroshima University Hospital, Hiroshima, Japan, 2Department of Radiology, International Medical Center, Saitama Medical University, Saitama, Japan, 3Department of Radiology, Nagoya University Hospital, Aichi, Japan, Nagoya, Japan
Synopsis
We assessed the feasibility of a method of radiomic analysis based on machine learning (ML) and lumbar MRI to differentiate between MDS and aplastic anemia (AA). Regions of interest were drawn in the L3 vertebral body on the mid-sagittal images of sagittal T1-weighted and STIR images of patients with MDS (n=62) or AA (n=78) from six institutions. The model of ML with logistic regression resulted in the best performance for differentiating MDS from AA when using T1-weighted images. The model was not predictive for STIR or concatenated images. The radiomics-based ML model enabled the differentiation of MDS and AA.
Introduction
Aplastic anemia (AA) is characterized by hypoplastic bone marrow (BM) and results in varying degrees of pancytopenia.1 Hematopoietic stem cell transplantation (HSCT) yields a 75%-80% possibility of long-term cure.2 Myelodysplastic syndrome (MDS) is includes a heterogeneous group of neoplasms in which clonal myeloid expansion in the BM results in BM failure and increased risk of leukemic evolution.3 Despite advances in treatment strategies, HSCT is the only potentially curative therapy for MDS. Although the etiologies of MDS and AA are distinct, it can be difficult to distinguish MDS from AA because of the similarity of clinical features in patients with these diseases.Advanced radiological imaging analysis using quantitative features extracted from MRI together with machine learning has recently offered models capable of predicting bone lesions.4 The aim of this study was to assess the feasibility of radiomics analysis based on a machine learning method using lumbar T1-weighted and STIR images to differentiate differentiation between AA and MDS.
Methods
This retrospective, multi-institution study was approved by the Institutional Review Board of Hiroshima University Hospital and five centers.Patients with MDS (n = 62) or AA (n = 78) underwent MRI performed using the spine protocols used at each institution, which included 2D sagittal T1-weighted spin-echo and 2D sagittal STIR sequences using either a 3-T system (n = 120) or a 1.5-T system (n = 20). Images acquired with these two sequences were concatenated with Image J software. Regions of interest (ROIs) for the BM space of the L3 vertebral body were drawn using a semiautomatic segmentation method by a radiologist with 25 years' experience in spinal imaging. The ROIs were drawn manually on the mid-sagittal images.
Two validation strategies were established to evaluate the predictive performance of radiomic features (Figure 1). To determine the overall accuracy of the predictive models, we created a single dataset comprising all six patient cohorts. We then tested the model on data from the latest two or three patients from each institution (Scheme 1). To examine the predictive value of the model across different hospitals, we trained the model using the combined dataset from five hospitals, and then tested the model on data from the sixth independent hospital (Scheme 2).
A total of 851 texture features were extracted from the T1-weighted, STIR, and concatenated images using an extension module for 3D Slicer. Mean decrease in Gini was used to reduce overfitting in the model and highly correlated features were removed using the Pearson correlation coefficient. Finally, the 30 most important features for establishing the radiomics model were determined.
For the data classification and model building, a graphical user-interface-based software (Orange Data Mining) was used. We compared the effectiveness of four machine learning approaches: a logistic regression classification algorithm with least absolute shrinkage and selection of operator (L1) or ridge (L2) regularization, a random forest classifier (RF), a support vector machine (SVM), and a multi-layer perceptron (MLP) algorithm (100 hidden layers, Adam solver, learning rate of 0.0001, ReLu activation function). The validation fraction was 10% of the training data. Measures of accuracy, sensitivity, specificity, and area under the curve (AUC) were estimated.
Results
Figure 2 summarizes the sensitivity, specificity, accuracy, and AUCs for differentiation between MDS and AA using Schemes 1 and 2 with T1-weighted image datasets.Scheme 1 showed that logistic regression (RF) resulted in the best performance and ROC analysis revealed superior performance of this model for differentiating the two entities when using data from T1-weighted images (AUC, 0.92) (Figure 3). In contrast, the model was not predictive for STIR or the concatenated images (AUC 0.56 and 0.71, respectively).
Figure 4 shows the diagnostic performance of the radiomic features derived using T1-weighed, STIR, and concatenated images to distinguish between MDS and AA. Box-whisker plots for the best three radiomic features are presented. The radiomic features for T1-weighted images had better predictive value among the three imaging datasets, with an AUC of 0.917 for wavelet-LLLfirstorder10Percentile, 0.864 for wavelet-HLLfirstorderMean, and 0.720 for wavelet-LLLfirstorderMaximum.
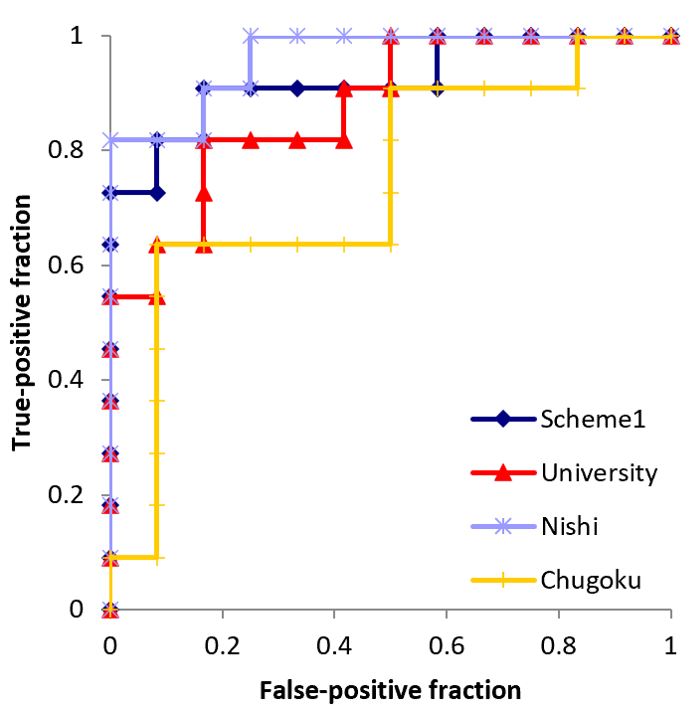
Although the mean AUC for differentiating MDS from AA was good using T1-weighted images (Figure 2, 0.837-0.924), Scheme 2 reveals institutional differences in performance (Figure 5, University, 0.879; Nishi, 0.962; Chugoku, 0.742).
Acknowledgements
No acknowledgement found.References
- Luzzatto L, Risitano AM. Advances in understanding the pathogenesis of acquired aplastic anaemia. Br J Haematol. 2018;182(6):758–777.
- Zhu Y, Gao Q, Hu J, et al. Allo-HSCT Compared with Immunosuppressive therapy for acquired aplastic anemia: A system review and meta-analysis. BMC Immunol. 2020;21(1):10.
- Maynadi´e M, Verret C, Moskovtchenko P, et al. Epidemiological characteristics of myelodysplastic syndrome in a well-defined French population. Br J Cancer. 1996;74(2):288-290.
- Lang N, Zhang Y, Zhang E, et al. Differentiation of spinal metastases originated from lung and other cancers using radiomics and deep learning based on DCE-MRI. Magn Reson Imaging. 2019;64:4-12.
Figures
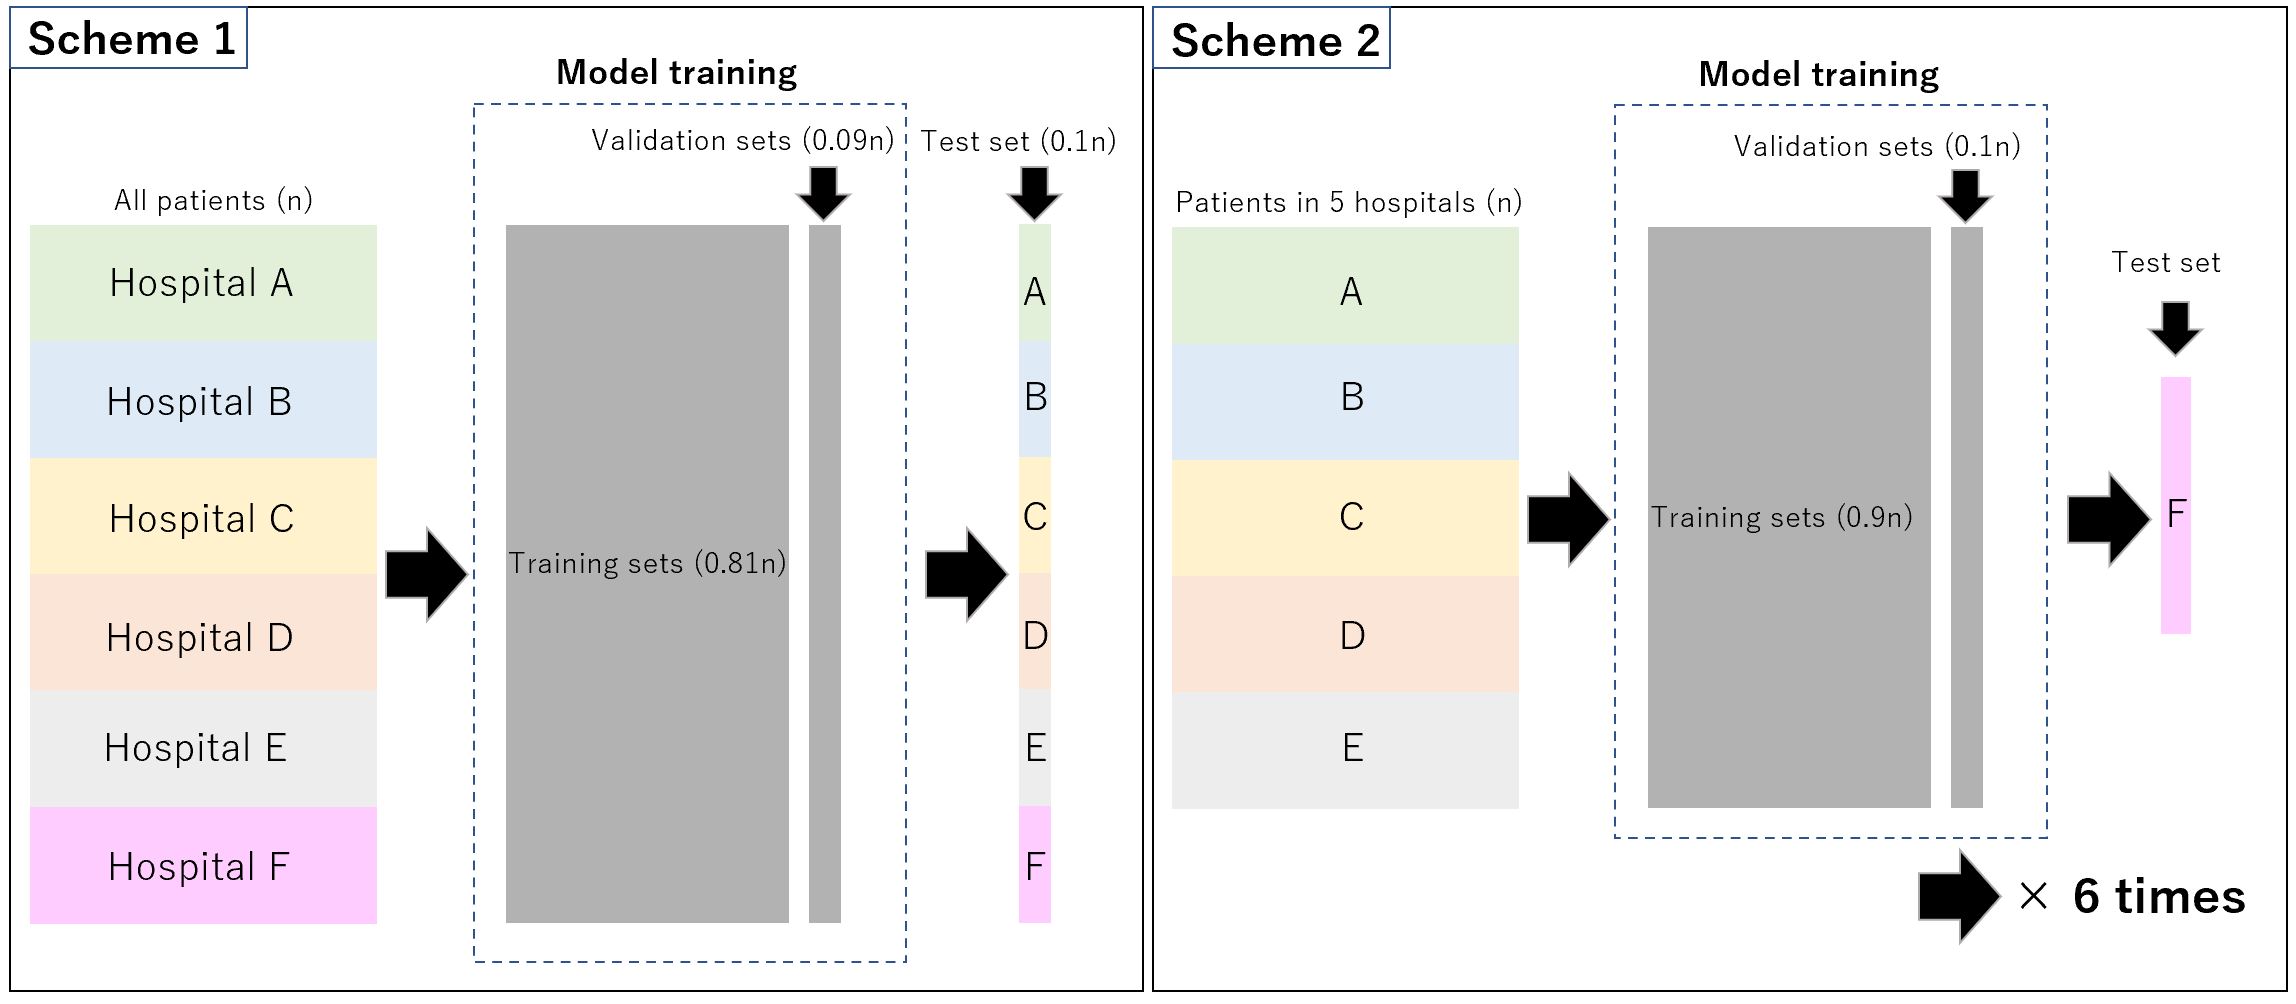
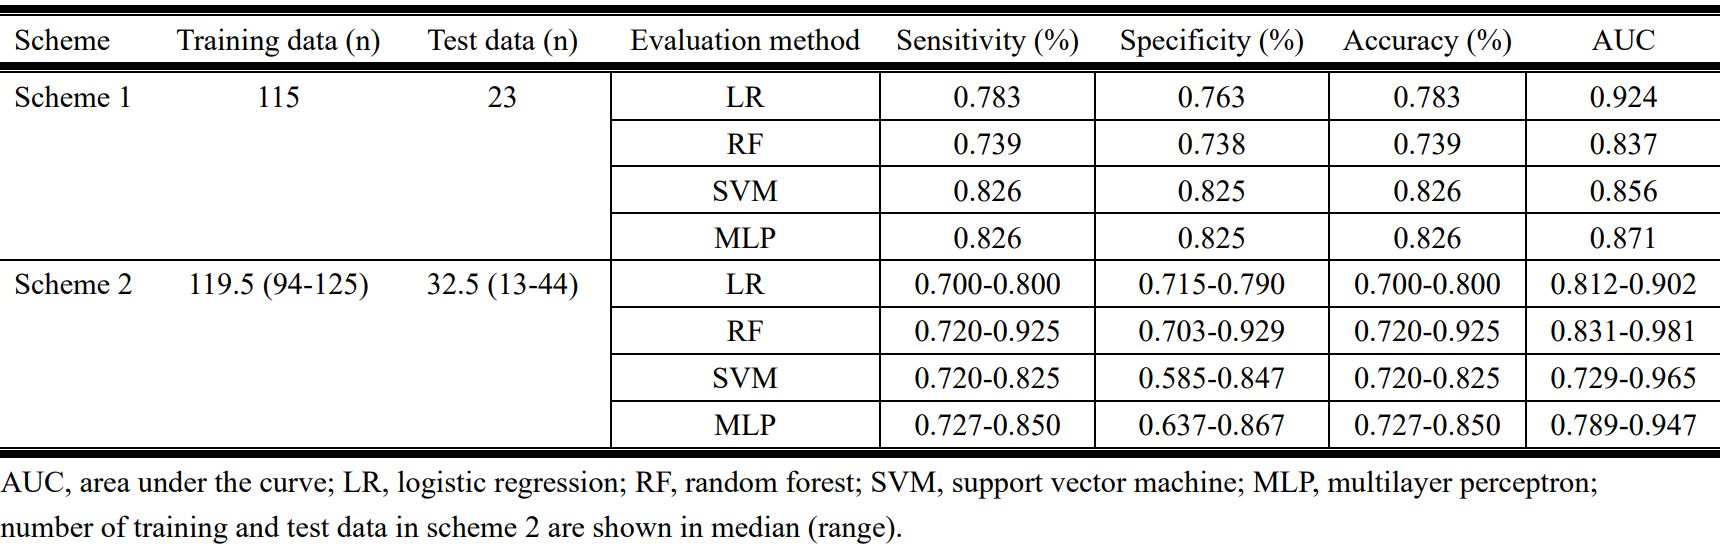
Figure 2. Sensitivity, specificity, accuracy, and area under the curve values for differentiating between myelodysplastic syndrome and aplastic anemia, using Schemes 1 and 2 with T1-weighted image datasets.
AUC, area under the curve; LR, logistic regression; RF, random forest; SVM, support vector machine; MLP, multilayer perceptron.
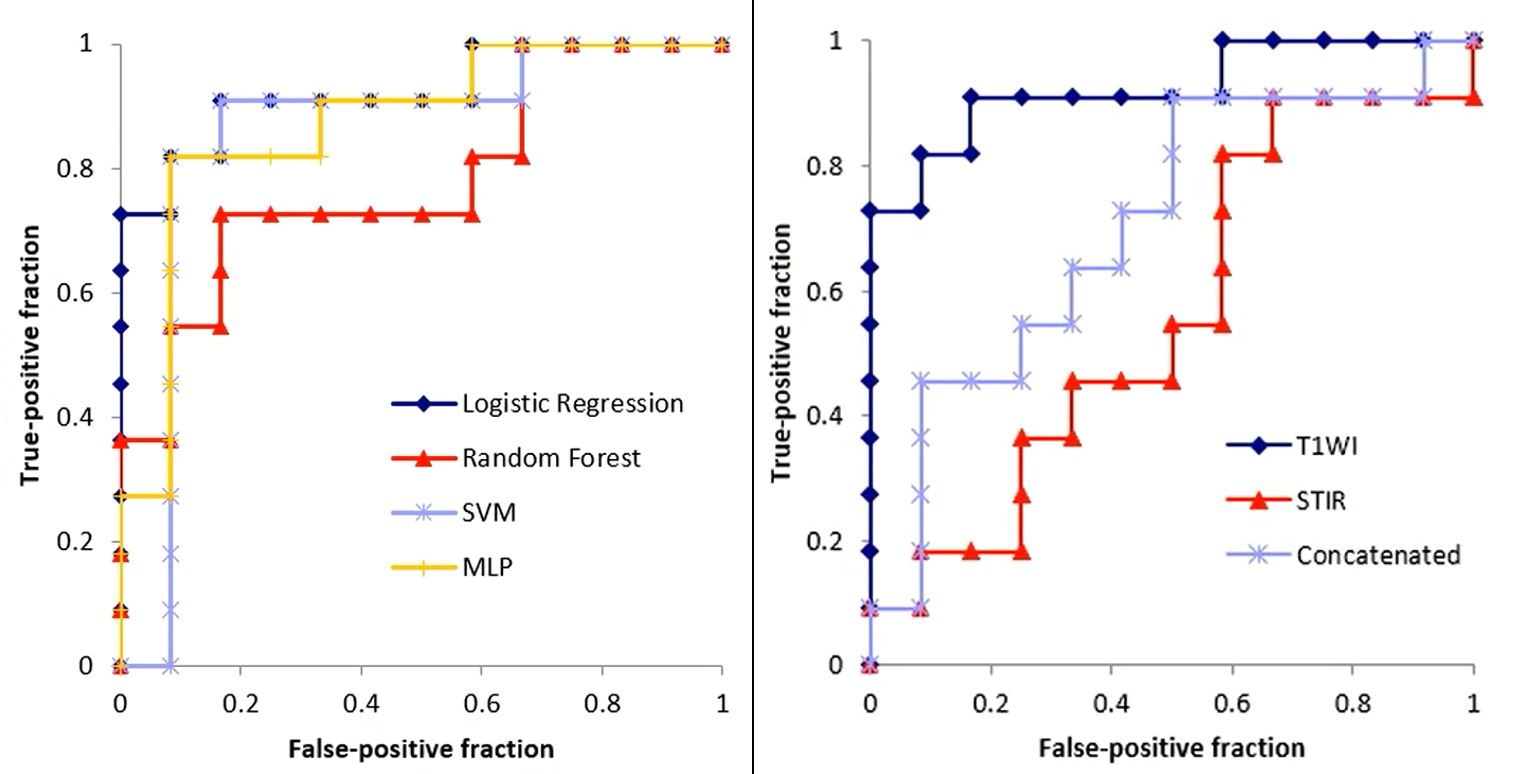
Figure 3. Left: In Scheme 1, the logistic regression (LR) model has the best performance. Receiver-operating characteristic analysis revealed the superior performance of this model for T1-weighted images (AUC, 0.92). Right: The LR model was not predictive for STIR or concatenated images (AUC, 0.56 and 0.71, respectively).
SVM, support vector machine; MLP, multilayer perceptron.
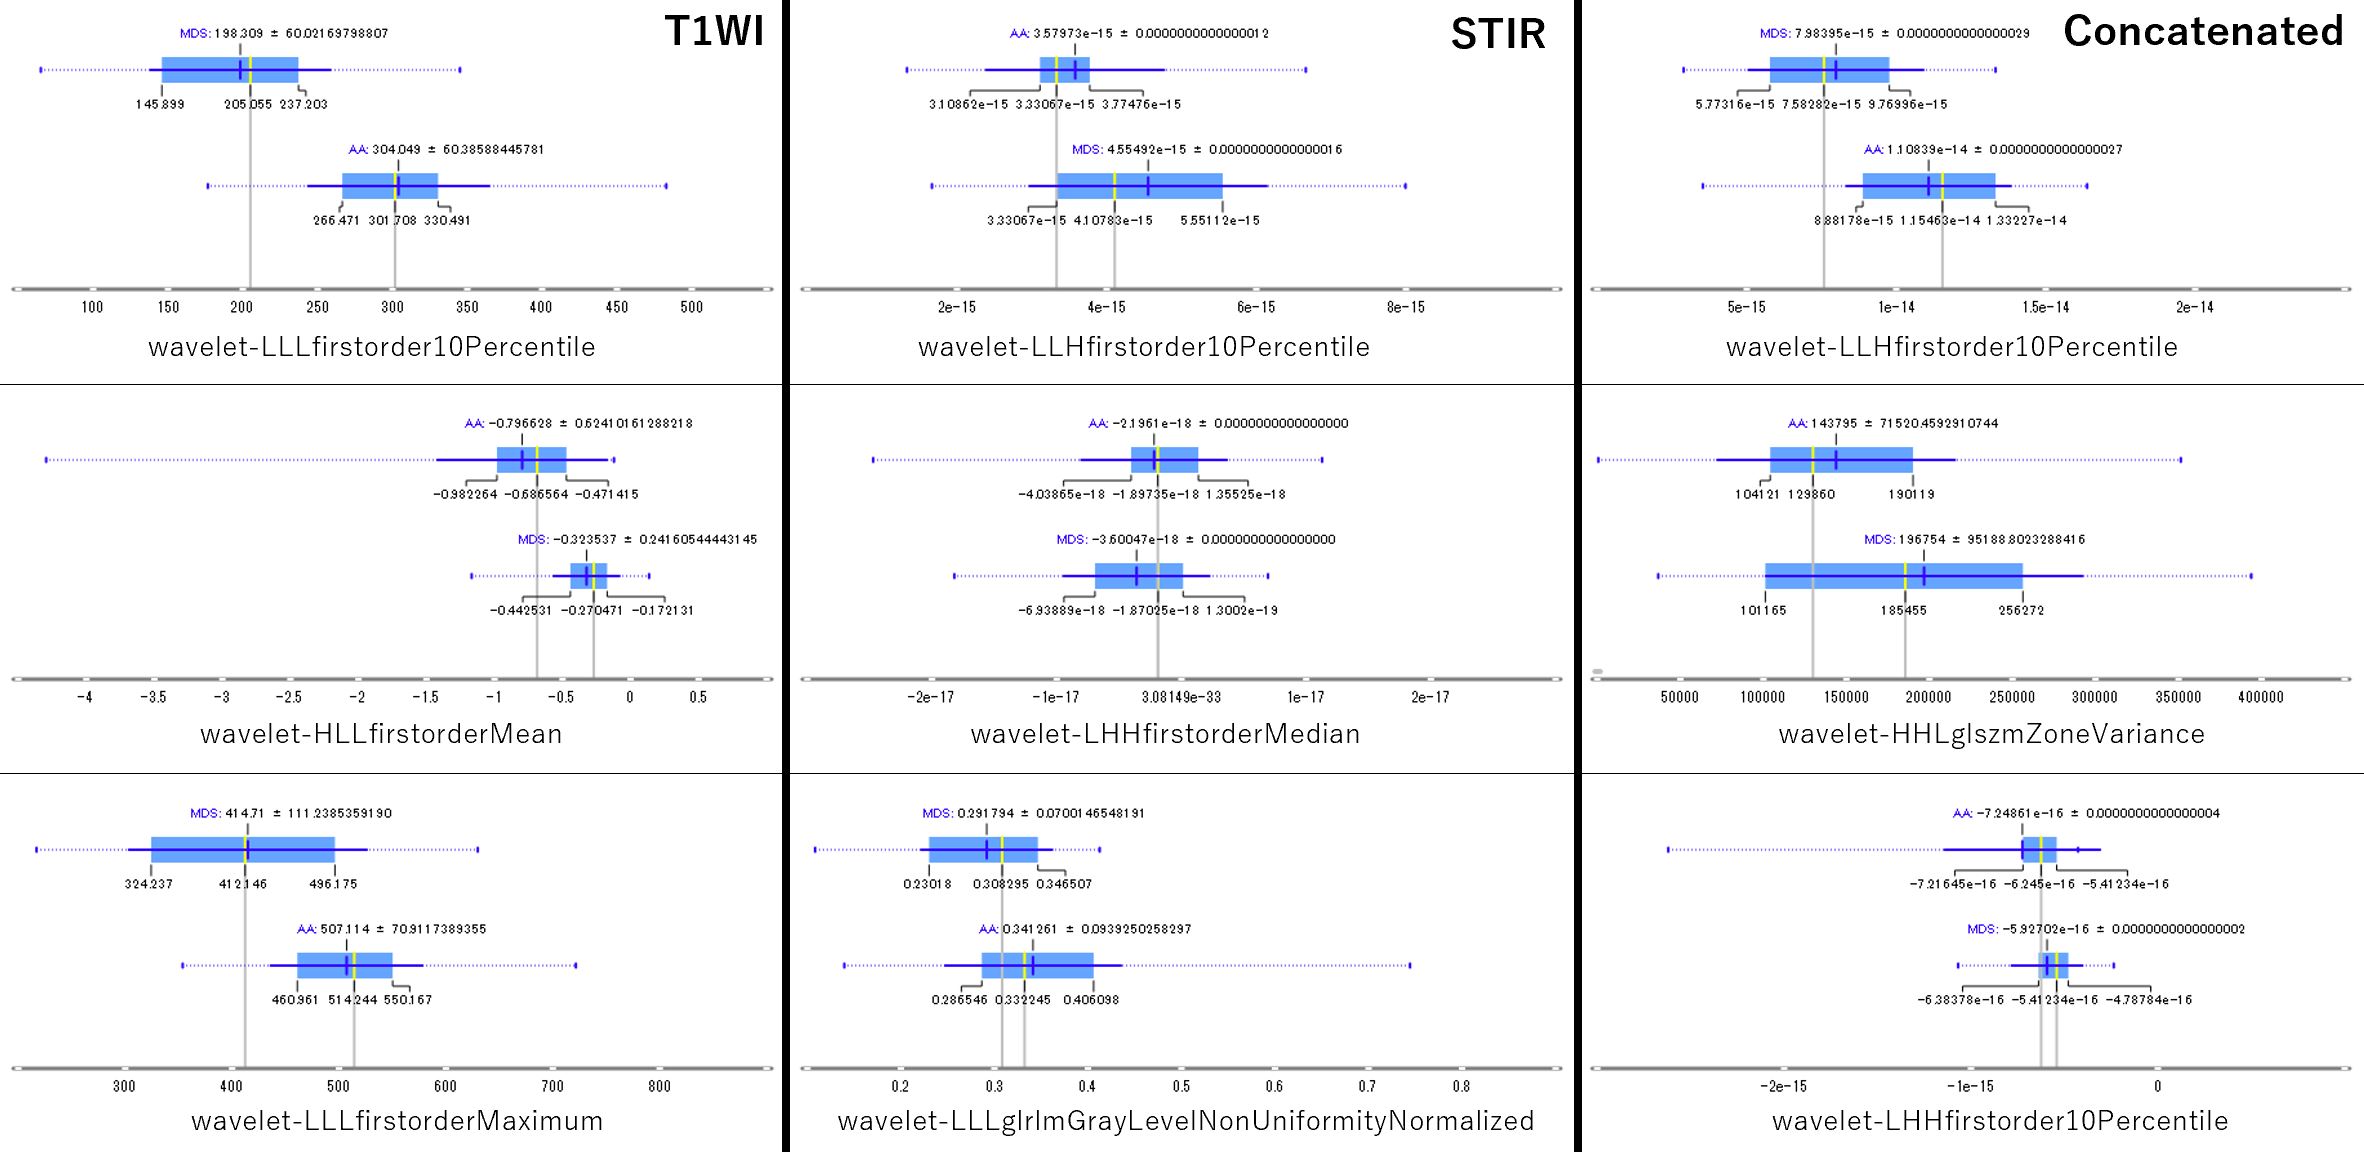
Figure 4. Box-whisker plots show the values of the best three radiomic features derived from T1-weighted, STIR, and concatenated image datasets for distinguishing between myelodysplastic syndrome and aplastic anemia.
Dark blue vertical line, mean; thin blue horizontal line, standard deviation; blue highlighted area, values between the first and the third quartile; yellow vertical line, median.