4074
Evaluation of the risk of osteoporosis in diabetic patients by IDEAL-IQ1Department of Radiology, West China Second University Hospital, Sichuan University, Chengdu, China, 2the First Affiliated Hospital of Dalian Medical University, Dalian, China
Synopsis
Osteoporosis is a progressive metabolic bone lesion characterized by a decrease in bone mass per unit volume, which results in increased risk of bone fractures. Noninvasive and reliable assessment of osteoporosis is essential for clinical diagnosis and treatment. Studies have reported that precise measurement of fat content in the bone marrow is a biomarker for quantifying osteoporosis. IDEAL-IQ is a method used for quantitative measurement of fat fraction and iron content related parameters by multi-echo acquisition.
Synopsis
Diabetes is a metabolic disease with a risk of fracture due to osteoporosis. Osteoporosis is a progressive metabolic bone lesion characterized by a decrease in bone mass per unit volume, which results in increased risk of bone fractures. Noninvasive and reliable assessment of osteoporosis is essential for clinical diagnosis and treatment. Studies have reported that precise measurement of fat content in the bone marrow is a biomarker for quantifying osteoporosis. IDEAL-IQ is a method used for quantitative measurement of fat fraction and iron content related parameters by multi-echo acquisition[1].Purpose
The aim of the study was to explore the agreement and reliability of the Proton Density Fat Fraction (PDFF) values of lumbar vertebra measured by Magnetic Resonance Imaging (MRI) IDEAL-IQ sequence at different field strengths and to investigate the value of IDEAL-IQ in the assessment of osteoporosis risk in diabetic.Materials and Methods
After providing informed consent, a total of 36 diabetic patients were subjected to 1.5T and 3.0T MR lumbar vertebra and Dual energy X-ray absorptiometry (DXA) scan, respectively. MR scan sequences included sagittal T2WI, T1WI, axial T1WI and IDEAL-IQ sequences. After DXA determination, patients were divided into normal bone mass, osteopenia and osteoporosis group. The IDEAL-IQ sequence automatically generates 6 images, including R2* relaxation rate images, water images, fat images, in-phase and out-phase images. The FF values of vertebral bone marrows were measured on GE AW4.6 post processing workstation: the largest slice of the sagittal plane of the L1~L5 vertebral body (the image through the middle of the lumbar vertebra) was selected, and the rectangular region of interest (ROI) was manually placed to the center of the vertebral body (the ROI of each vertebral body was the same). In addition, each ROI included the vertebral cancellous bone to the maximum, without the cortical bone, endplate and intervertebral disc (Fig.1a-b). Each vertebral body was averaged after 3 measurements. Bland-Altman difference plots were used to assess bias and agreement among PDFF measurements across the two different field strengths. Pearson correlation coefficients were calculated to assess the linear relationship between PDFF and BMD.Results
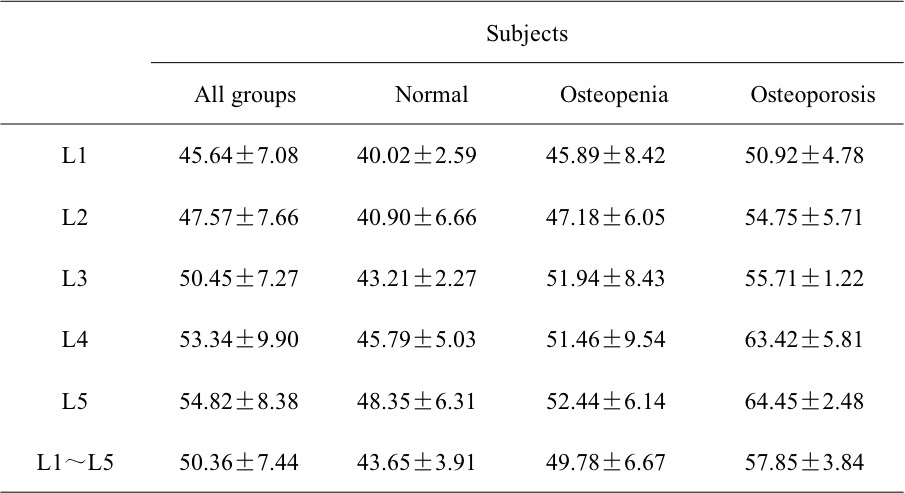
Excellent interrater agreement was displayed between the PDFF of lumbar vertebra obtained with 1.5T and 3.0T MR scanners (Fig.2) (Tab.1). Paired sample t-test analysis showed 1.5T & 3.0T L1 vertebral bodies (t=0.59, P=0.56), 1.5T & 3.0T L2 vertebral bodies (t=-1.04,P=0.31), 1.5T & 3.0T L3 vertebral bodies (t=-0.74, P=0.46), 1.5T & 3.0T L4 vertebral bodies (t=-1.18,P=0.25), and 1.5T & 3.0T L5 vertebral bodies (t=-1.12,P=0.27). The average PDFF values among three groups were 43.65±3.91, 49.78±6.67 and 57.85±3.84, respectively (Tab.2). One-way ANOVA showed a statistically significant difference in PDFF between normal and osteoporosis group (Post-Hoc LSD, P=0.013), while no significant difference was found between normal and osteopenia group or osteopenia and osteoporosis group (Post- Hoc LSD, P=0.084; Post-Hoc, P=0.171). Pearson correlation analysis showed that BMD was negatively correlated with PDFF values(r=-0.88,P<0.01) (Fig.3).Discussion
Diabetes is a metabolic disease characterized by chronic hyperglycemia that results from defective insulin secretion and/or insulin actions, and its prevalence has gradually increased over recent years [2]. Recent studies have shown that diabetes may have harmful effects on bone metabolism and bone quality, which increases osteoclast function, and decreases osteoblast function, leading to accelerated bone loss, osteopenia and osteoporosis [3]. Additionally, diabetic patients have greater risk of fracture due to the complications such as osteoporosis [4-4]. Recent studies have shown that the bone marrow fat content is a prospective biomarker for evaluating osteoporosis [6]. Thus, accurate quantification of bone marrow fat content is of great significance for the prediction and evaluation of the risk of osteoporosis.Our results showed good agreement and reproducibility of quantifying the lumbar vertebra bone marrow fat content by using MRI IDEAL-IQ sequence at 1.5T and 3.0T imaging. Furthermore, we found that the average PDFF values in normal, osteopenia and osteoporosis group were gradually increasing, and that the PDFF value of osteoporosis group was significantly higher compared to normal group (P <0.05). Our data also suggested that patients with osteopenia and osteoporosis had a higher PDFF value compared to those in normal group. With the decrease of bone mass, the PDFF value gradually increased; the PDFF value of lumbar vertebral measured by MR IDEAL-IQ technology had strong negative correlation with the BMD measured by the bone mineral density. Moreover, our data revealed that the PDFF measurement is not affected by different MR field strengths, which suggested that the quantitative assessment of lumbar vertebral fat content in diabetic patients by IDEAL-IQ can be performed with devices of different MR field strength. Since this approach can be used to evaluate and predict the risk of osteoporosis in diabetic patients, it is of great significance for clinical guidance.Conclusion
IDEAL-IQ can quantitatively evaluate the fat fraction of lumbar vertebral and evaluate the risk of osteoporosis in diabetic patients. PDFF measurements at MR are highly reproducible between different field strengths, which is of guiding value for clinical diagnosis and treatment.Acknowledgements
No acknowledgement found.References
[1] Reeder S B , Pineda A R , Wen Z , et al. Iterative decomposition of water and fat with echo asymmetry and least-squares estimation (IDEAL): application with fast spin-echo imaging. Magn Reson Med, 2005. 54(3): 636-644.
[2] Drouin-Chartier Jean-Philippe, Zheng Yan, Li Yanping, et al. Changes in Consumption of Sugary Beverages and Artificially Sweetened Beverages and Subsequent Risk of Type 2 Diabetes: Results From Three Large Prospective U.S. Cohorts of Women and Men. Diabetes Care, 2019.
[3] Drouin-Chartier Jean-Philippe, Zheng Yan, Li Yanping, et al. Changes in Consumption of Sugary Beverages and Artificially Sweetened Beverages and Subsequent Risk of Type 2 Diabetes: Results From Three Large Prospective U.S. Cohorts of Women and Men. Diabetes Care, 2019.
[4] Nomura S, Kitami A, Takao-Kawabata R, et al. Teriparatide Improves Bone and Lipid Metabolism in a Male Rat Model of Type 2 Diabetes Mellitus. Endocrinology, 2019, 160(10): 2339-2352.
[5] Nomura S, Kitami A, Takao-Kawabata R, et al. Teriparatide Improves Bone and Lipid Metabolism in a Male Rat Model of Type 2 Diabetes Mellitus. Endocrinology, 2019, 160(10): 2339-2352.
[6] Li X, Kuo D, Schafer A L, et al. Quantification of vertebral bone marrow fat content using 3 Tesla MR spectroscopy: reproducibility, vertebral variation, and applications in osteoporosis. J Magn Reson Imaging, 2011. 33(4): 974-979.
Figures