4072
AcidoCEST MRI pH is strongly correlated with GLUT1 immunohistochemistry in multiple myeloma1Radiology Service, Veterans Affairs San Diego Healthcare System, San Diego, CA, United States, 2Radiology, University of California, San Diego, CA, United States, 3Greater Los Angeles Veteran Administration Healthcare System, Los Angeles, CA, United States, 4University of California, Los Angeles, CA, United States
Synopsis
Multiple myeloma (MM) is a malignant plasma cell disease. Adaptive responses to hypoxia may be an essential element in its progression. The purpose of this study was to determine the feasibility of acidoCEST MRI for pHe measurement on a mouse model of MM with comparison with GLUT1 staining.
Introduction
Multiple myeloma (MM), the most frequent cancer to involve the skeleton, is an incurable disease of malignant plasma cells accumulated in the bone marrow (BM) 1. Despite newer treatments 3, patients with refractory and relapsing disease still have a poor outcome 4. Previous studies point to hypoxia’s adaptive responses as an essential element in MM progression 5 and drug resistance 6.Tumors such as MM tend to favor glycolysis even in aerobic conditions (known as the Warburg effect) 7. The Warburg effect leads to an increased metabolic rate, glucose transporters, lactic acid, and carbonic acid, resulting in a decrease in the extracellular pH (pHe) 8. The degree of hypoxia-responsive metabolic changes and their corresponding pHe decrease depends upon the upregulation of glucose transporters (GLUTs) to provide increased glucose uptake, making it an interesting biomarker of hypoxia and tumor cells 9.
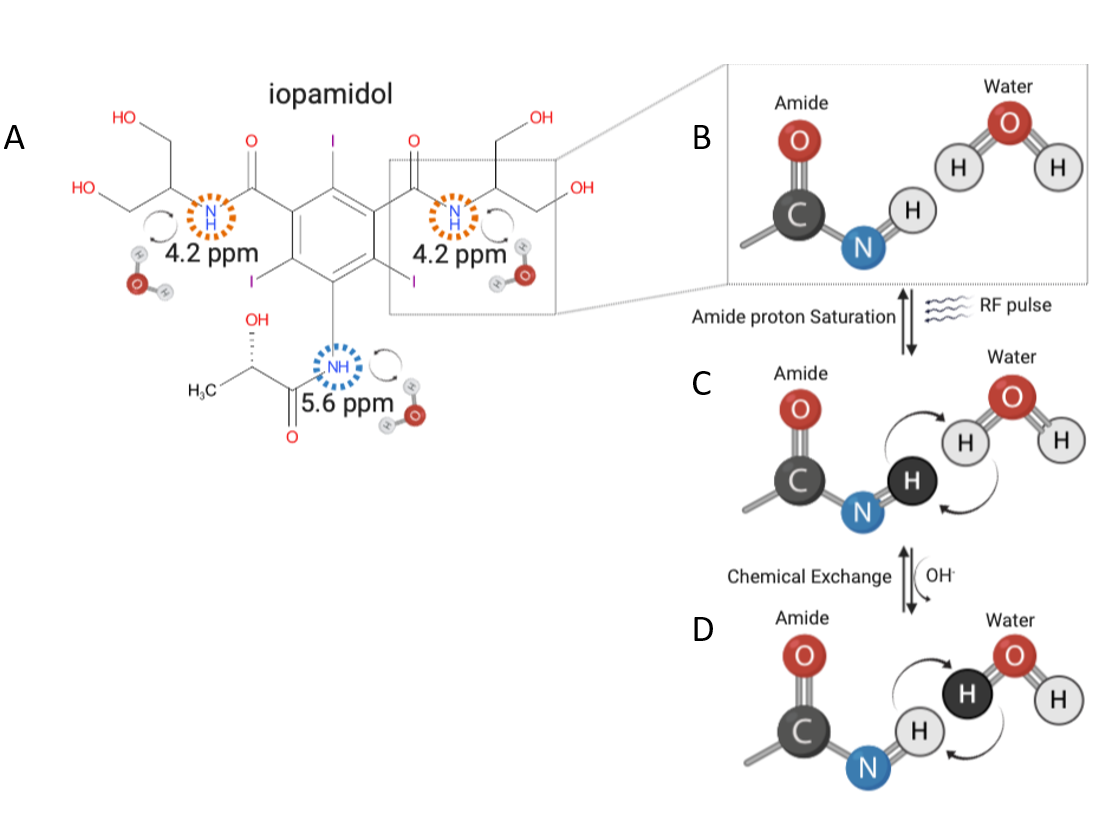
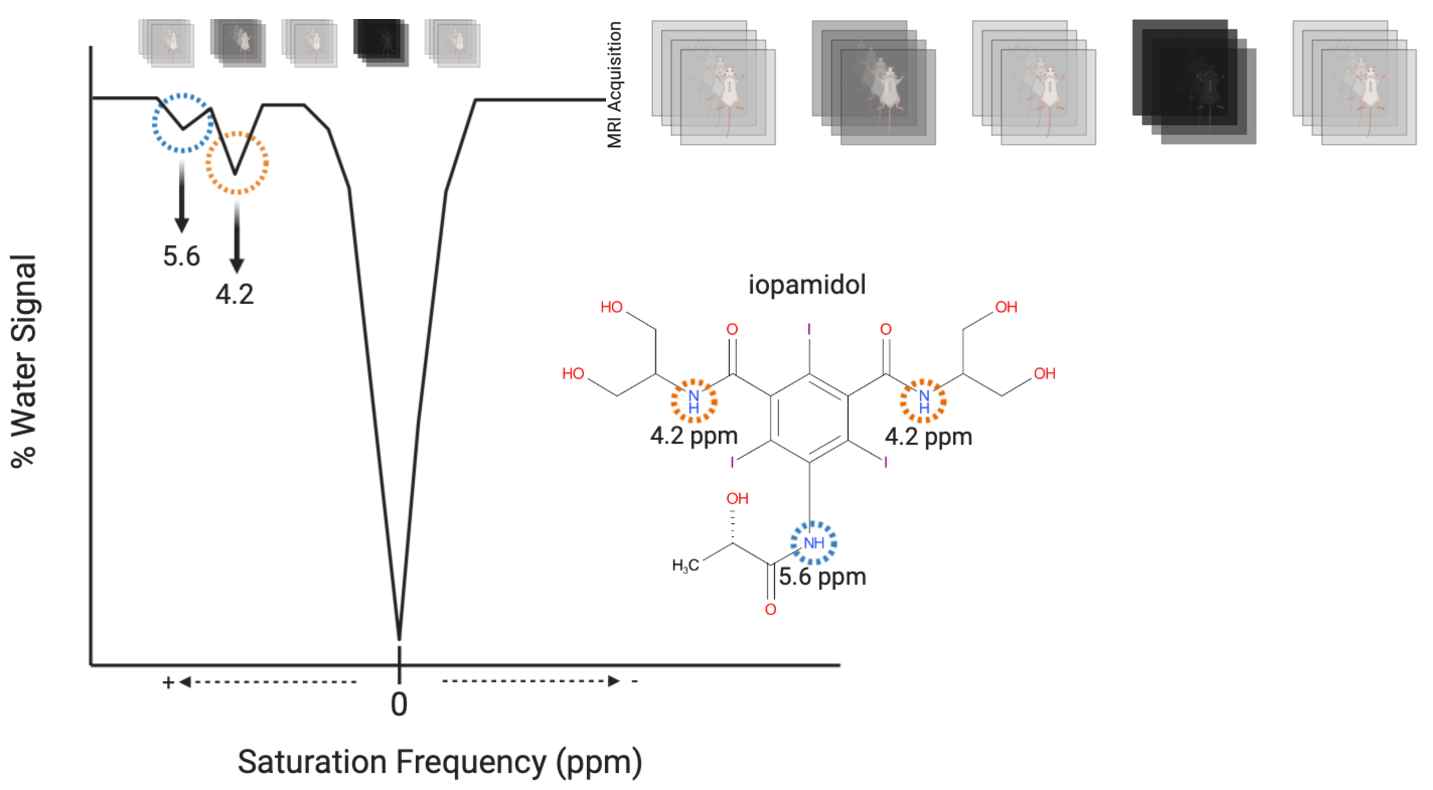
AcidoCEST MRI, on the other hand, is a technique that uses the contrast agent iopamidol to induce chemical exchange saturation transfer (CEST) effect in water molecules, altering the MRI signal (Figures 1 and 2). The CEST effect is pH-dependent, thus allowing indirect measurement of the extracellular pH . The high spatial resolution may prove invaluable since MM displays enormous inter-and intra-tumoral heterogeneity, which has significant consequences for MM patients' clinical management and outcome 10. This study aimed to determine the feasibility of acidoCEST MRI for in vivo pHe measurement using an orthotopic mouse model of MM compared with GLUT1 immunofluorescence staining as a reference standard.
Methods
Orthotopic BM engrafted MM xenografts were established in NSG/NOD mice using the human 8226 myeloma cell line. Tumor development in the BM was monitored with luciferase activity using a bioluminescent imaging system. AcidoCEST MRI was performed on a Bruker BioSpec 7T system approximately six weeks after intravenous challenge, before and after intravenous administration of iopamidol. BM pHe values were generated via fitting the CEST spectrum with the Bloch-McConnell equations. After sacrificing, osseous structures were imaged with confirmation of lesions using a µCT scanner. Samples were decalcified, sectioned, and immunostained for GLUT1 expression. Pearson’s correlation was used to assess the relationship between MRI pHe and [H3O] versus GLUT1 expression.Results and Discussion
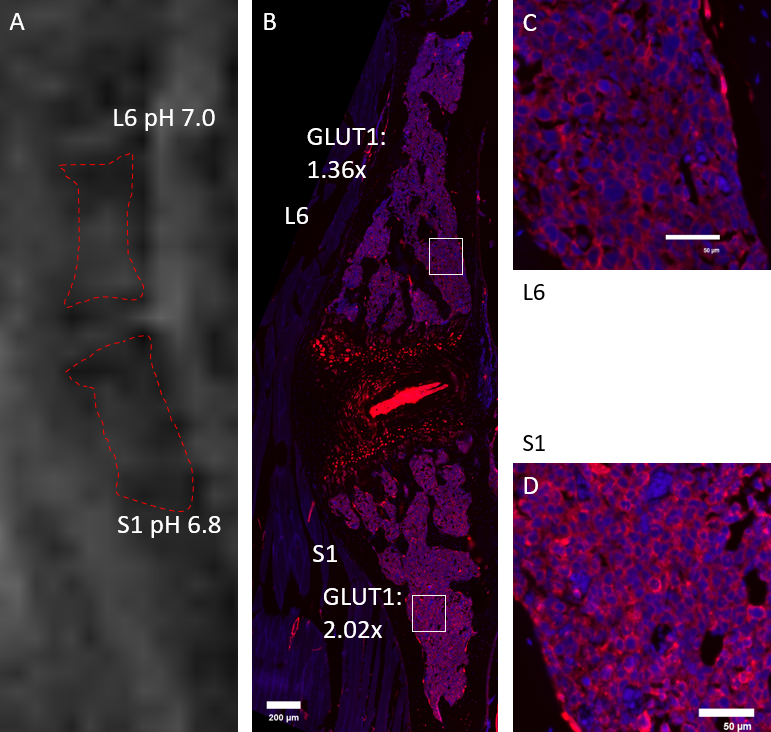
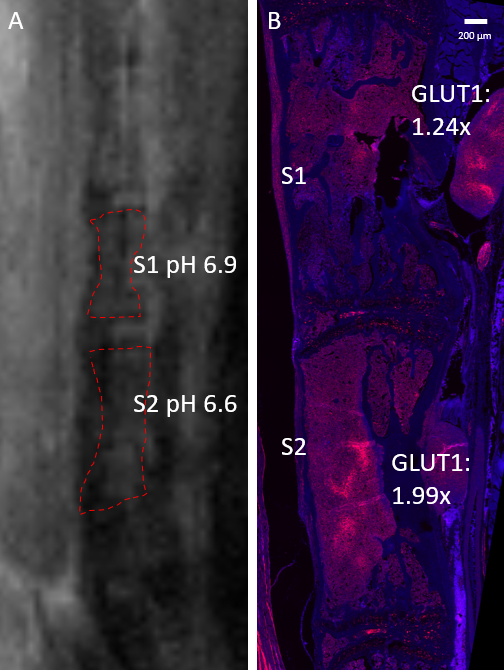
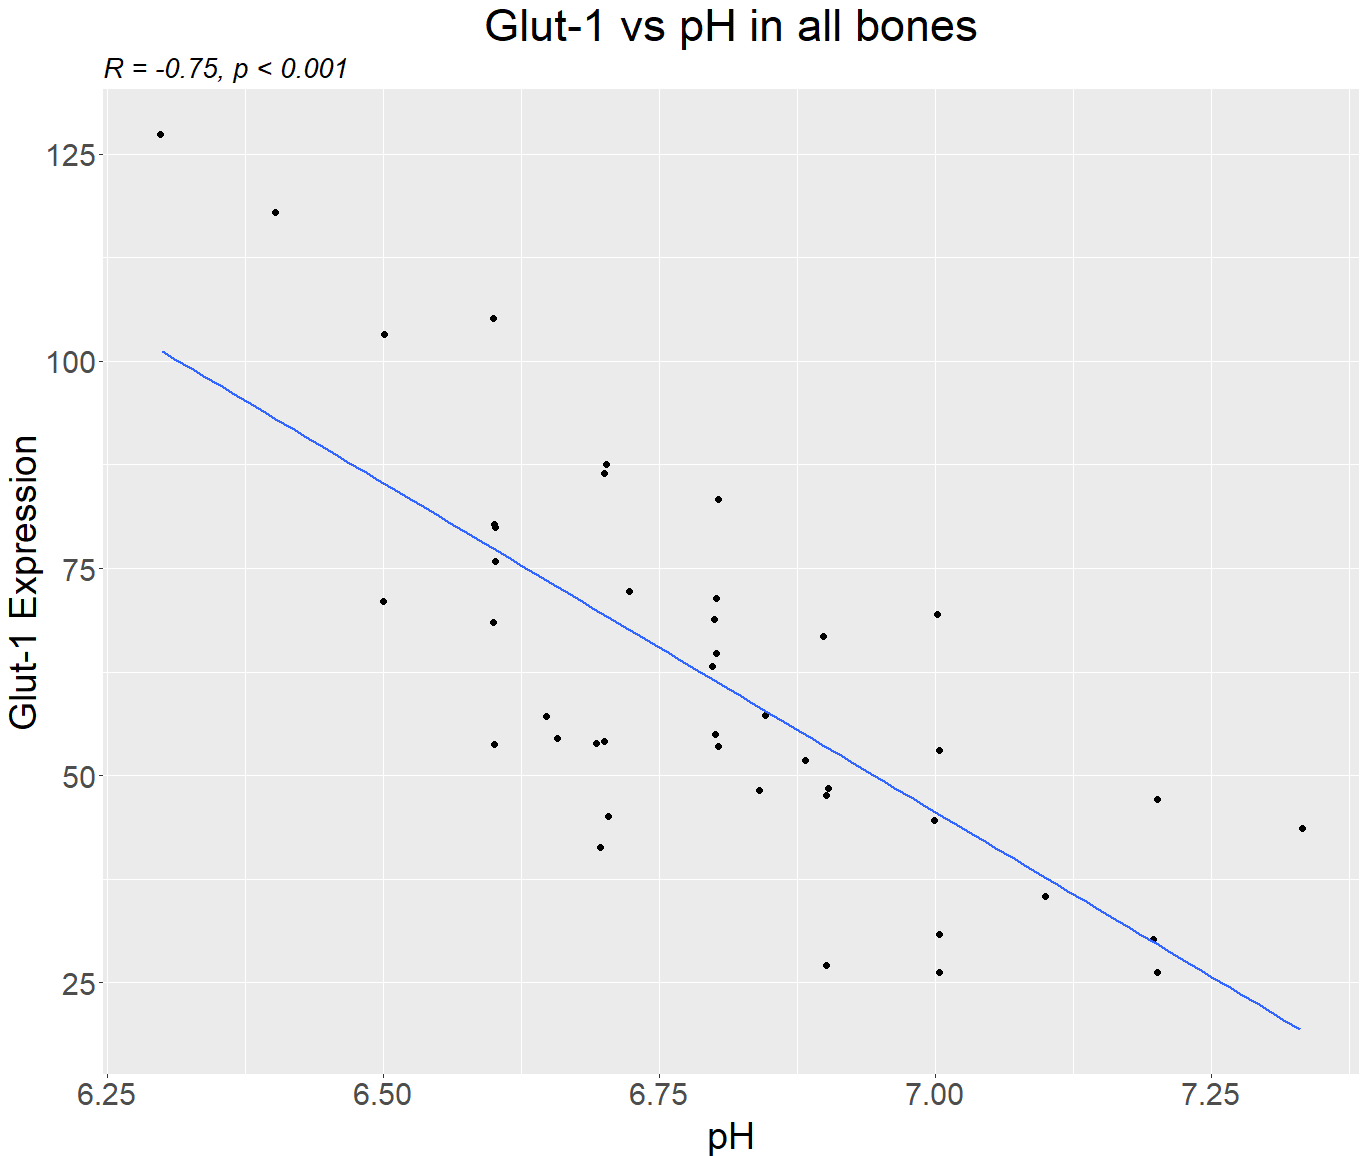
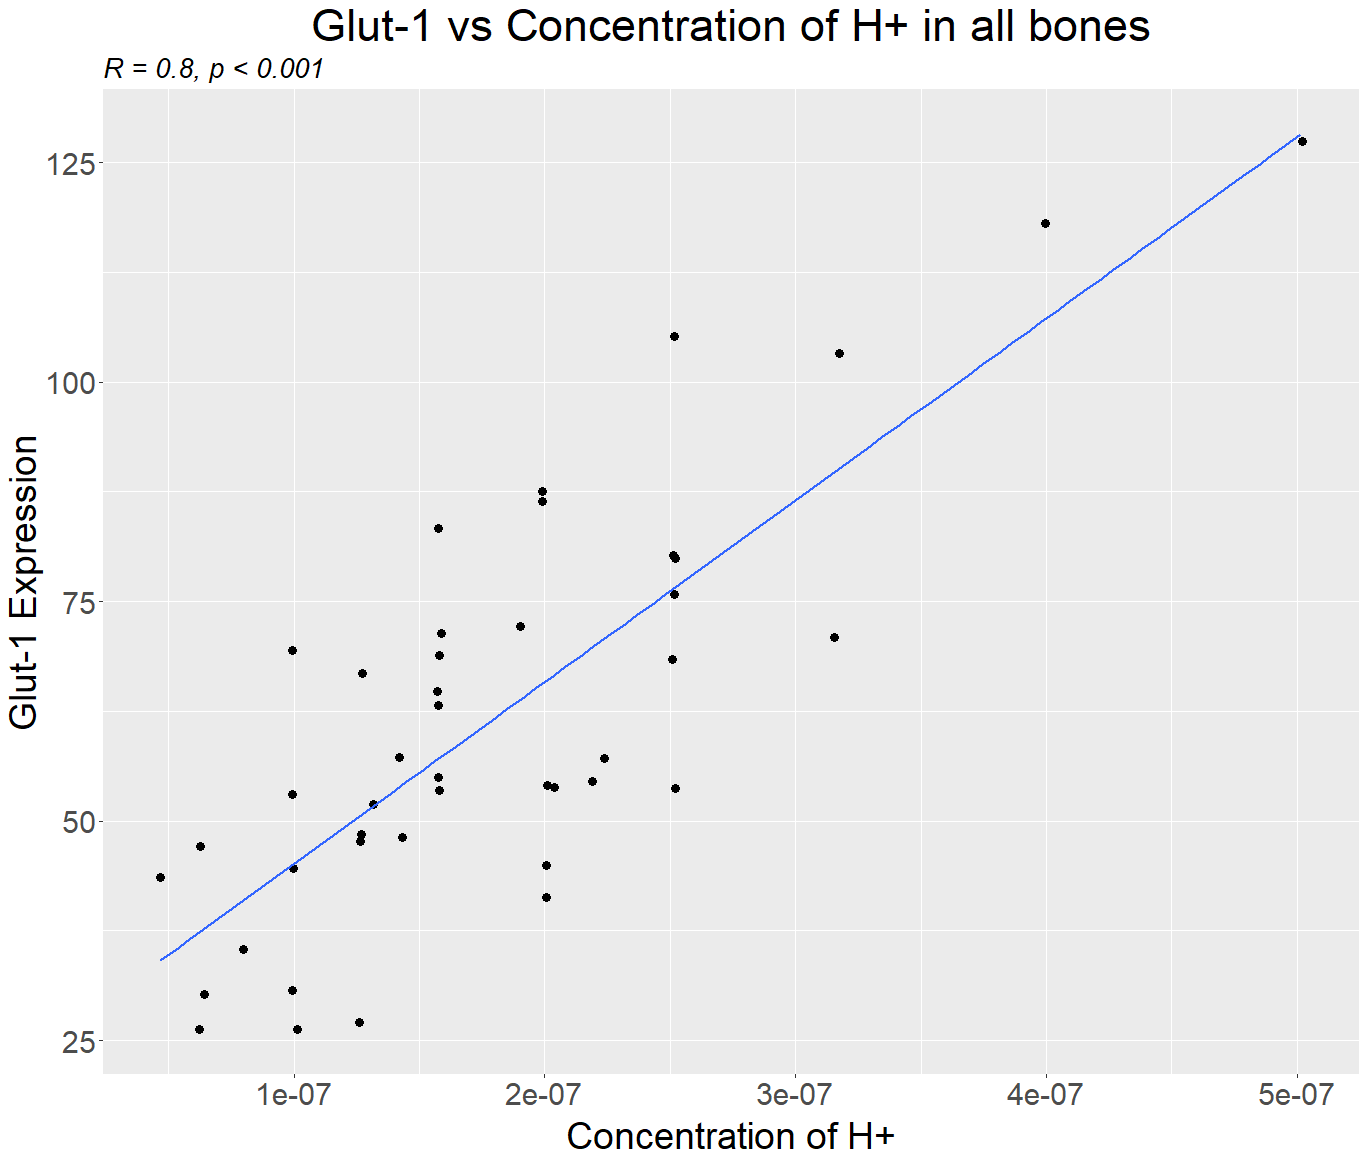
The spine was selected for CEST-FISP imaging in 7 cases, the lower extremity in 2 cases, and the bony pelvis in 1 case (Figures 3 and 4). GLUT1 signal showed strong expression and immunostaining in the bone marrow affected by tumor cells, with varying levels of signal intensity. A strong negative correlation was seen between MRI pHe versus GLUT1 expression (r = -0.75, p < 0.001) (Figure 5). After transformation of pH to [H3O], a strong positive correlation between [H3O] and GLUT1 expression was seen (r = 0.8, p < 0.001) (Figure 6).Ideally, acidoCEST MRI could complement 18F-FDG PET and other molecular imaging modalities to access tumor metabolism. The total metabolic activity of cancer cells may be better assessed with pHe measurements than with established metabolic markers, so it should be investigated as a superior clinical proxy 11,12,13,14.
Conclusion
In conclusion, acidoCEST MRI can measure the extracellular pH of bone marrow affected by multiple myeloma. In this MM orthotopic mouse model, pHe measured by acidoCEST MRI showed strong correlations with the metabolic phenotype of BM tumor assessed by immunofluorescent histological assessment of GLUT1 overexpression.Acknowledgements
The authors acknowledge grant support from the NIH (R01 AR062581, R01 AR068987), Veterans Affairs (I01RX002604 and I01CX001388), and GE Healthcare.References
1. Barwick BG, Gupta VA, Vertino PM, Boise LH. Cell of origin and genetic alterations in the pathogenesis of multiple myeloma. Frontiers in immunology. 2019;10:1121.
2. Turesson I, Bjorkholm M, Blimark CH, Kristinsson S, Velez R, Landgren O. Rapidly changing myeloma epidemiology in the general population: Increased incidence, older patients, and longer survival. Eur J Haematol. 2018.
3. Costa LJ, Brill IK, Omel J, Godby K, Kumar SK, Brown EE. Recent trends in multiple myeloma incidence and survival by age, race, and ethnicity in the United States. Blood Adv. 2017;1(4):282-287.
4. Kumar SK, Lee JH, Lahuerta JJ, et al. Risk of progression and survival in multiple myeloma relapsing after therapy with IMiDs and bortezomib: A multicenter international myeloma working group study. Leukemia. 2012;26(1):149-157.
5. Azab AK, Hu J, Quang P, et al. Hypoxia promotes dissemination of multiple myeloma through acquisition of epithelial to mesenchymal transition-like features. Blood. 2012;119(24):5782-5794.
6. Muz B, Buggio M, Azab F, et al. PYK2/FAK inhibitors reverse hypoxia-induced drug resistance in multiple myeloma. haematologica. 2019;104(7):e310.
7. Warburg O. On the origin of cancer cells. Science. 1956;123(3191):309-314.
8. Chiche J, Brahimi-Horn MC, Pouyssegur J. Tumour hypoxia induces a metabolic shift causing acidosis: a common feature in cancer. J Cell Mol Med. 2010;14(4):771-794.
9. Adekola K, Rosen ST, Shanmugam M. Glucose transporters in cancer metabolism. Current opinion in oncology. 2012;24(6):650.
10. Schurch CM, Rasche L, Frauenfeld L, Weinhold N, Fend F. A review on tumor heterogeneity and evolution in multiple myeloma: pathological, radiological, molecular genetics, and clinical integration. Virchows Arch. 2020;476(3):337-351.
11. Pillai SR, Damaghi M, Marunaka Y, Spugnini EP, Fais S, Gillies RJ. Causes, consequences, and therapy of tumors acidosis. Cancer and Metastasis Reviews. 2019;38(1-2):205-222.
12. Longo DL, Bartoli A, Consolino L, et al. In vivo imaging of tumor metabolism and acidosis by combining PET and MRI-CEST pH imaging. Cancer research. 2016;76(22):6463-6470.
13. Puppulin L, Hosogi S, Sun H, et al. Bioconjugation strategy for cell surface labelling with gold nanostructures designed for highly localized pH measurement. Nature Communications. 2018;9(1):5278.
14. Chen LQ, Howison CM, Jeffery JJ, et al. Evaluations of extracellular pH within in vivo tumors using acidoCEST MRI. Magn Reson Med. 2014;72(5):1408-17
Figures