4069
Significantly reduced collagen and increased water in tibia of patients with osteopenia and osteoporosis detected with ultrashort echo time MRI1Radiology, University of California, San Digeo, La Jolla, CA, United States, 2Radiology Service, VA San Diego Healthcare System, San Diego, CA, United States, 3Orthopaedic Surgery, University of California, San Digeo, La Jolla, CA, United States
Synopsis
Assessment of water and collagen content in bone is missing from DEXA evaluation, in standard osteoporosis diagnosis. Bone signals in ultrashort echo time MRI (UTE-MRI) and inversion recovery UTE-MRI against a known external reference signal were used to measure total, bound, and pore water proton densities. Macromolecular proton density was estimated by multiplying total water proton density with macromolecular fraction derived from UTE magnetization transfer (UTE-MT) modeling. The UTE-evaluated MRI measures demonstrated significantly reduced collagen and increased water content in the tibia of patients with osteoporosis and osteopenia compared with healthy subjects. Hip T-scores showed significant correlation with UTE-MRI measures.
INTRODUCTION
The World Health Organization considers bone mineral density assessment using dual-energy x-ray absorptiometry (DEXA) as the gold standard for OPo diagnosis1–3. Notably, organic matrix, water, and fat together represent ~55% and ~90% of cortical and trabecular bone by volume, respectively4. These components make important contributions to the mechanical properties of bone5,6, but contribute little to DEXA measurement, which may explain in part why the majority of bone fractures cannot be predicted by BMD alone7. Ultrashort echo time MRI (UTE-MRI) allows quantitative assessment of bone8,9. Macromolecular, bound, and pore water protons are the three major proton pools in cortical bone10. Total water proton density (TWPD) and bound water proton density (BWPD) can be measured using bone signals in UTE-MRI and inversion recovery UTE-MRI (IR-UTE-MRI), respectively10,11. Pore water proton density (PWPD) can then be estimated by subtracting BWPD from TWPD. Magnetization transfer UTE (UTE-MT) can indirectly measure the macromolecular proton fraction (MMF) in cortical bone based on two-pool MT modeling12,13, allowing macromolecular proton density (MMPD) to then be estimated as a function of MMF and TWPD. This study aimed to estimate the differences in TWPD, BWPD, PWPD, and MMPD between OPe patients, OPo patients, and healthy control subjects.Methods
Theory: TWPD and BWPD can be estimated by comparing the UTE and IR-UTE signals of cortical bone against the signal of a known external reference (e.g., 22 mmol/LH1, T2*≈0.35, and T1≈5ms)10,11. Since the T2* of cortical bone and the reference are much higher than the echo time (TE) used in these sequences, both T2* and T1 effects can be neglected by using a relatively long repetition time (TR) and low flip angle (FA) in UTE imaging. Thus, TWPD can be estimated using Eq.1 (Fig.1,Eq.1), where η and ρREF are the coil sensitivity and the reference proton density, respectively. For effective pore water nulling, BWPD can be calculated using Eq.2 (Fig.1,Eq.2) 14, where T1-BW is bound water T1 (i.e., 135ms on average). PWPD equals the difference between TWPD and BWPD (Fig.1,Eq.3). Two-pool MT modeling measures MMF as the ratio between MMPD and TWPD based on the magnetization transferred from saturated macromolecular protons to water protons13,15. Thus, MMPD can be calculated using Eq.4 (Fig.1,Eq.4).UTE-MRI imaging: Tibial midshafts in 37 healthy control (36±19 years, subjects<40 or postmenopausal with T-score>-1), 14 OPe (n=14, 72±6 years, -1>T-score>-2.5), and 31 OPo (73±6 years, T-score<-2.5) female subjects were imaged on a 3T clinical scanner (MR750, GE Healthcare) using an eight-channel knee coil. Institutional review board approval and written informed consent were obtained for all recruited subjects. The imaging slab was centered at the middle of the tibia and localized based on the operator experience. A 3D-UTE-Cones sequence (TR=50ms, TE=0.032ms, FA=10˚) and a 3D-IR-UTE-Cones sequence (TR=100ms, TI=45ms, TE=0.032ms, FA=20˚) were performed to measure total and bound water proton densities. A UTE-based actual flip angle imaging-variable TR (UTE-AFI-VTR) sequence (AFI: TE=0.032ms, TRs=20ms and 100ms, VTR: TE=0.032ms, TRs=20-100ms, FA=45˚) was performed for T1 measurement16. A set of 3D-UTE-Cones-MT data was acquired (saturation powers=500°, 1000°, and 1500°; frequency offsets=2, 5, 10, 20, 50kHz; FA=7˚) for UTE-MT modeling. Field-of-view, matrix dimension, nominal voxel size, number of slices, and slice thickness were 14cm, 160×160×0.87mm, 24, and 5mm, respectively. The total scan time was approximately 40 minutes.
Data analysis: Average collagen and water contents were calculated in whole cross-sections of tibial midshaft (Figure 1) using a home-developed MATLAB code based on Eq.1-4. Student’s t-test was used to compare between healthy Ctrl, OPe, and OPo cohorts. Pearson’s correlation was calculated between UTE-MRI measures and hip T-score. P-values<0.05 were considered significant.
Results
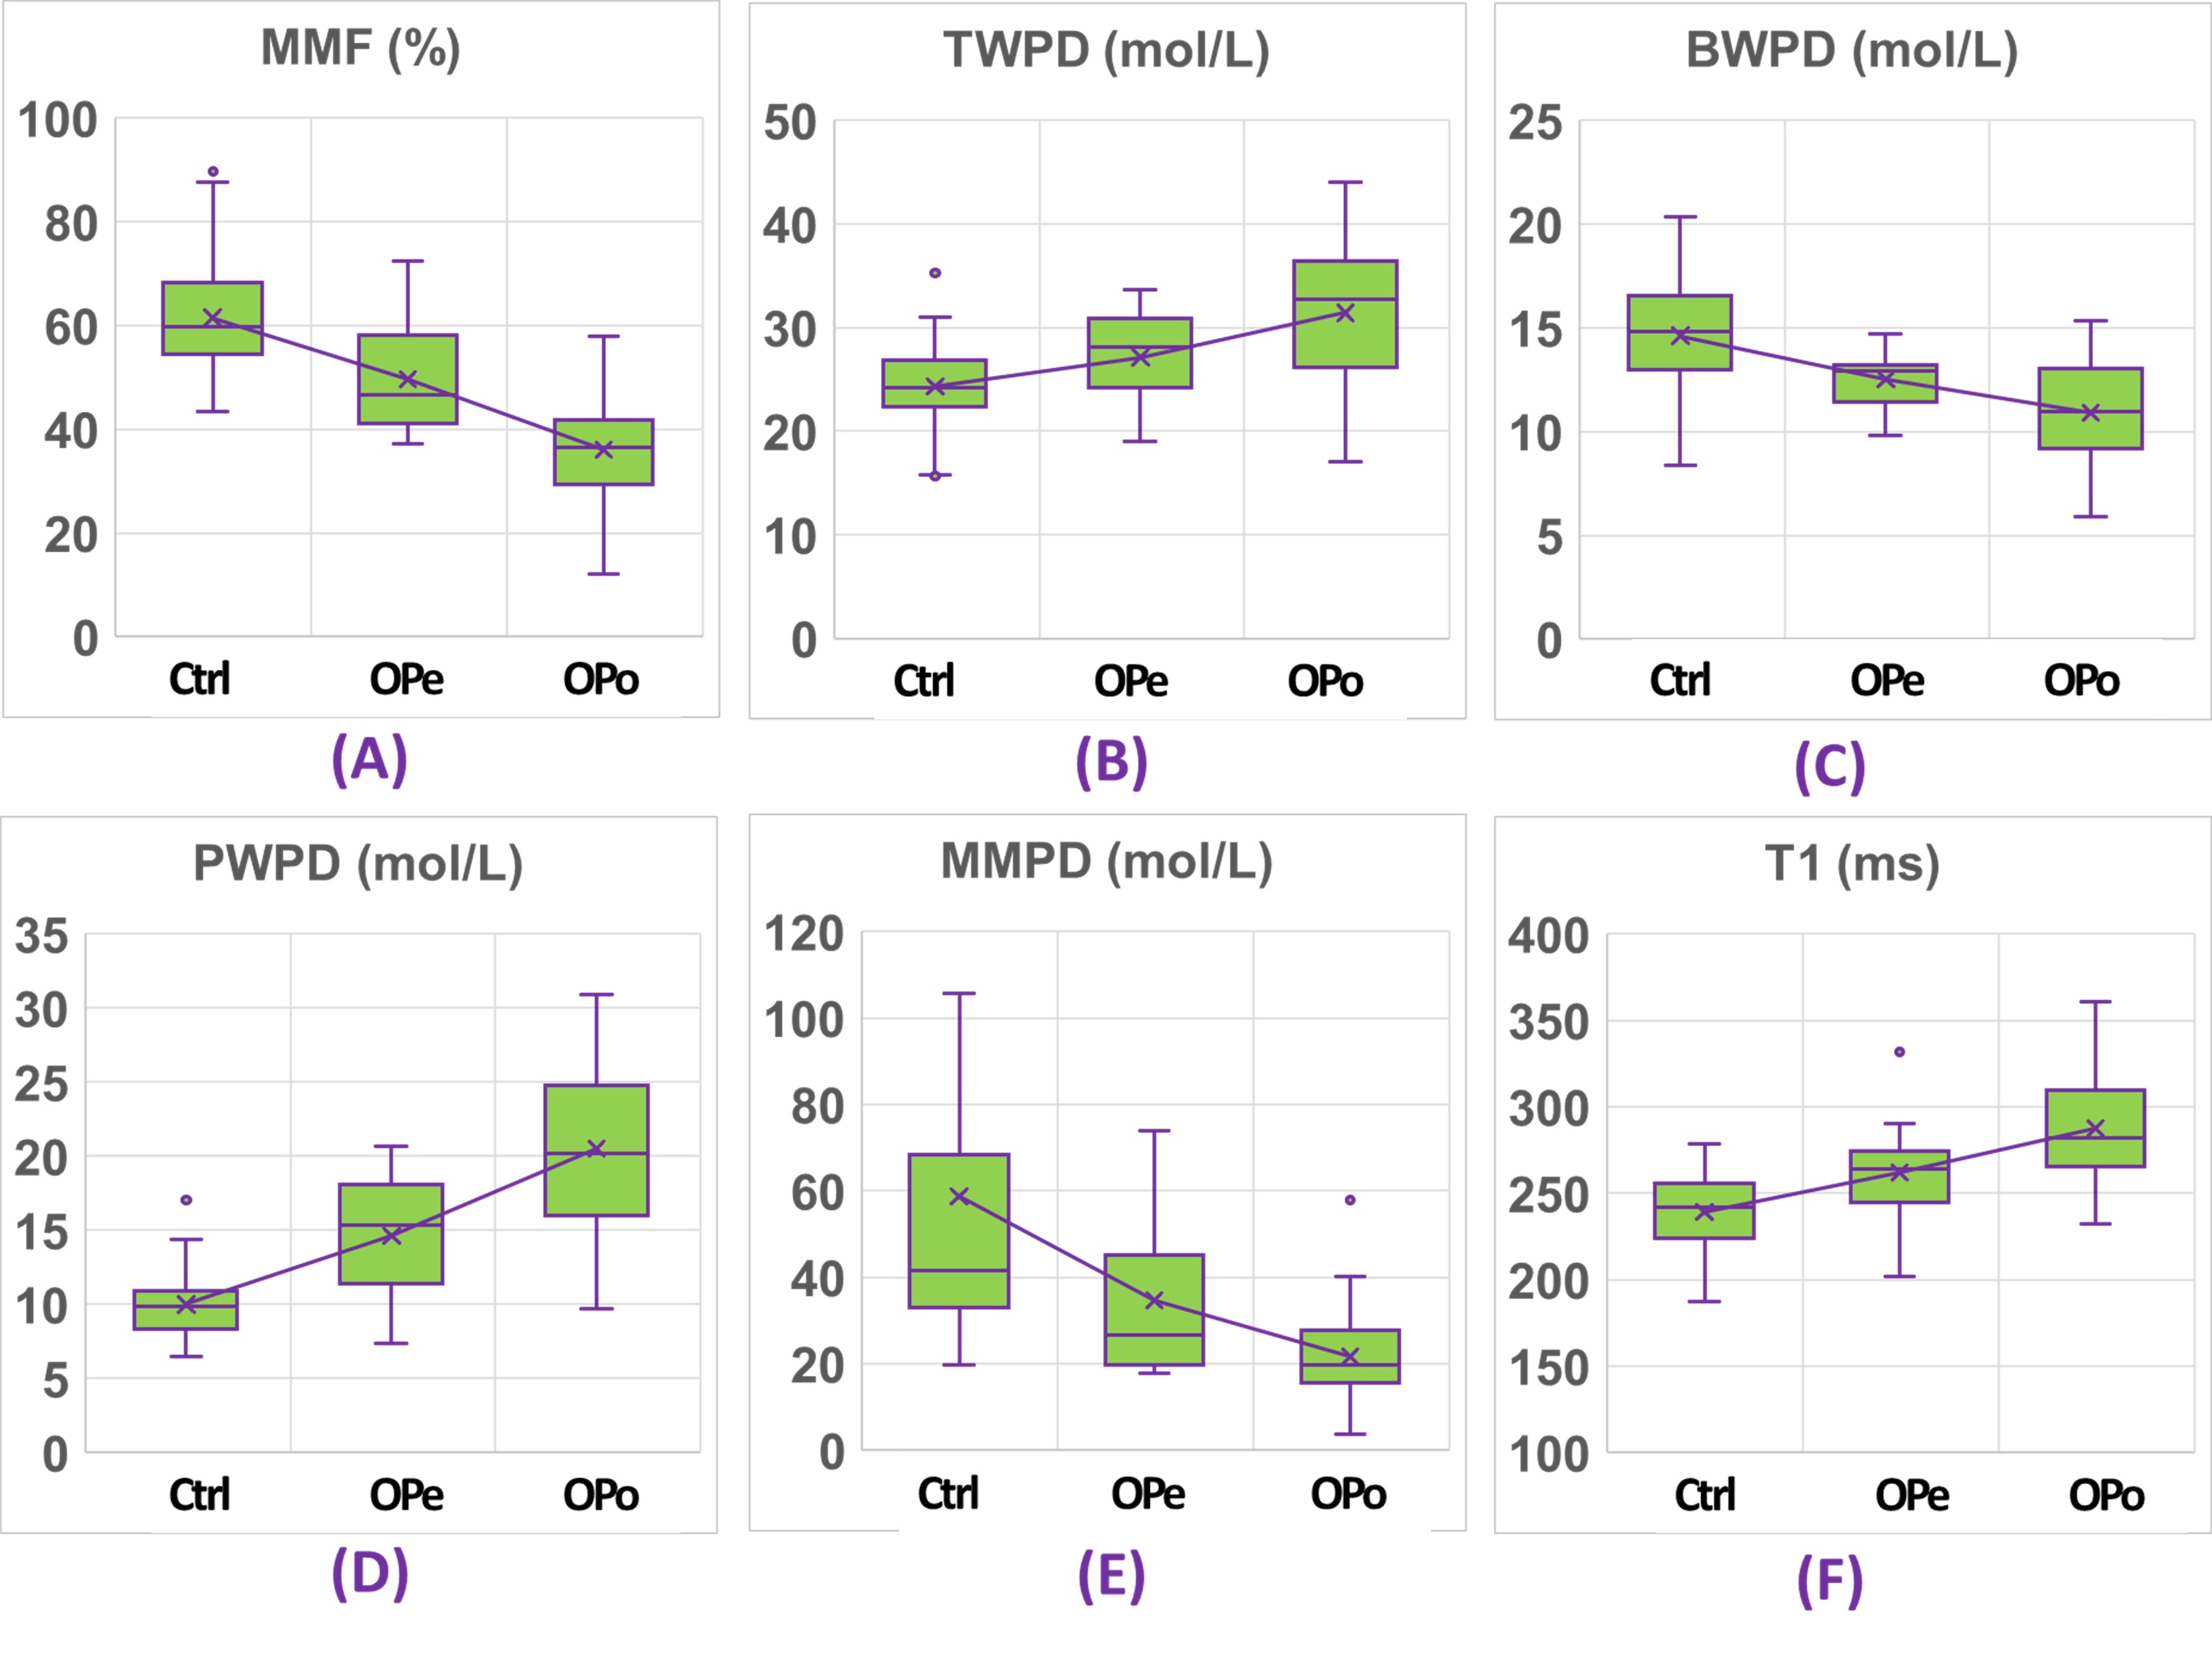
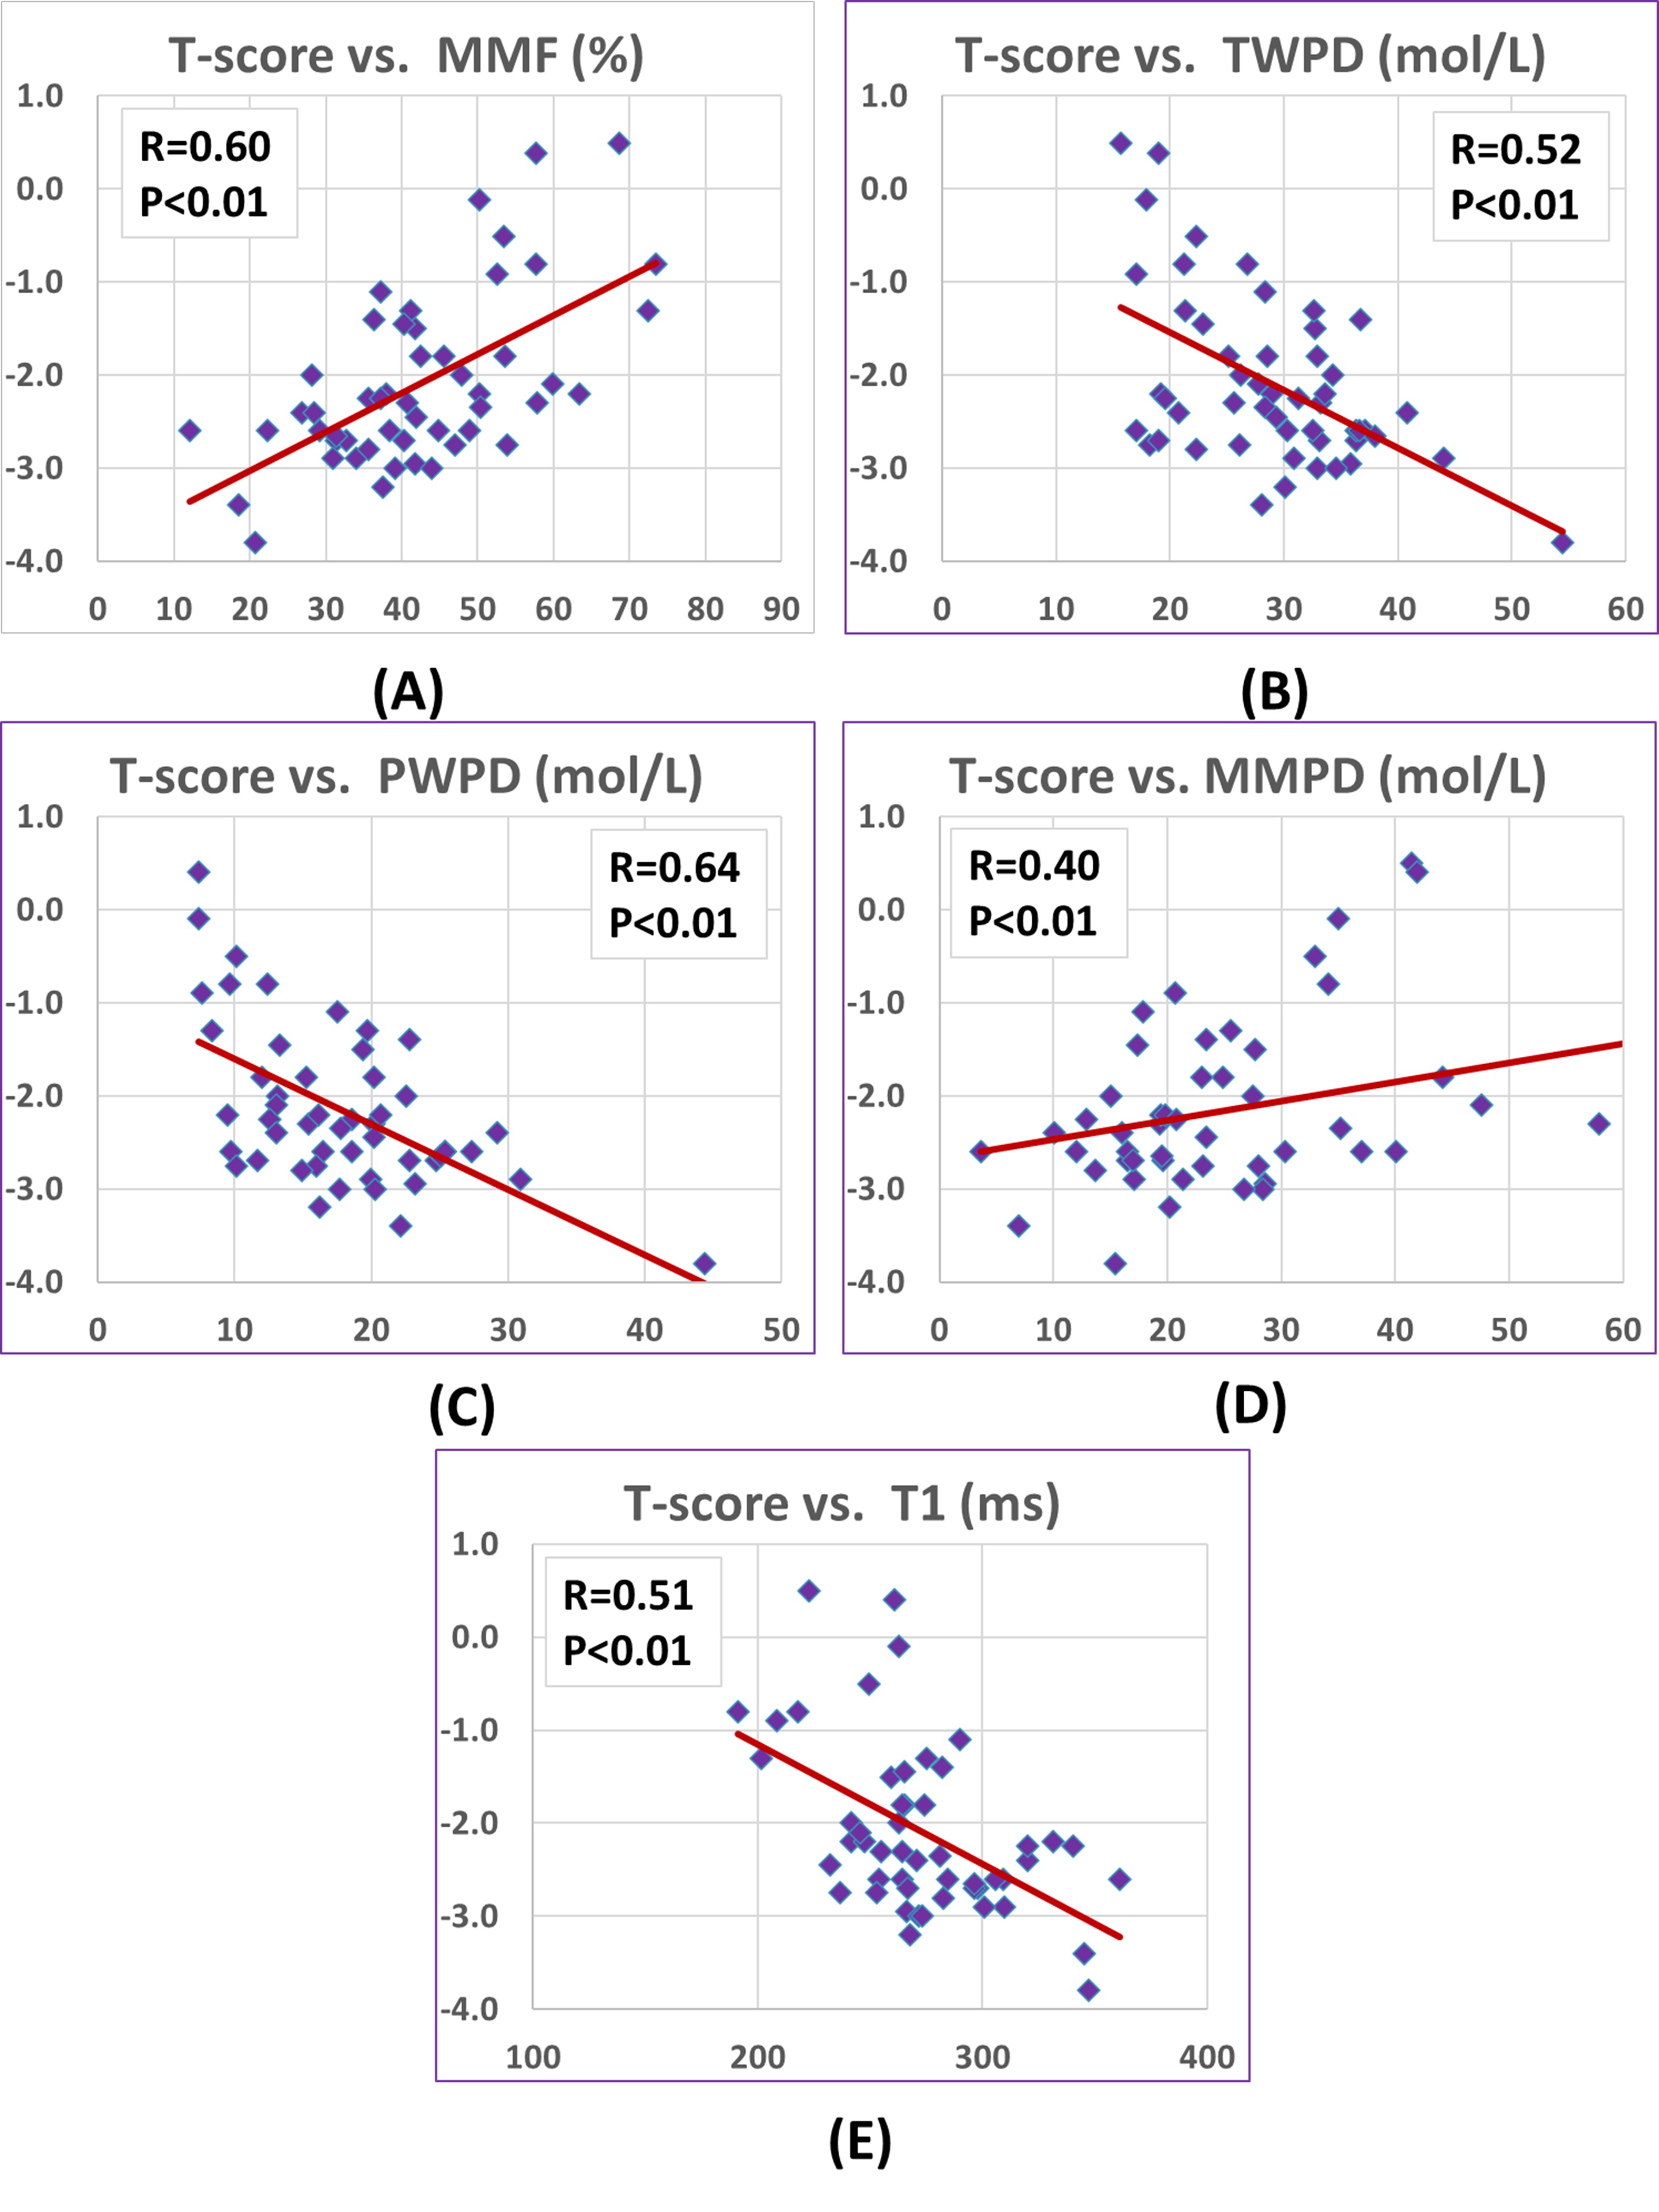
Figure 2 shows a schematic of the selected ROI in a representative lower leg UTE-MT MRI image from a 37-year-old female subject. Average UTE-MRI measures are presented in Figure 3 (Table 1) for control, OPe, and OPo cohorts. MMF and MMPD were significantly lower while T1, TWPD, and PWPD were significantly higher in the OPe cohort compared with OPe and Ctrl cohorts. Figure 4 depicts average, median, SD, first, and third quartiles of MMF, TWPD, BWPD, PWPD, MMPD, and T1 values for each cohort using whisker’s boxplots. As presented in Figure 3 (Table 2), T1, MMF, TWPD, PWPD, and MMPD showed significant correlations with T-score obtained from DEXA scans performed on the hips of patients (using 51 data points with DEXA scans; young control subjects did not have DEXA scans). Hip T-score showed highest correlation with PWPD (R=0.64) and MMF (R=0.60). Figure 5 demonstrates linear regressions of T-score on MRI results with significant correlations.DISCUSSION
UTE-MRI-based assessment of bone collagen and water content showed significant differences between OPe, OPo, and Ctrl cohorts, demonstrating the potential of the developed techniques in improving osteoporosis diagnosis. It is likely that bone deterioration will occur globally in the skeletal system as UTE-MRI bone assessment in tibial midshaft correlated significantly with hip DEXA T-score.CONCLUSION
The proposed UTE-MRI-based assessment of collagen and water contents in tibial bone was sensitive to bone loss in OPe and OPo patients compared with healthy subjects. Such MRI-based techniques may serve as novel tools to improve osteoporosis diagnosis and treatment monitoring by focusing on the organic matrix and water, both of which are inaccessible with the current gold standard, DEXA.Acknowledgements
The authors acknowledge grant support from the NIH (R01AR068987, R01AR062581, R01AR075825, R21AR075851), Veterans Affairs (I01RX002604 and I01CX001388), and GE Healthcare.References
1. Zanker J, Duque G. Osteoporosis in Older Persons: Old and New Players. J Am Geriatr Soc. 2019;67(4):831-840. doi:10.1111/jgs.15716
2. Guerri S, Mercatelli D, Gómez MPA, et al. Quantitative imaging techniques for the assessment of osteoporosis and sarcopenia. Quant Imaging Med Surg. 2018;8(1):60-85. doi:10.21037/qims.2018.01.05 3. Looker AC, Frenk SM. Percentage of Adults Aged 65 and Over With Osteoporosis or Low Bone Mass at the Femur Neck or Lumbar Spine: United States, 2005–2010. Centers Dis Control Prev. 2015;(August):2005-2010.
4. MacDonald HM, Nishiyama KK, Kang J, Hanley DA, Boyd SK. Age-related patterns of trabecular and cortical bone loss differ between sexes and skeletal sites: A population-based HR-pQCT study. J Bone Miner Res. 2011;26(1):50-62. doi:10.1002/jbmr.171
5. Lees S. A mixed packing model for bone collagen. Calcif Tissue Int. 1981;33(6):591-602. doi:10.1007/BF02409497
6. Burr DB. The contribution of the organic matrix to bone’s material properties. Bone. 2002. doi:10.1016/S8756-3282(02)00815-3
7. Trajanoska K, Schoufour JD, de Jonge EAL, et al. Fracture incidence and secular trends between 1989 and 2013 in a population based cohort: The Rotterdam Study. Bone. 2018;114(September):116-124. doi:10.1016/j.bone.2018.06.004 8. Ma Y-J, Jerban S, Jang H, Chang D, Chang EY, Du J. Quantitative Ultrashort Echo Time (UTE) Magnetic Resonance Imaging of Bone: An Update. Front Endocrinol (Lausanne). 2020;11(1):667-676. doi:10.3389/fendo.2020.567417
9. Jerban S, Ma Y, Wei Z, Jang H, Chang EY, Du J. Quantitative Magnetic Resonance Imaging of Cortical and Trabecular Bone. Semin Musculoskelet Radiol. 2020;24(4):386-401. doi:10.1055/s-0040-1710355
10. Du J, Bydder GM. Qualitative and quantitative ultrashort-TE MRI of cortical bone. NMR Biomed. 2013;26(5):489-506. doi:10.1002/nbm.2906
11. Du J, Chiang AJT, Chung CB, et al. Orientational analysis of the Achilles tendon and enthesis using an ultrashort echo time spectroscopic imaging sequence. Magn Reson Imaging. 2010;28(2):178-184. doi:10.1016/j.mri.2009.06.002
12. Ma Y, Chang EY, Carl M, Du J. Quantitative magnetization transfer ultrashort echo time imaging using a time-efficient 3D multispoke Cones sequence. Magn Reson Med. 2017;79(2):692-700. doi:10.1002/mrm.26716
13. Ma Y, Shao H, Du J, Chang EY. Ultrashort echo time magnetization transfer (UTE-MT) imaging and modeling: magic angle independent biomarkers of tissue properties. NMR Biomed. 2016;29(11):1546-1552. doi:10.1002/nbm.3609
14. Du J, Carl M, Bydder M, Takahashi A, Chung CB, Bydder GM. Qualitative and quantitative ultrashort echo time (UTE) imaging of cortical bone. J Magn Reson. 2010;207(2):304-311. doi:10.1016/j.jmr.2010.09.013
15. Ma YJ, Zhu Y, Lu X, Carl M, Chang EY, Du J. Short T 2 imaging using a 3D double adiabatic inversion recovery prepared ultrashort echo time cones (3D DIR-UTE-Cones) sequence. Magn Reson Med. 2017;00(5):1-9. doi:10.1002/mrm.26908
16. Ma Y, Lu X, Carl M, et al. Accurate T 1 mapping of short T 2 tissues using a three-dimensional ultrashort echo time cones actual flip angle imaging-variable repetition time (3D UTE-Cones AFI-VTR) method. Magn Reson Med. 2018;80(2):598-608. doi:10.1002/mrm.27066
Figures
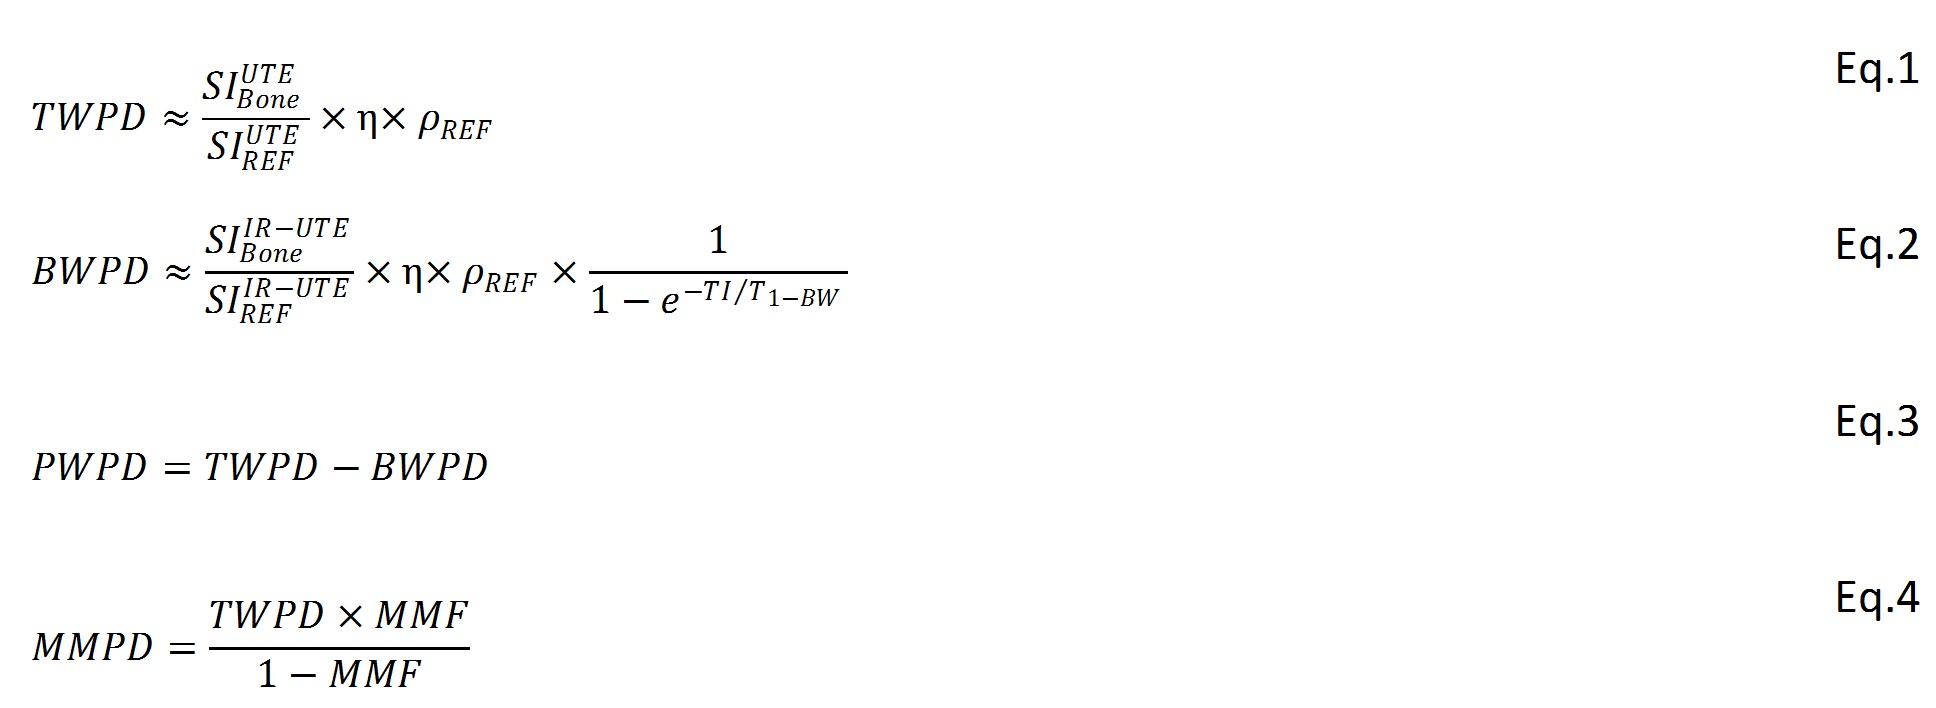
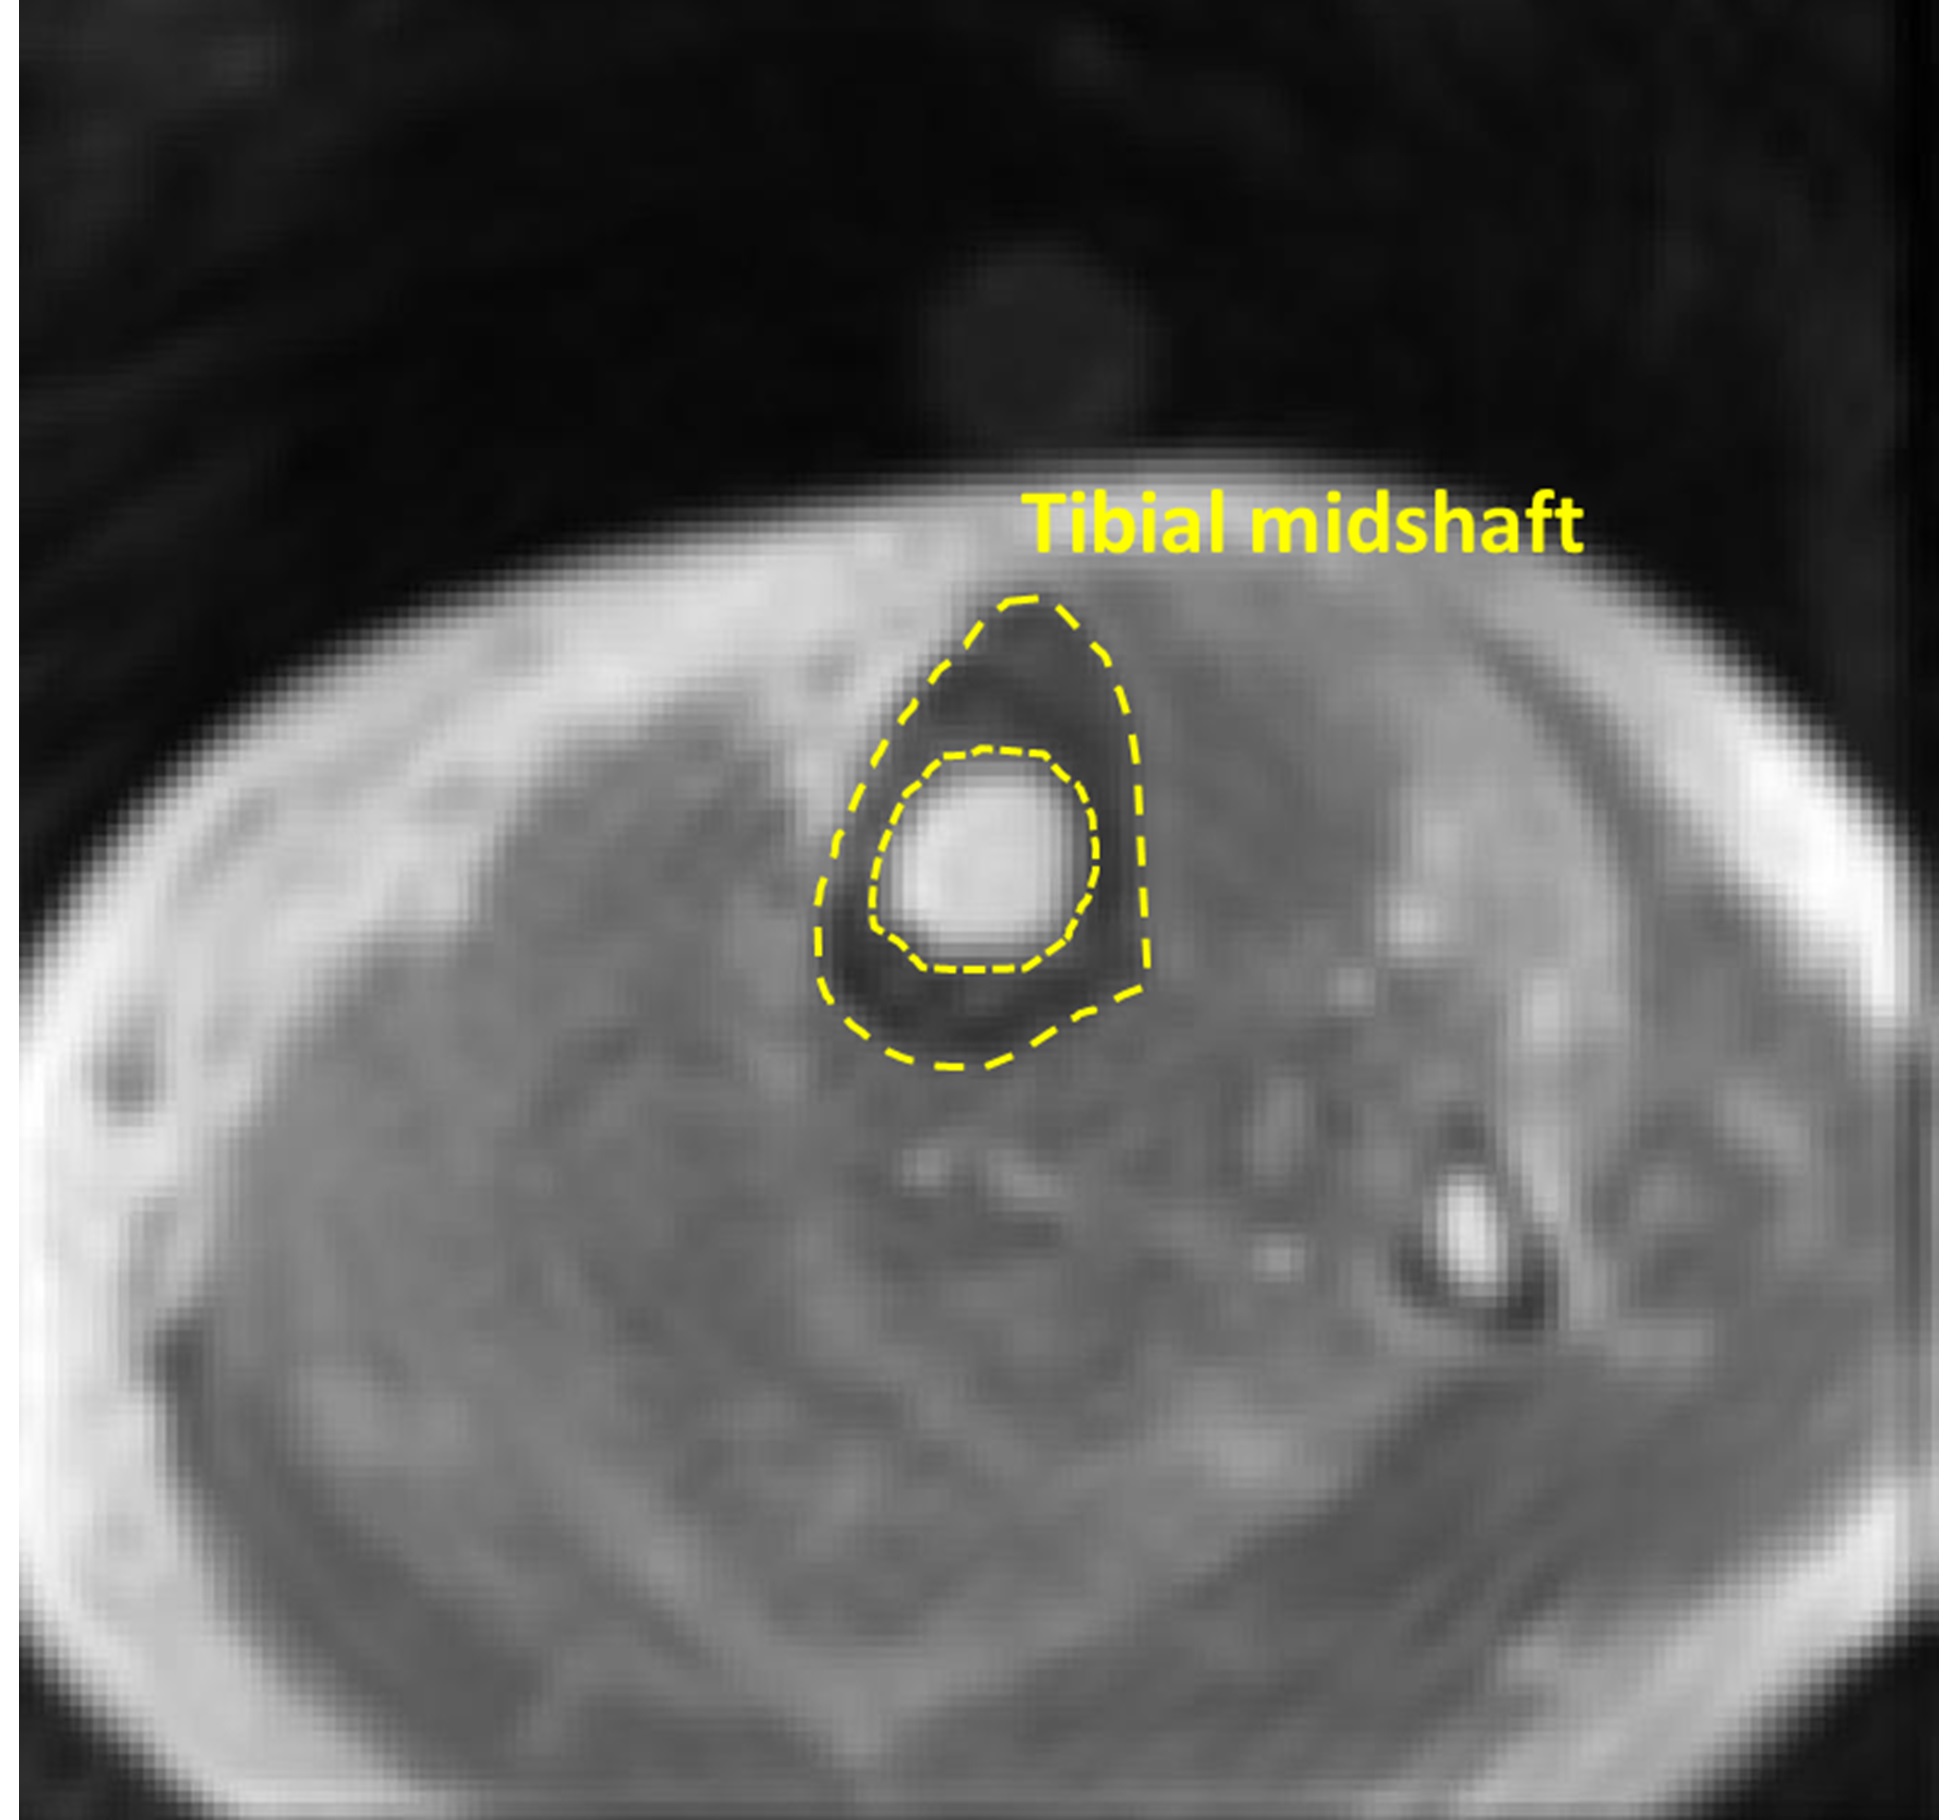
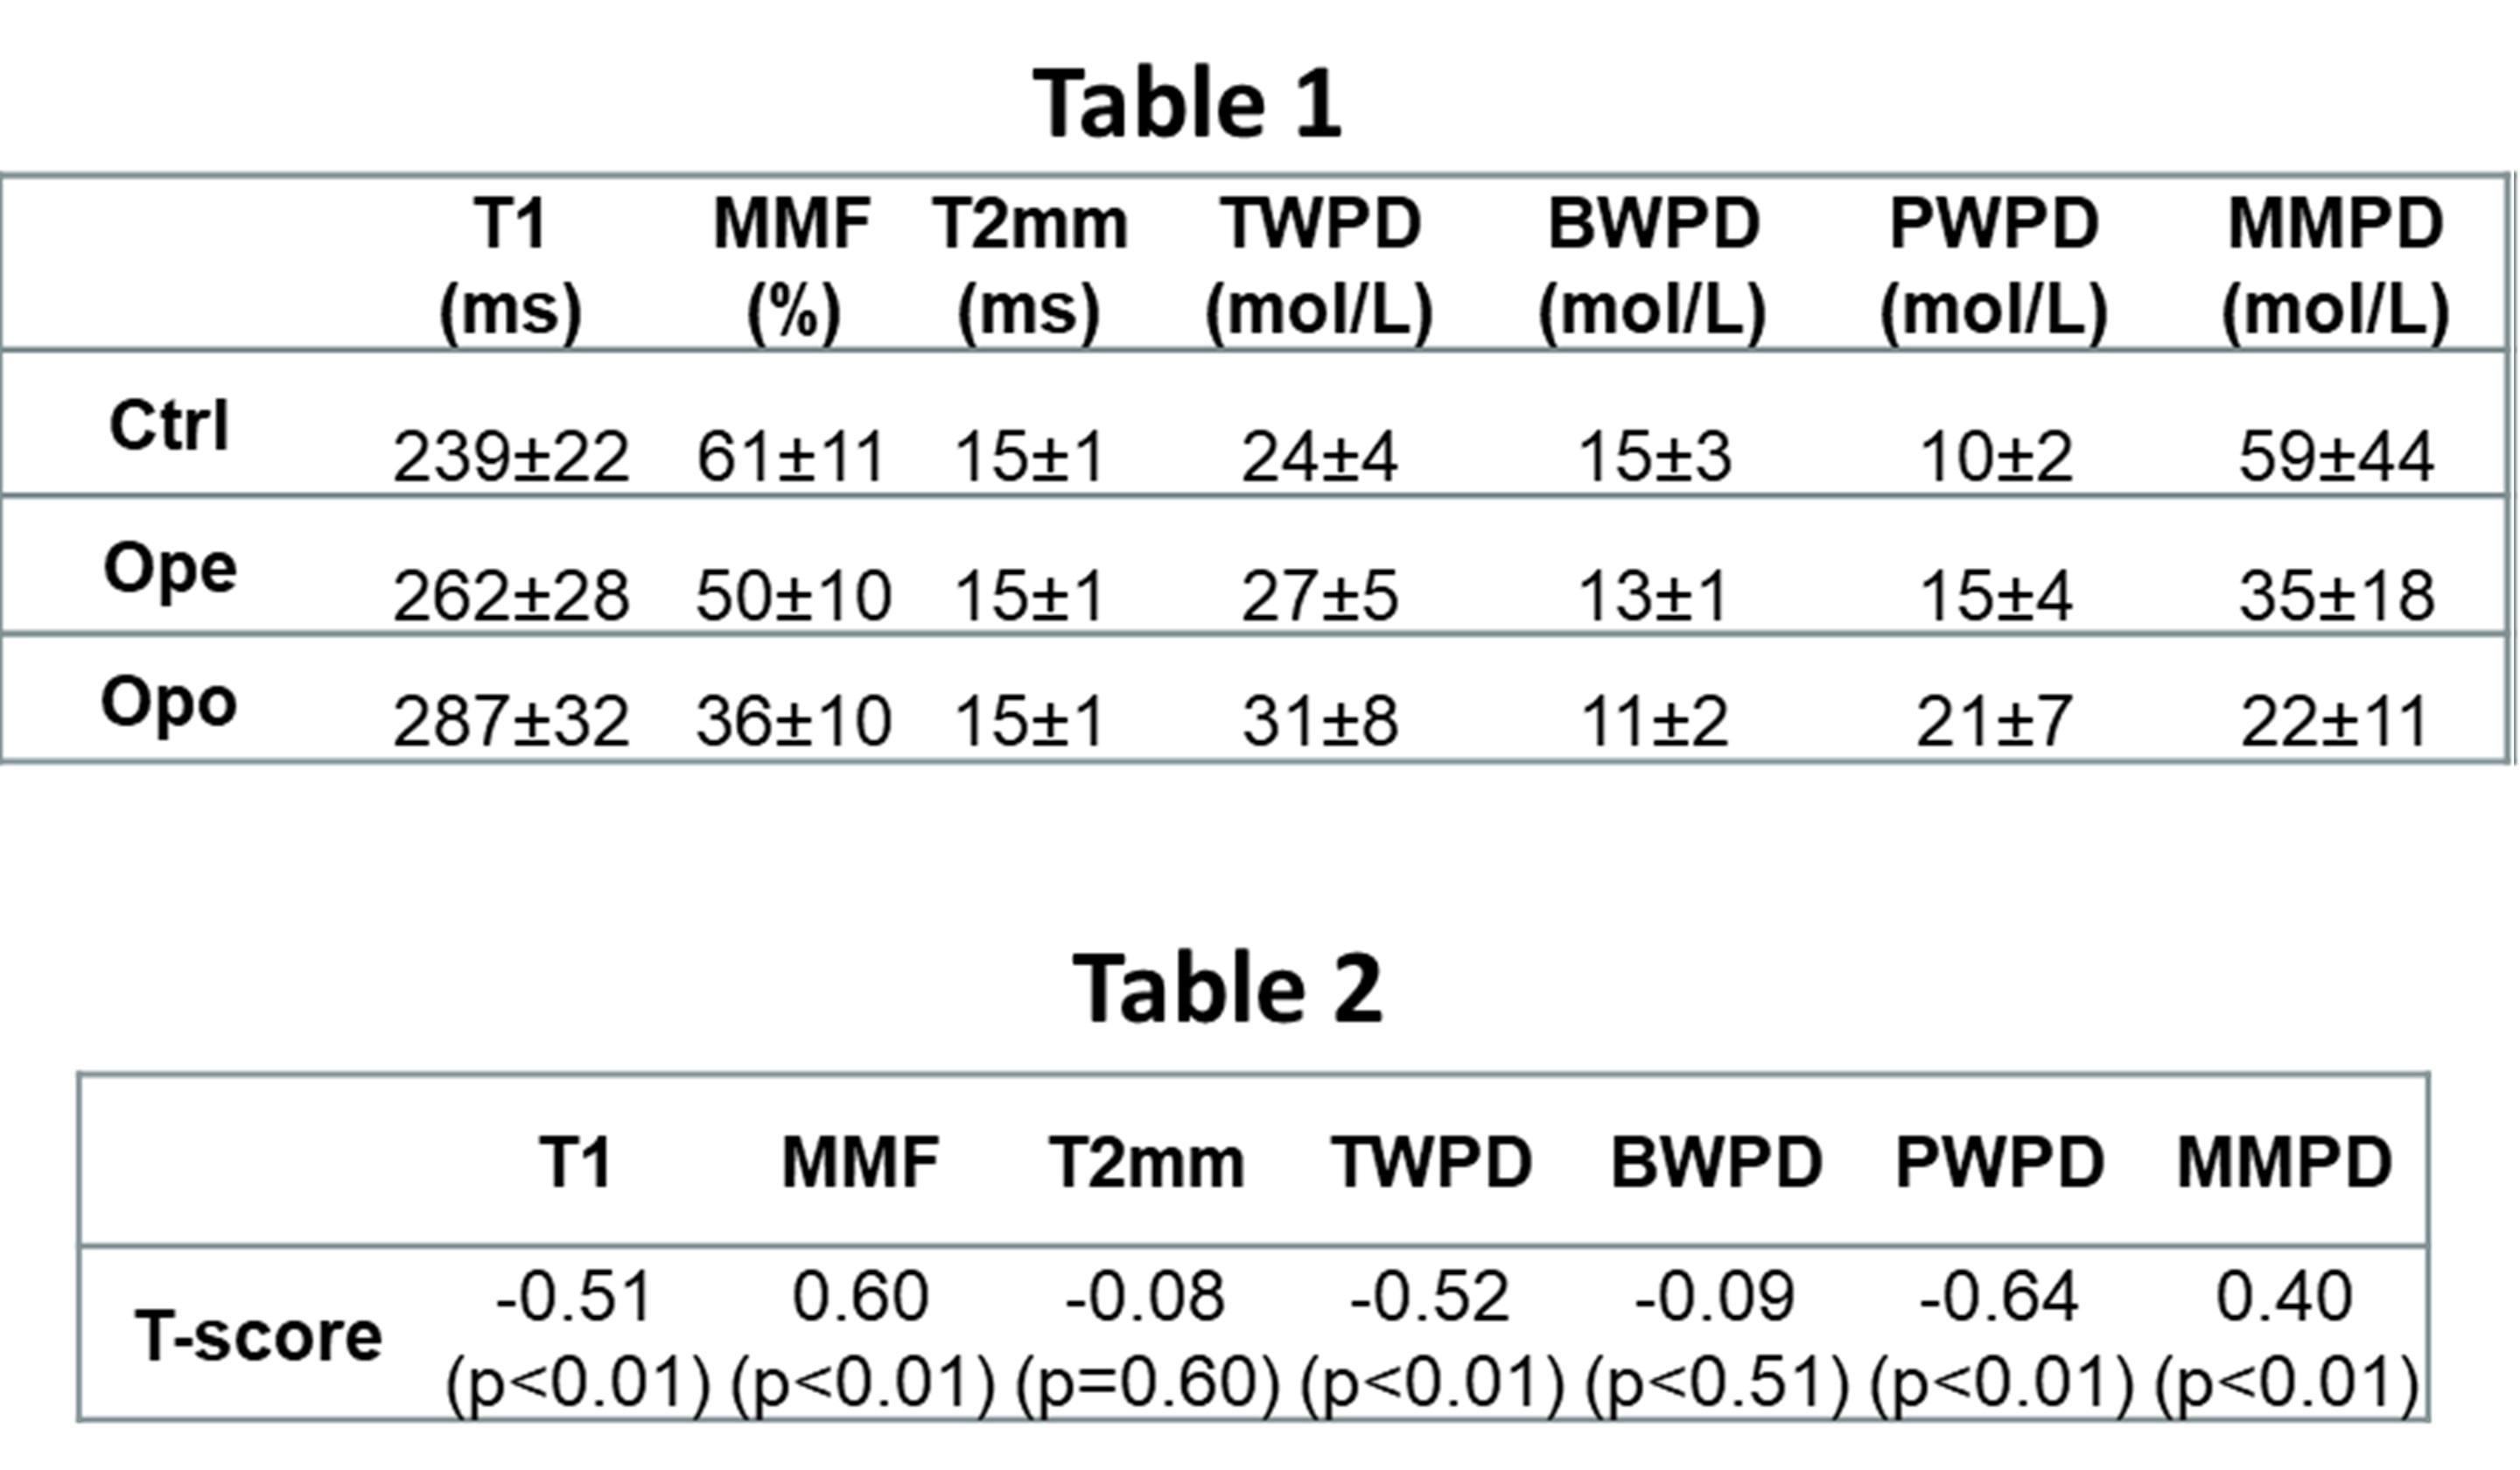
Table 1: Average and standard deviation (SD) of UTE-MRI measures for healthy control, OPe, and OPo groups.
Table 2: Pearson’s correlations of T-score from DEXA with T1, MT modeling, and proton densities obtained from UTE-MRI (we had 51 subjects with DEXA data).