4068
3T MRI Distribution of Textural Features in Bone Marrow for Osteoporosis.1Department of Radiology, NYU Langone Health, New York, NY, United States, 2Osteoporosis Center, Hospital for Joint Disease, NYU Langone Health, New York, NY, United States
Synopsis
In this preliminary study we aim to analyze the relationship of first-order textural feature of Fat, water, Fat Fraction maps, clinical features (Age, height, and weight) and BMD (Hip, Spine and Femoral Neck). Radiomic features calculated on Fat parametric maps explains variability in Bone Mineral Density to higher extend than water and fat fraction parametric maps.
Purpose
Osteoporosis is a major disease and affects 200 million people worldwide. Bone mineral density (BMD) calculated using dual-energy x-ray absorptiometry (DXA)1 is the standard-of-care method used to assess bone health and fracture risk. However, BMD has low sensitivity and cannot detect all patients with increased fracture risk for osteoporosis. To increase the accuracy of fracture prediction a clinical feature-based predictor like FRAX can be used in unison with BMD. Recent studies using the ability of MRI to separate fat and water in images have demonstrated that bone health is also dependent on bone marrow adiposity3,4. Radiomics5 provides a framework to analyze the textural information of MRI or CT images and parametric maps6.7. In this preliminary study, we aim to analyze the relationship of first-order textural feature of Fat, water, Fat Fraction maps, clinical features (age, height, and weight) and BMD (Hip, Spine and Femoral Neck).Materials/Methods
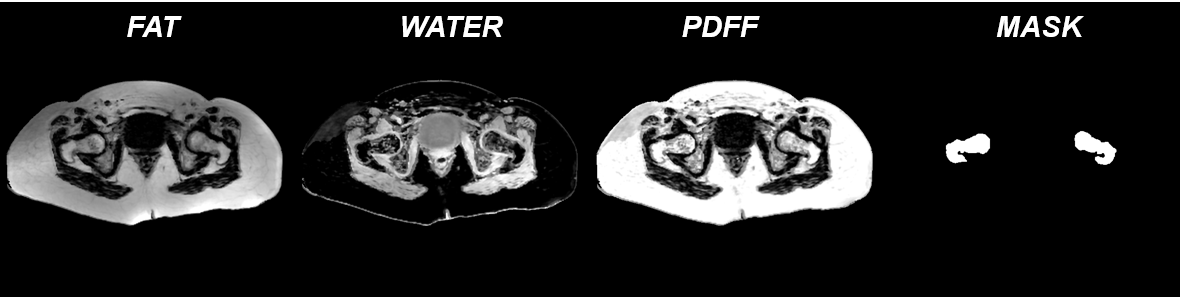
This study had institutional review board approval, and written informed consent was obtained from all subjects. MRI acquisition was performed on n= 13 subjects (females, Age: 48 +/- 11 years, BMI:24.1 +/- 4.6 kg/ ) using a 3T system (Siemens Healthcare, Erlangen, Germany). We used a 3D spoiled gradient-echo sequence with an n=6 echoes with the following parameters: TR/FA/NA = 16ms/5°/4 and BW= 1445 Hz/px; 40 axial slices were acquired; Acquisition time =3 min. The IDEAL algorithm8,9 was then used for fat/water separation using an eight peaks fat spectrum model and T2* estimation. Fat (F), and Water (W) parametric maps were then obtained, and Proton Density Fat Fraction (PDFF) was computed using the relation $$$PDFF = \frac{F}{F+W}$$$. Hip bone marrow was semi-automatically segmented based on PDFF maps thresholding.Processing
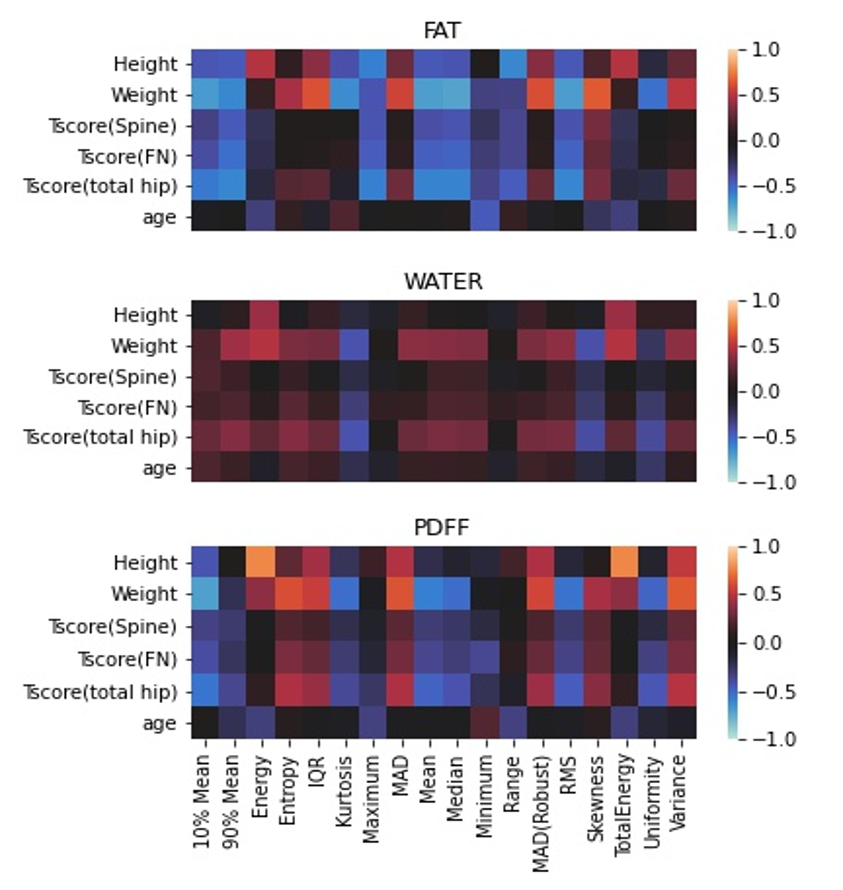
The textural features were calculated on reconstructed fat, water and PDFF maps in the bone marrow region using pyradiomics 3.0.110. Firstorder-radiomic features (mean, median, kurtosis, skewness, variance, interquartile range etc.) were used for analyzing the parametric maps. There were 17 first order radiomic features in total. In the first experiment, we analyzed the Pearson correlation between textural features and clinical features such as age, height, and weight for different parametric maps as shown in Figure 2. Additionally, we analyzed the relationship between individual features (radiomic features of fat, water and PDFF parametric maps) and BMD (T-score in Hip, Spine and Femoral Neck) using the Pearson correlation.To, further analyze relationship between the combinations of radiomic features and Bone Mineral Density we use l1-regularized linear regression (LASSO) to learn the linear mapping from radiomic features to T-score value in Hip, Spine and Femoral Neck. Coefficient of determination ($$$R^{2}$$$) is used as the scoring mechanism to evaluate variation in T-score explained by radiomic features.
Results
Figure 1 shows the fat, water, PDFF parametric maps and the Bone marrow mask over which the textural features are calculated.The Maximum value and range radiomic feature calculated on fat maps were significantly inversely correlated with height (p-value < 0.05, -0.57, -0.6 respectively). 10% mean, 90% mean, Kurtosis, Mean and Median were significantly inversely correlated with weight (p-value < 0.05, $$$r^{2}$$$ < -0.6 ). There are several more Fat radiomic features that are significantly inversely correlated to BMD T-score calculated in the hip (Mean,10 % mean,90% mean, Maximum, Median and Root Mean Square (RMS): $$$r^{2}$$$ <-0.55 with p-value < 0.05) when compared to radiomic features calculated on water and PDFF parametric maps. The radiomic features calculated on the PDFF maps were individually more related to Height and weight than BMD T-score. Total Energy was significantly correlated with height; weight was significantly correlated to Mean Absolute Deviation, Entropy, and Interquartile range (p-value < 0.05, $$$r^{2}$$$>0.55); weight was anticorrelated to 10% mean (p-value < 0.05, $$$r^{2}$$$ = -0.69); PDFF radiomic features were not significantly correlated to T-score values.
Table 2 shows that compared to PDFF and water maps, fat maps can explain the variation in T-score. Fat radiomic features could explain 52% of all variability in Total Hip T-score. The combination of features in fat, PDFF have the highest $$$R^{2}$$$ value for predicting T-score in Hip and Femoral Neck (0.74,0.72). It is in concordance with the results in Figure 2 where features calculated on water map show very less correlation to T-score values. Additionally, $$$R^{2}$$$ values are higher for LASSO models predicting T-score in femoral neck and hip rather than the spine.
Conclusion
A significant number of radiomic features calculated in fat and PDFF maps were related to Height and weight. Radiomic features in Fat maps are were more related to Bone Mineral Density and were the most important set of features in explaining the variability in T-score. For future work, more subjects need to be acquired to confirm this result.Acknowledgements
No acknowledgement found.References
1. Cummings SR, Bates D, Black DM. Clinical use of bone densitometry: scientific review [published correction appears in JAMA 2002 Dec 11;288(22):2825]. JAMA. 2002;288(15):1889-1897. doi:10.1001/jama.288.15.1889.
2. Kanis JA, McCloskey EV, Johansson H, Strom O, Borgstrom F, Oden A; National Osteoporosis Guideline Group. Case finding for the management of osteoporosis with FRAX--assessment and intervention thresholds for the UK. Osteoporos Int. 2008 Oct;19(10):1395-408. doi: 10.1007/s00198-008-0712-1. Epub 2008 Aug 28. Erratum in: Osteoporos Int. 2009 Mar;20(3):499-502. PMID: 18751937.
3. Martel D, Honig S, Monga A, Chang G. Analysis of muscle, hip, and subcutaneous fat in osteoporosis patients with varying degrees of fracture risk using 3T Chemical Shift Encoded MRI. Bone Rep. 2020;12:100259. Published 2020 Mar 24. doi:10.1016/j.bonr.2020.100259.
4. Patsch JM, Li X, Baum T, et al. Bone marrow fat composition as a novel imaging biomarker in postmenopausal women with prevalent fragility fractures. J Bone Miner Res. 2013;28(8):1721-1728. doi:10.1002/jbmr.1950.
5. Rizzo S, Botta F, Raimondi S, et al. Radiomics: the facts and the challenges of image analysis. Eur Radiol Exp. 2018;2(1):36. Published 2018 Nov 14. doi:10.1186/s41747-018-0068-z.
6. Dieckmeyer M, Junker D, Ruschke S, et al. Vertebral Bone Marrow Heterogeneity Using Texture Analysis of Chemical Shift Encoding-Based MRI: Variations in Age, Sex, and Anatomical Location. Front Endocrinol (Lausanne). 2020;11:555931. Published 2020 Oct 15. doi:10.3389/fendo.2020.555931.
7. Burian E, Subburaj K, Mookiah MRK, et al. Texture analysis of vertebral bone marrow using chemical shift encoding-based water-fat MRI: a feasibility study. Osteoporos Int. 2019;30(6):1265-1274. doi:10.1007/s00198-019-04924-9.
8. Reeder SB, Pineda AR, Wen Z, et al. Iterative decomposition of water and fat with echo asymmetry and least-squares estimation (IDEAL): application with fast spin-echo imaging. Magn Reson Med. 2005;54(3):636-644. doi:10.1002/mrm.20624.
9. Hu HH, Börnert P, Hernando D, et al. ISMRM workshop on fat-water separation: insights, applications and progress in MRI. Magn Reson Med. 2012;68(2):378-388. doi:10.1002/mrm.24369.
10. van Griethuysen JJM, Fedorov A, Parmar C, et al. Computational Radiomics System to Decode the Radiographic Phenotype. Cancer Res. 2017;77(21):e104-e107. doi:10.1158/0008-5472.CAN-17-0339.
Figures