4064
Feasibility of Femoral Cartilage Lesion Classification on Clinical MRIs using Deep Learning1Cleveland Clinic, Cleveland, OH, United States
Synopsis
Early diagnosis and effective detection of cartilage degeneration is an important factor for osteoarthritis prevention and treatment, which are still challenging in routine clinical practice, resulting in poor patient treatment and management plans. The purpose of this study is to assess the feasibility of building an automatic femoral cartilage lesion classification pipeline for heterogenous clinical routine MR scans by combining deep learning segmentation and classification models together.
INTRODUCTION
Knee pain is one of the major causes of disability affecting approximately half of the population over the age of 50; 20% of patients reported severe disability as a result. Osteoarthritis (OA) is one of the most important factors of causing knee pain. The annual treatment cost of OA is more than $51 billion in the United States alone. Early detection osteoarthritis is important to prevent the disease progress and provide effective interventions and treatments. Cartilage degeneration is one of the hallmarks of OA development. However, early diagnosis and effective detection of cartilage degeneration are still challenging in routine clinical practice, resulting in poor patient treatment and management plans. Research has been conducted for femoral and tibial cartilage lesion detection 1 and patellar cartilage and meniscus staging 2. Some of these works, however, was conducted in a research environment, which is not feasible for clinical deployment. The purpose of this study is to assess the feasibility of building an automatic femoral cartilage lesion classification pipeline into clinical routine for heterogenous clinical MR scans by combining deep learning segmentation and classification models together.METHODS
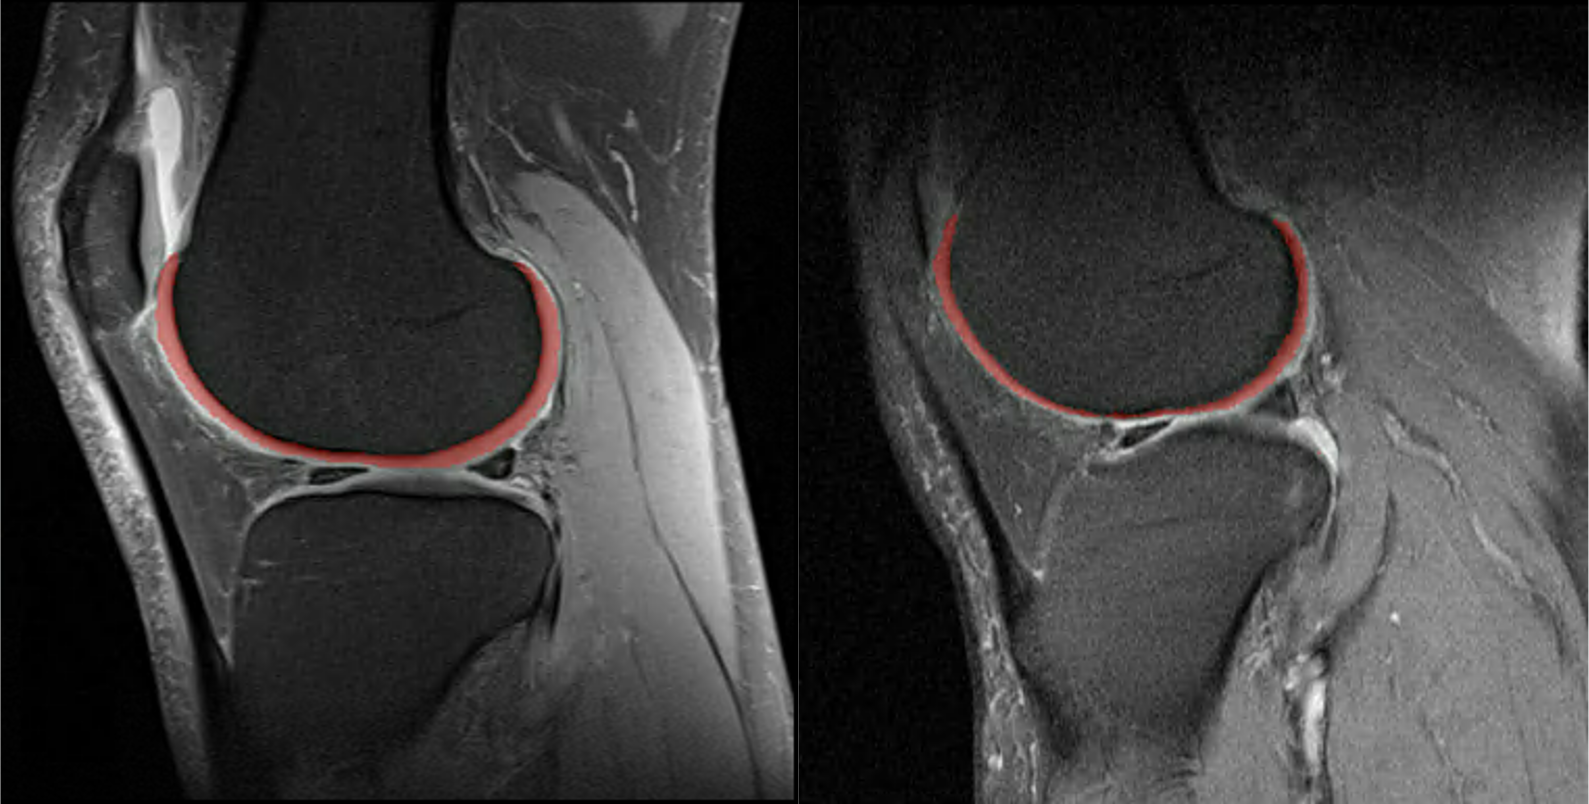
The clinical knee MR images used in this study were from the arthroscopic partial meniscectomy (APM) sub-cohort of the Cleveland Clinic Orthopaedic Outcomes (OME) cohort, a prospective orthopaedic surgical cohort within the Cleveland Clinic health care system. The MR images prior to the surgery were collected with various 2D/3D sequences on 10 difference scanner models (1.5T/3T) from 18 different locations, and graded by staff radiologists into 5 groups (normal, grade 1-4) in clinical routine. The images were first automatically segmented before classification for lesions. The automatic segmentation model based on the conditional generative adversarial networks and the UNet was pretrained on the OAI DESS images 3 and fine-tuned on 25 sets of MR images from the APM sub-cohort. A total of 35,427 femoral cartilage segmented sagittal fat-saturated proton density weighted MR slices from 1692 unique APM patients with a mean age of 57.9 years old (SD: 8.0) were labeled into two classes (0: normal and grade 1; 1: grade 2 and above). The segmented slices were divided into 3:1:1 ratio for training, validating, and testing the classification model. The architecture of the deep learning classification model was based on the VGG16 network with weights pre-trained on ImageNet. The output layer of VGG16 was replaced by a global average pooling layer followed by a fully connected layer of size 512 equipped with a rectified linear unit, and an output layer with the sigmoid activation function. The binary cross entropy was used as the training loss. The ADAM optimizer was used for model training with a learning rate of 3e-4. The batch size was set to 32. The model was trained for 100 epochs. Accuracy and ROC-AUC were utilized to evaluate the classification model performance.RESULTS
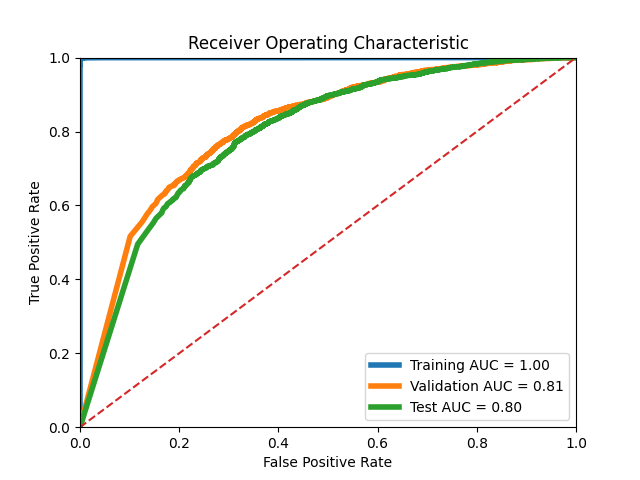
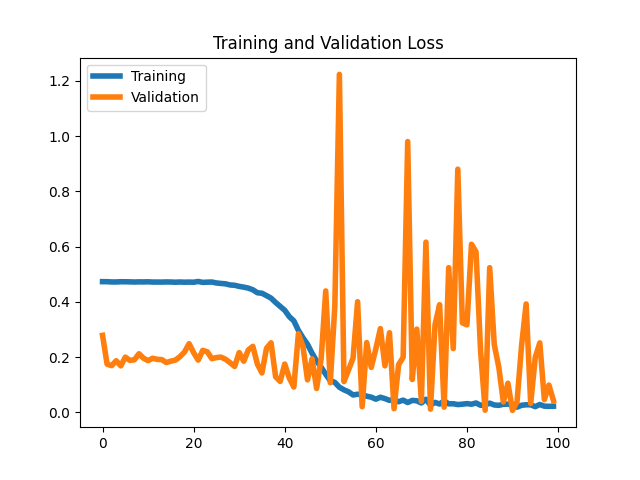
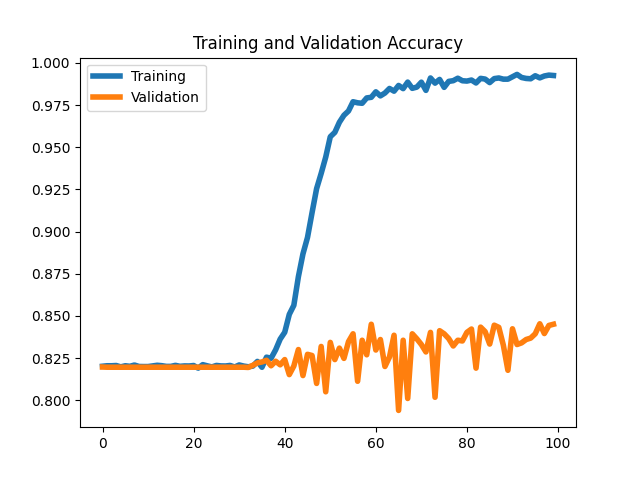
Sample segmented MR images from the two groups as input to the classification model were shown in Figure 1. The segmentation model achieved an overall averaged Dice score of 0.819 (± 0.039), an averaged 95 percentile Hausdorff distance of 1.463 (± 0.827) mm, and an averaged average symmetric surface distance of 0.350 (± 0.114) mm. The cartilage lesion classification model achieved accuracy and ROC-AUC of 0.99 and 1.00 for the training set, 0.85 and 0.81 for the validation set, 0.842 and 0.80 for the test set, respectively. The ROC curves were plotted in Figure 2. The training and validation loss and accuracy per number of epochs were shown in Figure 3 and Figure 4 respectively.DISCUSSION
The results showed reasonable performance of transferring VGG16 model for femoral cartilage lesion classification with the aid of the automatic segmentation model. The model, however, clearly suffers from overfitting as shown in Figure 3 and Figure 4. Methods such as data augmentation, early stopping, and using dropout layers should help reduce the overfitting problem and further improve the model performance. Utilizing patient demographics information and other clinical variables could also help improving the classification performance.CONCLUSION
We have shown in this study a promising pipeline for femoral cartilage lesion classification in heterogeneous clinical MR images by combining deep learning segmentation and classification models together. It can provide aids to clinical routines for improved patient treatment and management plans.Acknowledgements
This study was supported by NIH/NIAMS R01 AR075422.References
1. Liu, F., et al., Deep Learning Approach for Evaluating Knee MR Images: Achieving High Diagnostic Performance for Cartilage Lesion Detection. Radiology, 2018. 289(1): p. 160-169.
2. Pedoia, V., et al., 3D convolutional neural networks for detection and severity staging of meniscus and PFJ cartilage morphological degenerative changes in osteoarthritis and anterior cruciate ligament subjects. J Magn Reson Imaging, 2019. 49(2): p. 400-410.
3. Gaj, S., et al., Automated cartilage and meniscus segmentation of knee MRI with conditional generative adversarial networks. Magn Reson Med, 2019.
Figures