4060
A pipeline combining deep learning and radiomics to automatically identify chronic lateral ankle instability from FS-PD MRI1Shanghai Key Laboratory of Magnetic Resonance, East China Normal University, shanghai, China, 2Department of Radiology, Huashan Hospital, Fudan University, shanghai, China
Synopsis
The naked eye can only recognize the morphological changes of cartilage and subchondral bone on conventional MRI, but cannot recognize the subtle changes in their internal structure. The aim is to use radiomics to evaluate the cartilage and subchondral bone changes in patients with chronical ankle joint instability (CAI) on conventional MRI images1. We built a pipeline to automatically identify CAI from FS-PD images. The pipeline automatically segmented cartilage regions and subchondral bone (5mm) regions, then used SVM based on radiomics features extracted from these regions for classification. In the test dataset, the proposed model achieved an AUC of 0.965.
Background
Chronic lateral ankle instability (CAI) keeps the hindfoot joint in a state of abnormal stress for a long time, which causes the ankle and subtalar articular cartilage to degenerate and damage, and accelerates the occurrence of osteoarthritis2. Cartilage damage and collapse caused by abnormal stress will affect the subchondral bone. Therefore, detecting the potential cartilage degeneration and subchondral bone changes in the ankle joint instability is helpful for clinical evaluation and interference with ankle joint instability3.Methods
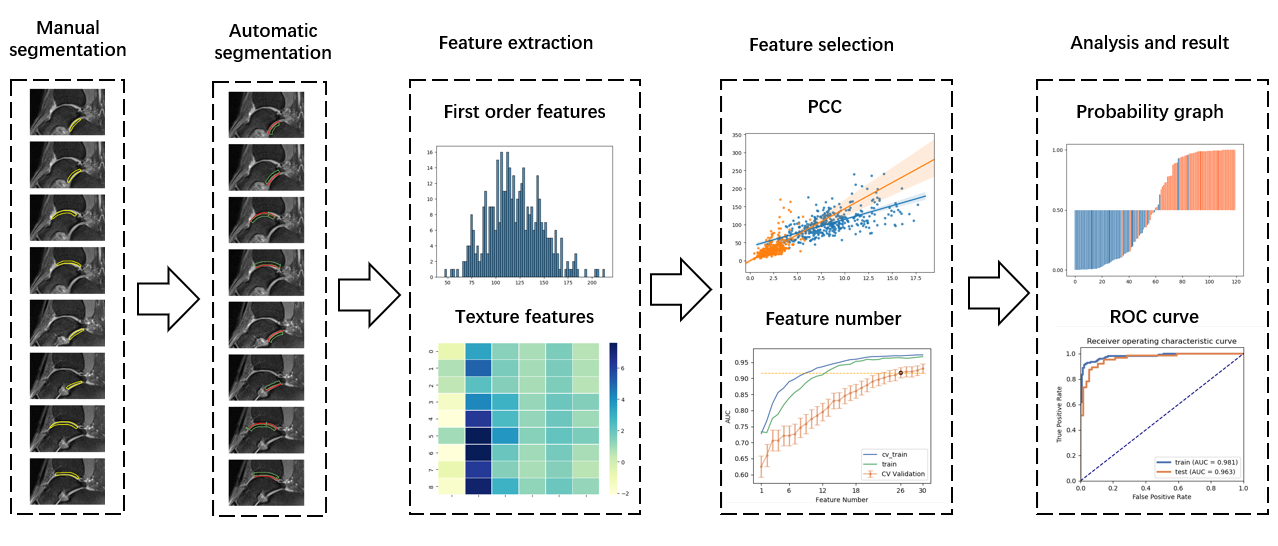
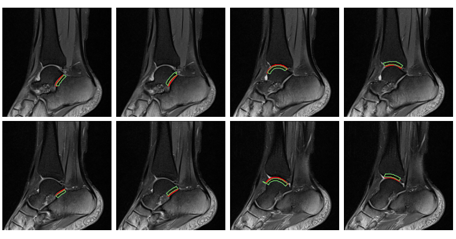
We retrospectively collected 401 fat-suppressed Proton Density MRI cases (215 CAI, 186 normal control, NC) from Huashan Hospital of Fudan University. We randomly split the dataset into training (151CAI/130NC) and testing dataset (64CAI/56NC). Two experienced radiologists manually outlined the 8 cartilage regions in each case. The flowchart of whole pipeline was shown in Figure 1. Firstly, a model based on attention U-net was trained using the labeled regions of interest (ROIs) to automatically segment eight cartilage ROIs simultaneously. Then 8 subchondral bone 5mm ROIs corresponding to these cartilage regions were calculated geometrically from the results of automated segmentation. A typical case with all segmented ROIs was shown Figure 2. For each cartilage region, radiomics model was built to classify CAI and NC. The selected features from these models were concatenated to build a combined model for cartilage regions. The same was done for the eight corresponding subchondral bone regions. We concatenated retained features in the two combined models again to build the final classification model. To build a radiomics model for an ROI, Firstly, we used Pyradiomics to extract first-order and texture features from the ROI in the original image, wavelet, and the LoG filtered image. Altogether 1116 features were extracted from each ROI. The features were normalized by subtracting mean and divided by range. The training dataset was balanced with SMOTE4. Then, Pearson Correlation Coefficient (PCC) was used to remove redundant features and RFE was used to select features with 5-fold cross validation in the training dataset. Finally, a supported vector machine (SVM) model was built with the selected features. All of the above processes were implemented using an open-source software FeatureExplorer5.RESULTS
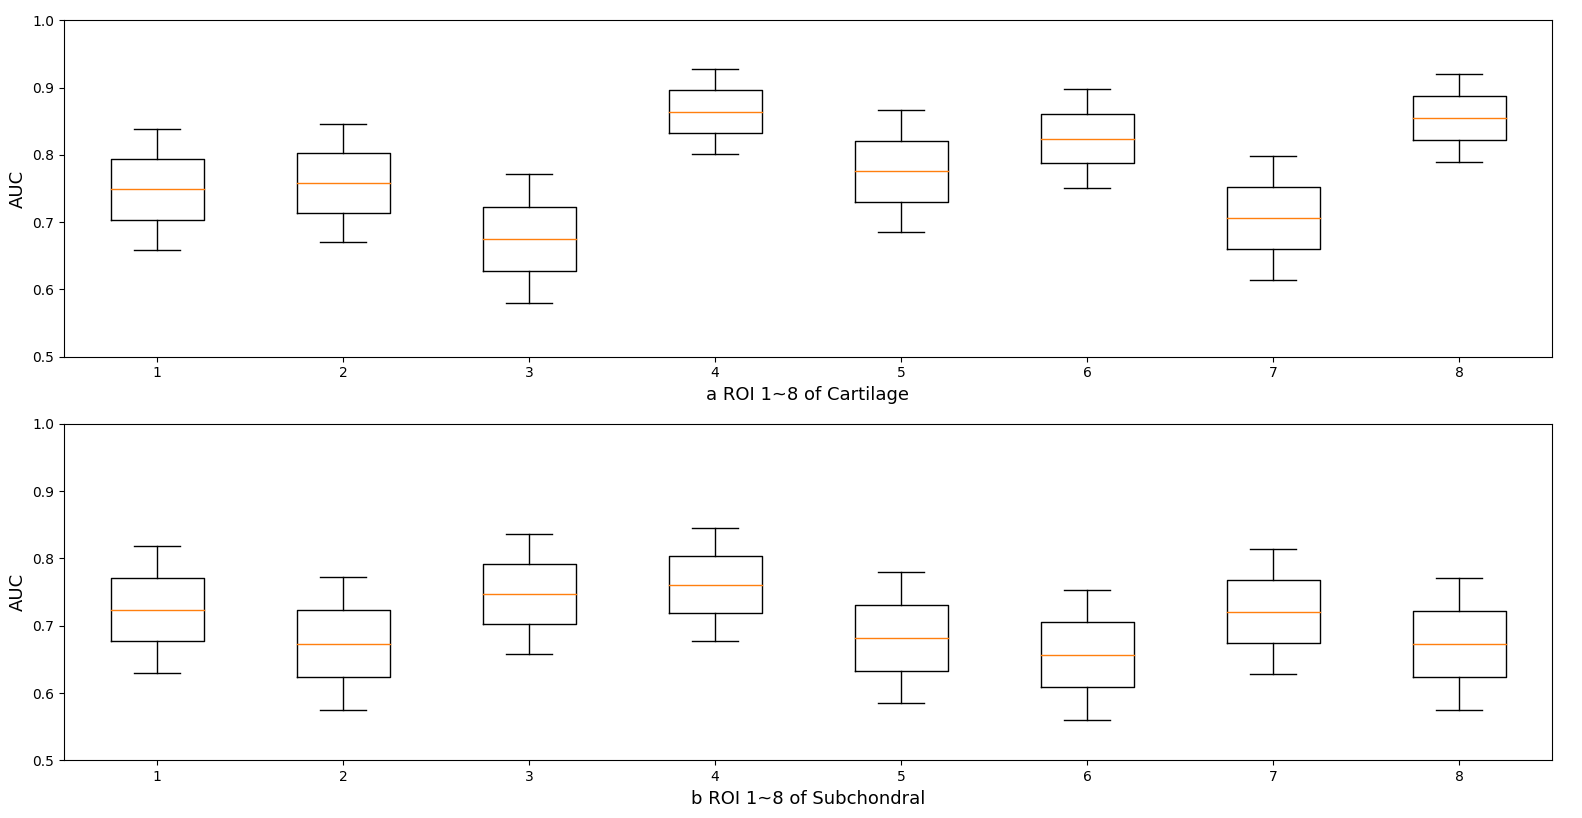
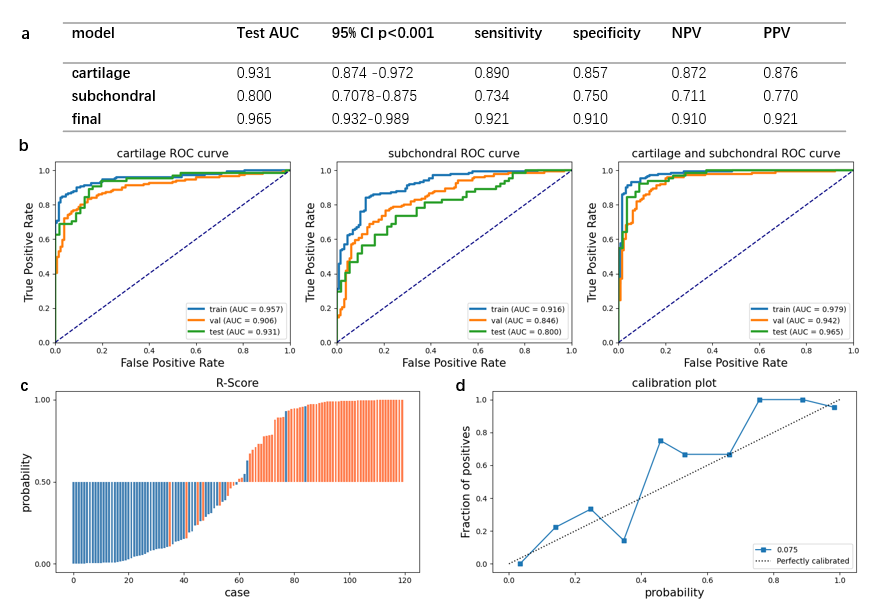
In the testing dataset, we used receiver operating characteristic (ROC) curves of the three combined models, the rad score and calibration curve to evaluate the performance of the model. The area under the ROC curve (AUC) of model for each cartilage region was in the range of [0.705, 0.864], as shown in Fig. 3a. The AUC for each subchondral bone region was in the range of [0.659, 0.761], shown in Fig. 3b. The classification results of models used all cartilage regions and all subchondral bone ROIs were shown in Fig. 4a. The final model achieved the highest AUC of 0.965 (95%CI: 0.932-0.989, p<0.001), and a sensitivity of 0.921, a specificity of 0.910, a negative predictive value (NPV) of 0.910, and a positive predictive value (PPV) of 0.921.DISCUSSION
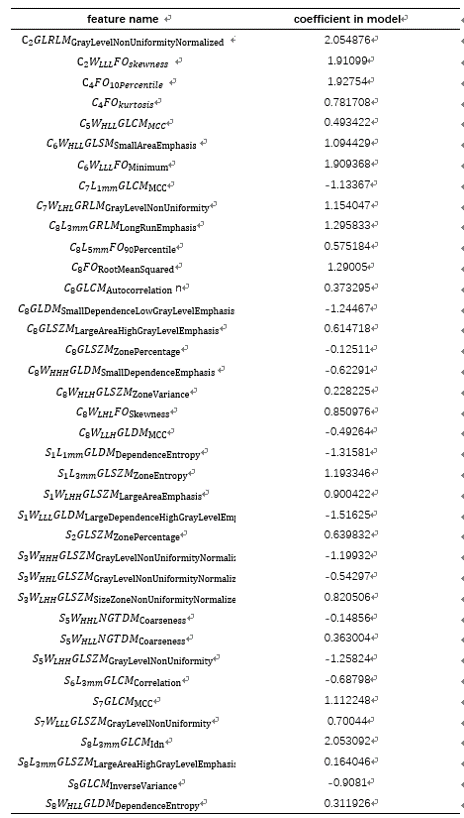
In this study, the combined model for cartilage and subchondral bone regions both achieved accurate prediction performance and the results showed that CAI is not only related to the cartilage regions, but also related to subchondral bone 5mm regions. This implies the change in the internal structure of subchondral bone may be associated with the CAI. The final model achieved an AUC of 0.965, indicating the proposed pipeline can be used to precisely differentiate CAI from NC from FS-PD MRI images. This is also demonstrated in the radiomics score plot and the calibration plot in Figure 4. The selected features and their corresponding coefficients in the final model were listed in Table 1. It can be seen that FO10percentile, GLRLMGrayLevelNonUniformityNormalize, GLRLM GrayLeveINonUniformityNormalize features contribute the most to the model, indicating the change of proton density and the uniformity of the proton distribution may be associated with CAI. Finally, clinicians should focus on and intervene the regions of lateral talus surface of the cartilage subtalar joint and the lateral talus surface of the subchondral bone 5mm subtalar joint which were most different between CAI and NC. A primary limitation of this study lies in that the final model contains more than 30 features, which makes the model difficult to interpret. We will try to simplify the model in a meaningful way to see whether it can tell us more about the changes of the internal structures in cartilages and subchondral bones in CAI patients.CONCLUSION
In summary, CAI was related to cartilage and subchondral bone regions. A fully automatic pipeline that used features from both these regions can effectively help radiologists to identify CAI from NC from FS-PD MRI images.Acknowledgements
No acknowledgement found.References
1. Hongyue Tao, Yiwen Hu, Yang Qiao, et al. T2-Mapping Evaluation of Early Cartilage Alteration of Talus for Chronic Lateral Ankle Instability With Isolated Anterior Talofibular Ligament Tear or Combined With Calcaneofibular Ligament Tear. J. MAGN. RESON. IMAGING, 2018, (47)69-77.
2. Hongyue Tao, Yiwen Hu, Rong Lu et al. Impact of Chronic Lateral Ankle Instability with Lateral Collateral Ligament Injuries on Biochemical Alterations in the Cartilage of the Subtalar and Midtarsal Joints Based on MRI T2 Mapping. Musculoskeletal Imaging, 2020, eISSN2005-8330.
3. Salvatore Gitto, Renato Cuocolo, Domenico Albanoc, et al. MRI radiomics-based machine-learning classification of bone chondrosarcoma. European Journal of Radiology, 2020, (128)109043.
4. X.W.Liang, A.P.Jiang, T. Li, et al. LR-SMOTE-An improved unbalanced data set oversampling based on K-means and SVM. Knowledge-Based Systems, 2020, (196)105845.
5. Yang Song, Jing Zhang, Yu-dong Zhang, et al. FeAture Explorer (FAE): A tool of Model Development for Radiomics. Plos One, 2020, 15(8): e0237587.
Figures