4059
Towards Clinical Translation of Fully Automatic Segmentation and 3D Biomarker Extraction of Lumbar Spine MRI1Center for Intelligent Imaging, University of California, San Francisco, San Francisco, CA, United States
Synopsis
Lumbar spine segmentation serves as an important first step for automated disease classification and monitoring, but manual segmentation is costly and time consuming. We present a deep learning-based pipeline to automatically segment the vertebral bodies, intervertebral discs, and paraspinal muscles in the lumbar spine. We leverage the results of this method to quickly and accurately extract disc height with a mean absolute error of 2.09 mm, muscle CSA with mean absolute errors of less than 1.46 cm2, and muscle centroid position with a mean absolute error of less than 7.23mm.
Introduction
Manual segmentation of the vertebral bodies, intervertebral discs, and paraspinal muscles in the lumbar spine from magnetic resonance (MR) imaging is clinically valuable, but time consuming, complex, and subject to inter-reader variability. Deep learning models often require curated research datasets, high resolution, special contrast or ad-hoc MRI sequences, making generalization poor. We present a generalizable deep learning-based framework learned on standard clinical protocols to automatically segment these three anatomic structures and extract biomarkers including intervertebral disc height, muscle cross-sectional area and centroid position across fields of view.Methods
Three convolutional neural networks were trained to segment vertebral bodies (VBs), intervertebral discs, and paraspinal muscles in the lumbar spine using annotations from three technicians trained by a board-certified radiologist. 22/27/45 (VB/Disc/Muscle) lumbar spine MRIs were randomly selected from clinically acquired scans in our institution between 2008 and 2018 after excluding cases with fractures, extensive hardware, primary tumors, and wide-spread metastatic disease to the spine. Separate 2D V-Nets1 were trained to segment VBs and discs from sagittal T1-weighted MR volumes and muscles (multifidus, psoas, quadratus lumborum [QL], and erector spinae [ES]) from axial T1-weighted MRIs. A shared test set of 8 MR examinations was constructed to evaluate implemented networks. Each network was trained on a set of 10/13/20 exams and validated on a set of 4/6/17 MR volumes. Network hyperparameters were set with batch size of 8/8/3, dropout rate of 0.05/0.2/0.2, learning rate of 1e-4, Adam optimization, and Dice loss function. The networks trained for 11900/17500/12000 iterations, respectively.We leveraged this framework to automatically extract three clinically relevant biomarkers: intervertebral disc height, muscle cross-sectional area (CSA), and centroids for each anatomical structure. To construct disc height, we calculated a 3-dimensional centroid on both ground truth and inference for each segmented disc, then computed a minimum bounding rectangle to extract a final height. Muscle CSA was constructed by computing the sum of foreground pixels for each muscle then multiplying by pixel spacing to yield area in patient-based dimensions. We computed a center of mass to identify 3D centroids on each VB and disc and 2D centroids on each muscle slice, then converted each centroid to the DICOM patient-based coordinate system, yielding a 3D atlas of the lumbar spine.
Results
Dice coefficients for the VB and disc networks were 0.856 and 0.757, and 0.812/0.870/0.785/0.882 (multifidus, psoas, QL, ES) for the muscle segmentation network on the test set. Example segmentation results are depicted in Figure 1. Inferred disc height, muscle CSA and centroid positions had mean absolute errors of 2.09 mm, 1.08/1.08/0.88/1.46 cm2, and 3.03/3.64/7.23/3.58 mm, respectively. Visualizations of correlation and agreement between inferred and ground truth estimates for disc height and muscle CSA are seen in Figures 2 and 3, and error in muscle centroids on a per-slice basis is shown in Figure 4. Please note, manual annotations were not made on all slices, so gaps in estimates in Figure 4 may reflect data availability rather than error trend. Examples of VB and disc centroids from sagittal volumes and muscle centroids from axial slices in patient-based coordinates can also be seen in Figure 4.Discussion
All networks were trained and tested on clinical exams, suggesting strong generalizability. Network performance was limited by data availability, as we reserved additional exams to test biomarker extraction from inferred segmentations. Dice coefficients improve across all networks when the proportion of training and validation exams increase.The VB and disc networks exhibit a bias toward accurately extracting additional foreground outside the desired field of coverage. The disc model shows an additional bias toward partially segmenting the uppermost visible disc, whether or not it is in the desired field of coverage (see Figure 2). Inference accuracy on the muscle network was weaker in examinations with severe muscular atrophy. Evidence of this bias is shown in Figure 4 where the most inferior slices tend to have fewer errors visualized than the most superior, indicating the model may have failed to segment some muscles entirely. This is consistent with the pattern with which muscular atrophy appeared in training exams; inferior slices tend to display more atrophied tissue and less healthy muscle tissue, which makes demarcation of muscle boundaries more difficult for both human and machine readers. An advantage of using this automatic pipeline to segment exams with high levels of muscular atrophy is that results will not be subject to inter-reader variability, as would be the case with human readers.
Intervertebral disc height and muscle CSA are associated with spine degeneration, and 2D/3D centroids form a valuable set of inputs for biomechanical modeling. Disc height, muscle CSA and 3D centroid placement all showed high agreement and minimal error between ground truth and inference, as seen in Figures 2, 3, and 4.
Conclusion
We present a fully automatic pipeline to segment major anatomical structures in the lumbar spine and demonstrate its value in calculating biomarkers of spine degeneration. This pipeline could greatly reduce the time and costs associated with development of biomechanical models, improve understanding of spine mechanics and diseases, and serve as a first step to advanced clinical analysis of lumbar disease.Acknowledgements
We would like to thank the National Institute of Health and National Institute of Arthritis and Musculoskeletal and Skin Diseases for supporting this work with the NIH/NIAMS UH2AR076724 grant.References
- Milletari, Fausto, et al. “V-Net: Fully Convolutional Neural Networks for Volumetric Medical Image Segmentation.” ArXiv:1606.04797 [Cs], June 2016. arXiv.org, http://arxiv.org/abs/1606.04797
Figures
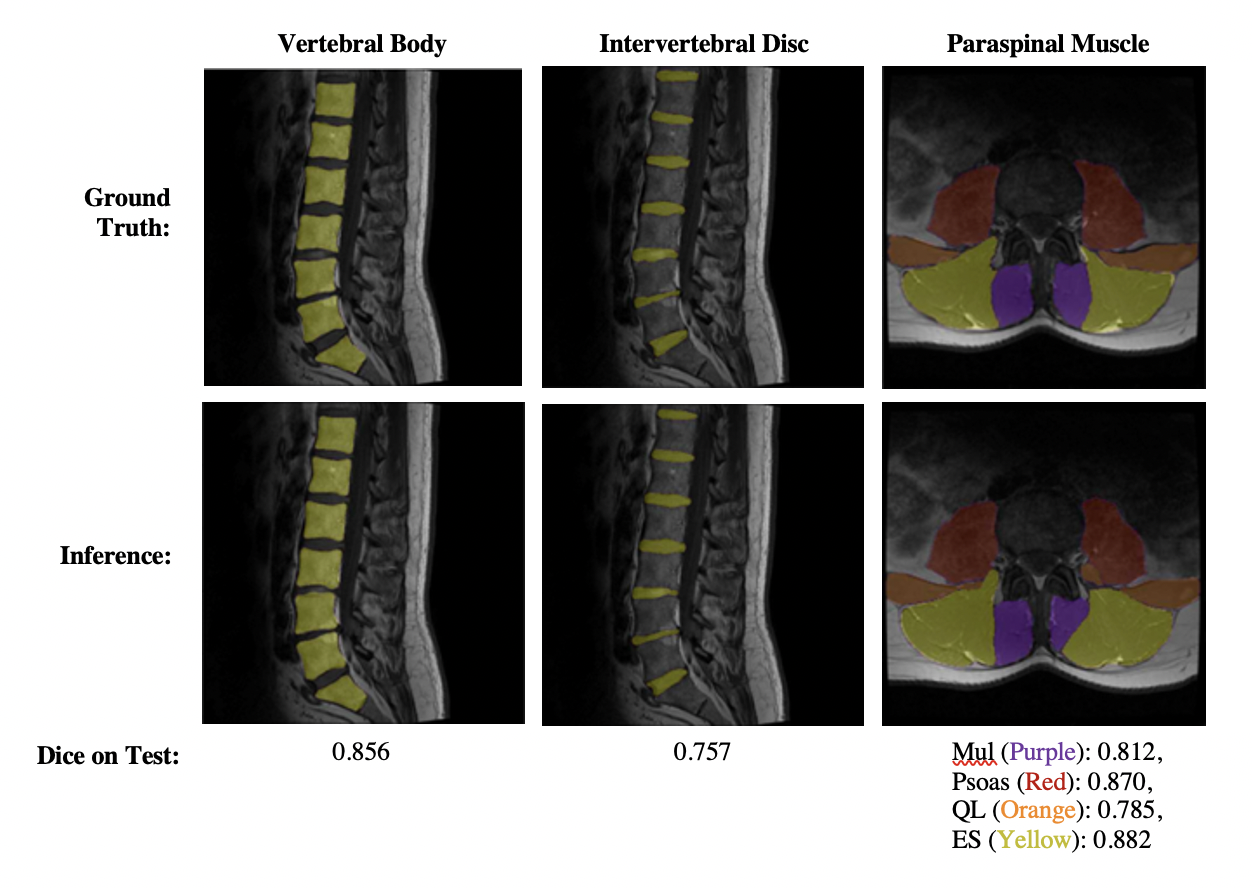
Figure 1: Visualization of segmentation results from each Network.
The first, second and third columns show examples of vertebral body, intervertebral disc, and paraspinal muscle segmentation results, respectively.
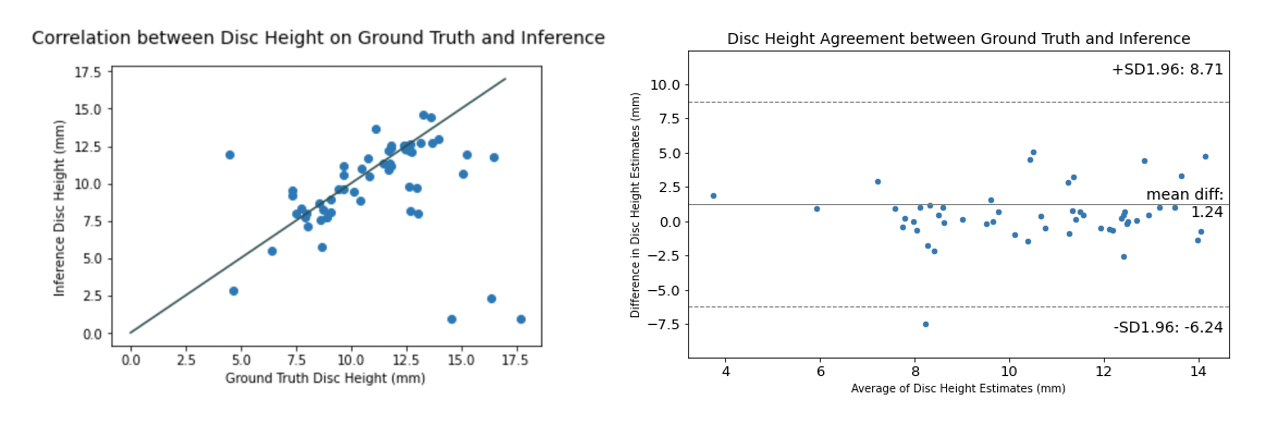
Figure 2: Correlation (left) and agreement (right) between intervertebral disc height from manual versus inferred disc segmentations.
Agreement is displayed using Bland-Altman plots for disc height on each disc. Correlation between disc height from manual versus inferred disc segmentations is displayed using a scatter plot, where the line x=y is indicated in grey and each point is the maximum central disc height calculated on each disc on each patient.
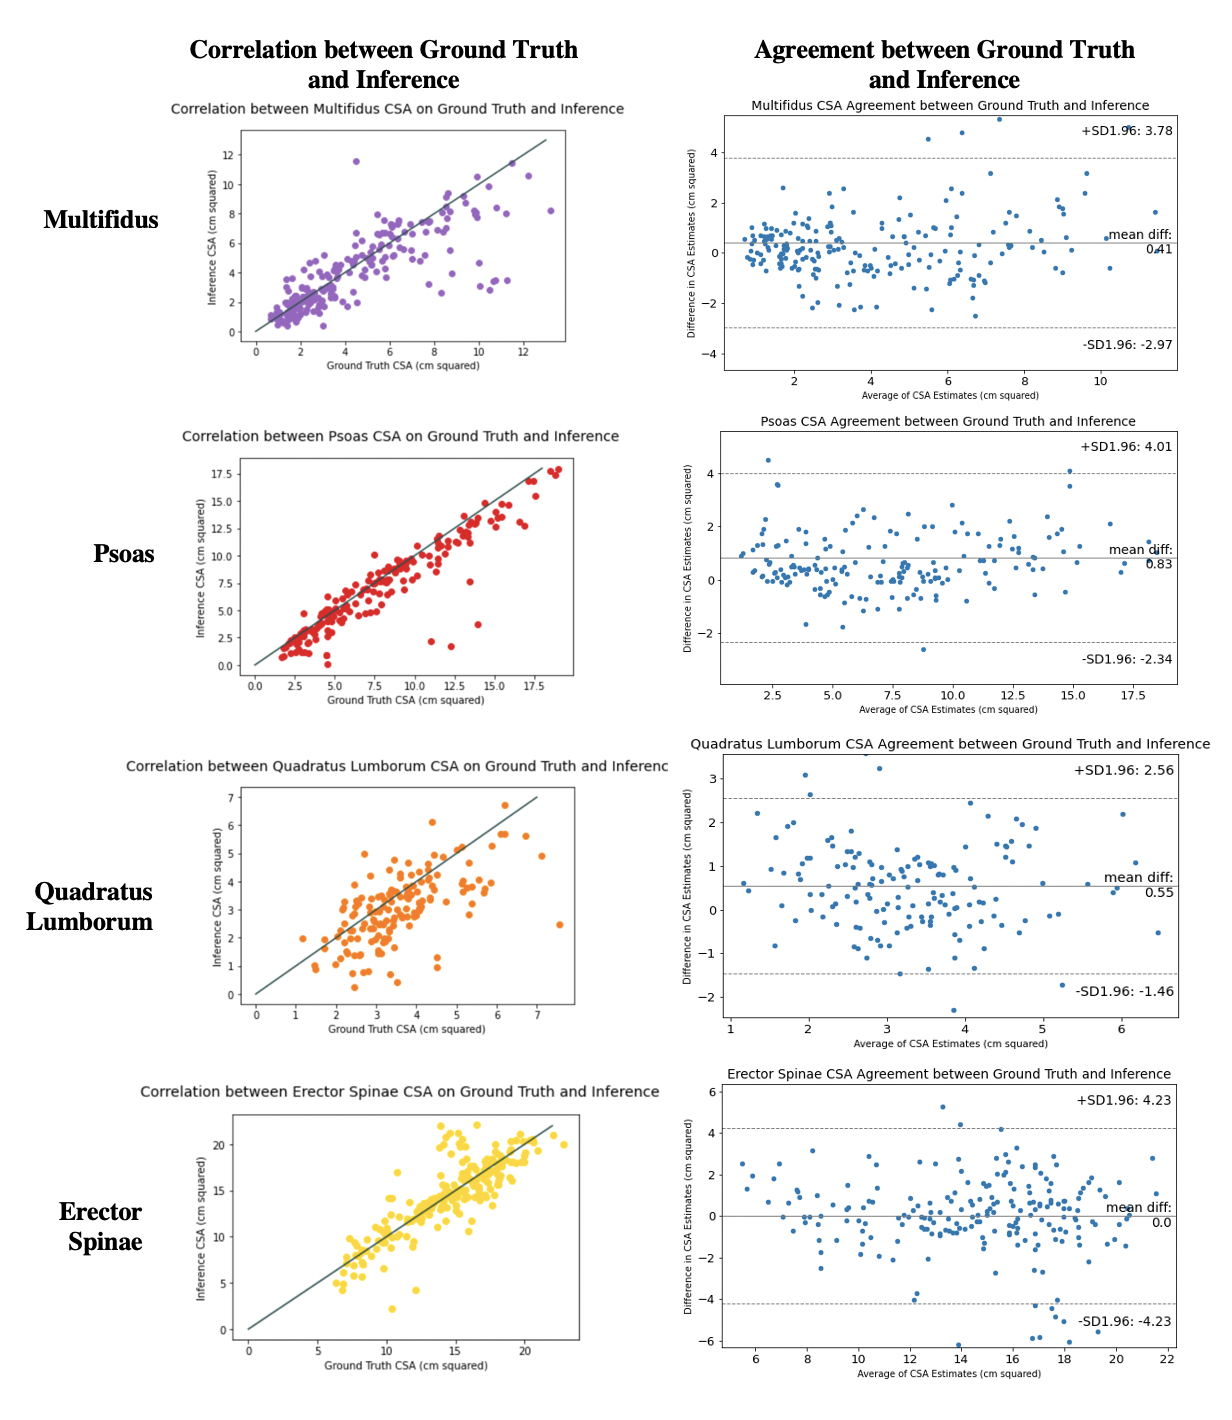
Figure 3: Correlation (left column) and agreement (right column) between muscle CSA from manual versus inferred segmentations on each paraspinal muscle.
Agreement is displayed using Bland-Altman plots for CSA on each disc. Correlation between CSA from manual versus inferred muscle segmentations is displayed using a scatter plot, where the line x=y is indicated in grey and each point is the CSA calculated on each respective muscle (both left and right) on each slice in each patient.
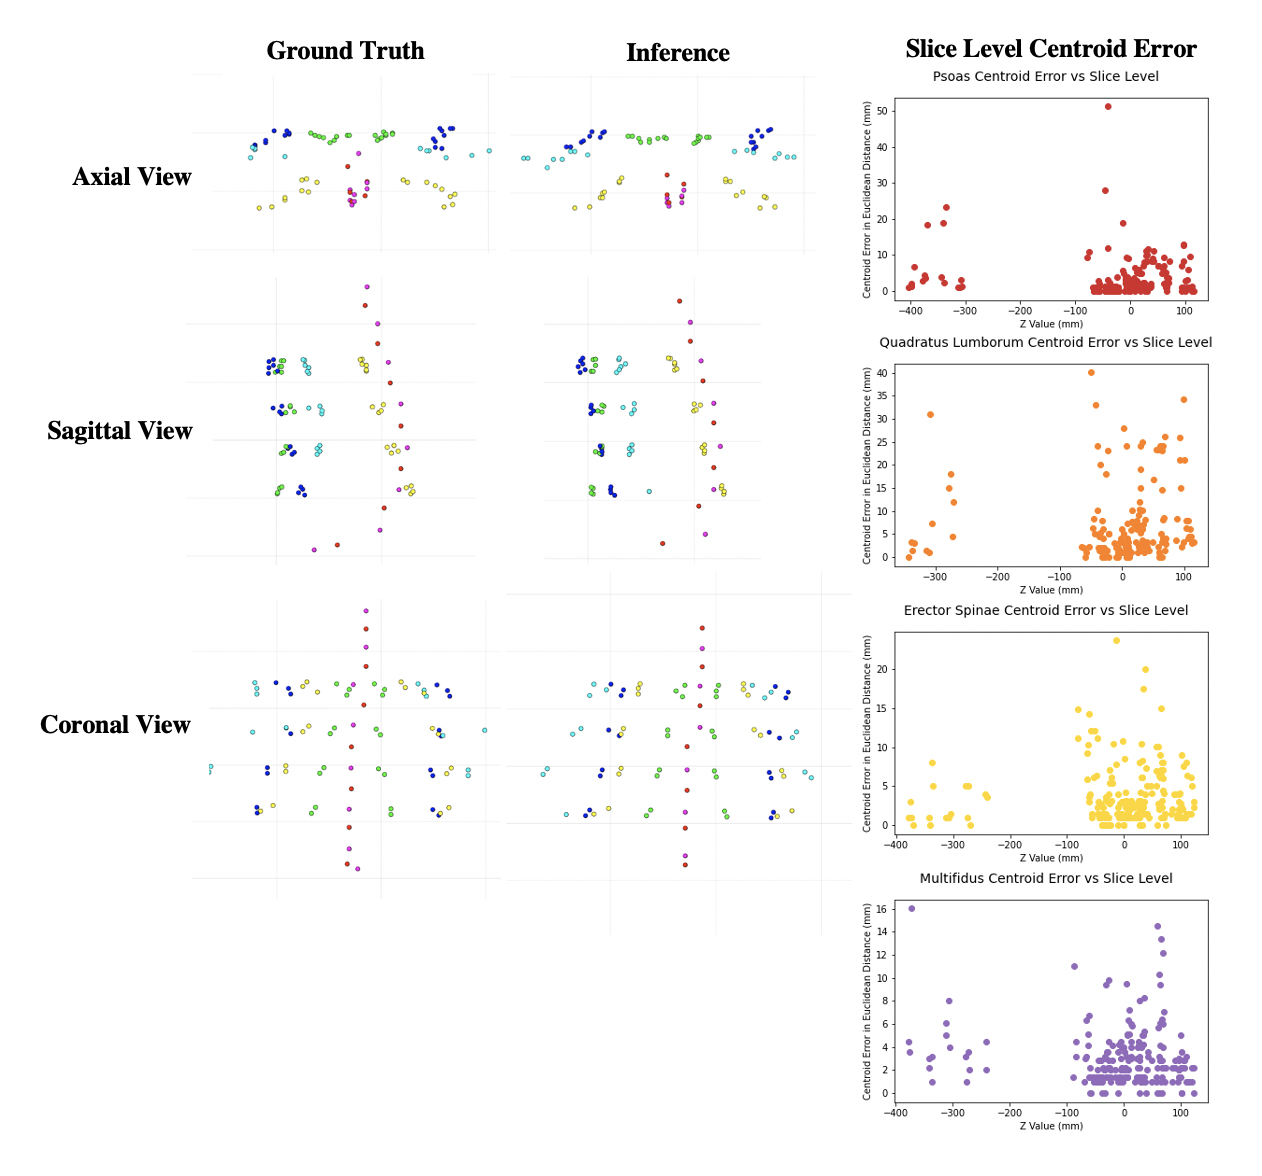
Figure 4: Visualization of Centroids and Muscle Centroid Errors.
The first two columns visualize 3D vertebral body and intervertebral disc centroids and 2D muscle centroids on each slice for one patient. The third column plots errors with slice index in 3D space (using mm from the reference point in the Z direction) on the X axis and difference in centroid position (using mm in Euclidean distance) on the Y axis. Centroids for which there are not both manual and inferred segmentations are excluded.