4058
Fully automatic detection and voxel-wise mapping of vertebral body Modic changes using deep convolutional neural networks1Department of Radiology and Biomedical Imaging, University of California, San Francisco, San Francisco, CA, United States, 2Center for Intelligent Imaging, Department of Radiology and Biomedical Imaging, University of California, San Francisco, San Francisco, CA, United States, 3University of California, Berkeley-University of California San Francisco Graduate Program in Bioengineering, San Francisco, CA, United States
Synopsis
Modic changes are common degenerative lesions seen in spinal MRI and are strongly linked to lower back pain. However, detection of Modic changes suffers from poor inter-operator and inter-scanner reliabilities. We present a fully automatic, quantitative model that leverages deep learning and signal-based clustering for mapping Modic changes from clinically acquired MRI. The model achieves an identification rate of 85.7% and substantial agreement with radiologists. More importantly, the mapping technique classifies detected lesions on a voxel-wise basis, allowing for assessment of sensitive, local pathologies.
Introduction
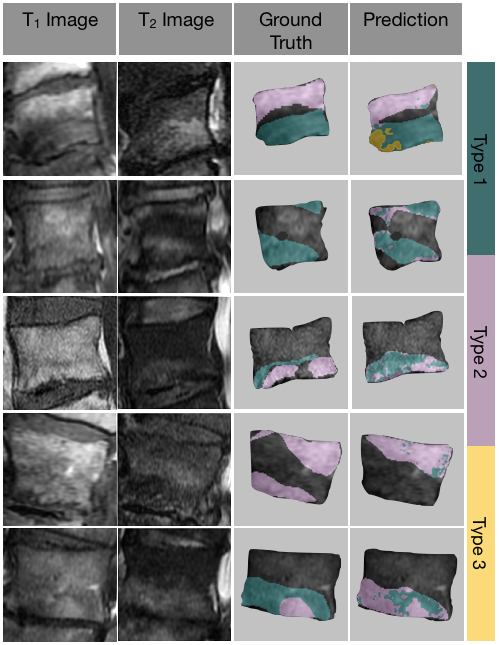
Modic changes are variations in magnetic resonance imaging (MRI) signal intensity describing bone marrow lesions adjacent to damaged vertebral body endplates.1 Bone marrow edemas or inflammation appear distinctly hypointense on T1-weighted images and hyperintense on T2-weighted images (Modic type 1). Meanwhile, bone marrow conversion is hyperintense on T1 MRI and iso- to hyperintense in T2 images (Modic type 2). And lastly, sclerotic bone appears hypointense in both images (Modic type 3). While Modic changes have been positively associated with lower back pain,2,3 it is difficult to assess these markers objectively due to inter-operator and inter-scanner variability.4 In part, this is due to the qualitative nature of the grading scheme. This study presents an automatic, deep learning approach for detecting the presence of Modic changes in sagittal T1-weighted and T2-weighted lumbar spine MRI.Methods
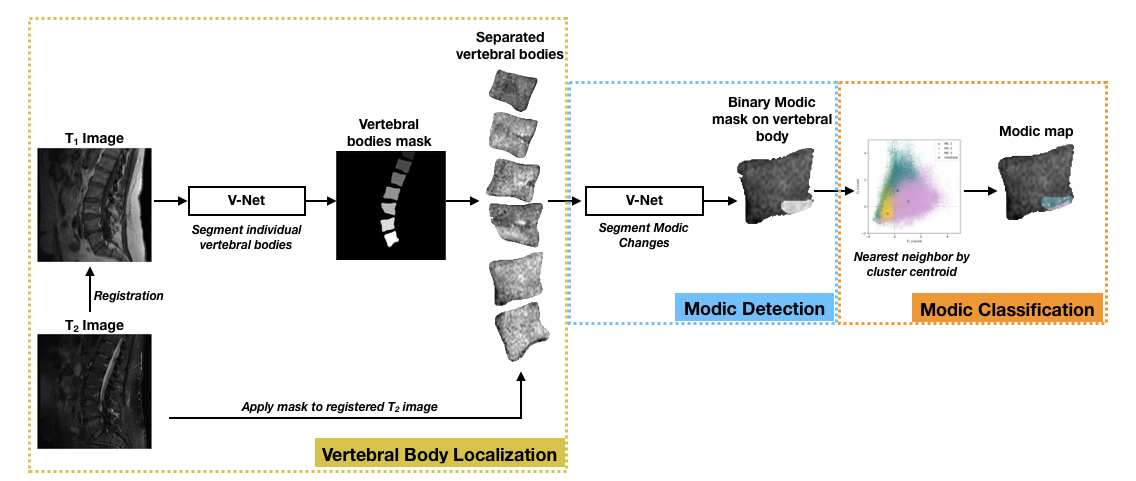
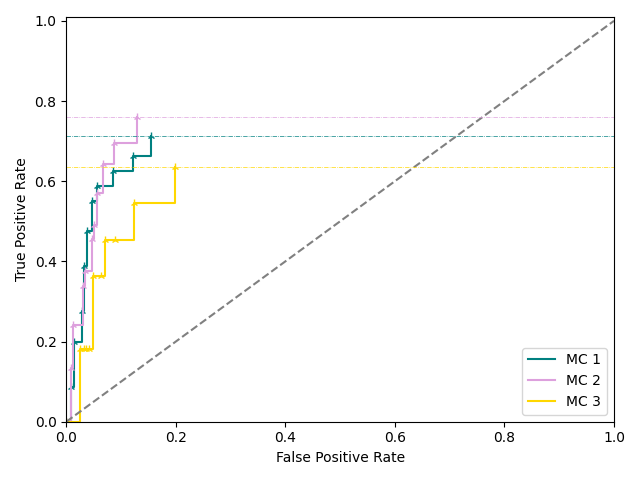
This Modic mapping scheme consists of three stages: (1) segmentation and localization of the vertebral bodies, (2) binary detection and segmentation of Modic changes, and (3) voxel-wise classification to determine Modic type (Fig. 1). This retrospective study used 75 clinical lumbar spine MRI studies, with and without symptoms of lower back pain. To serve as ground truth for the deep learning component, vertebral bodies with visible Modic changes were segmented for these changes (Type 1, 2 and 3) by two board-certified radiologists. In each MR exam, T1- and T2-weighted images were aligned using 3D rigid registration with mutual information loss. A pretrained, in-house segmentation model localized and extracted vertebral bodies with bounding boxes of size 100 × 100. Modic detection was achieved using a second segmentation model which utilized these bounded vertebral bodies and the radiologist-annotated Modic changes. Prior to training the detection model, T1-weighted and T2-weighted images of the 1872 sagittal slices of vertebral bodies were converted to z-score maps to normalize for variation in signal intensity and then split into training, validation, and test sets (65/20/15 ratio). This Modic segmentation model was trained using a 2D V-Net5 with a combined cross-entropy and Dice loss, learning rate of 1e-5, Adam optimizer, and dropout rate of 0.5. Post-training, the training set was used for cluster analysis, grouping the three types of Modic changes by T1 z-score and T2 z-score within the radiologist-annotated segmentations. Finally, Modic maps were generated, where each voxel was classified by the minimal Euclidean distance of T1 and T2 z-scores from the cluster centroids. For evaluation, a binary label was assigned to each endplate based upon the presence of voxels of each class. To assess if noise in signal intensity negatively impacted performance, a receiver operating characteristic (ROC) curve was generated using the validation set, with percentage of voxels in each class of the predicted lesions as the varying discrimination threshold. The optimal threshold to maximize $$$True Positive Rate-(1-False Positive Rate)$$$ in the ROC curve was implemented in the final inference of the test set.Results
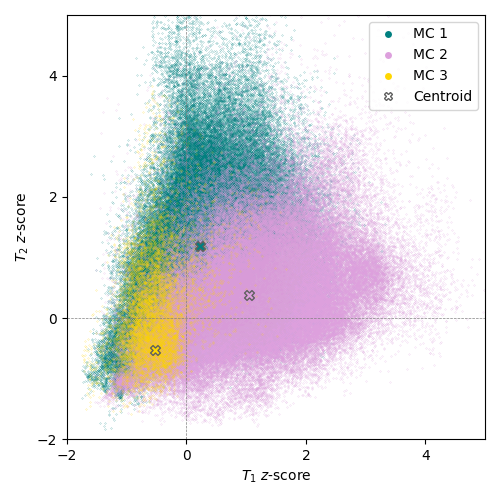
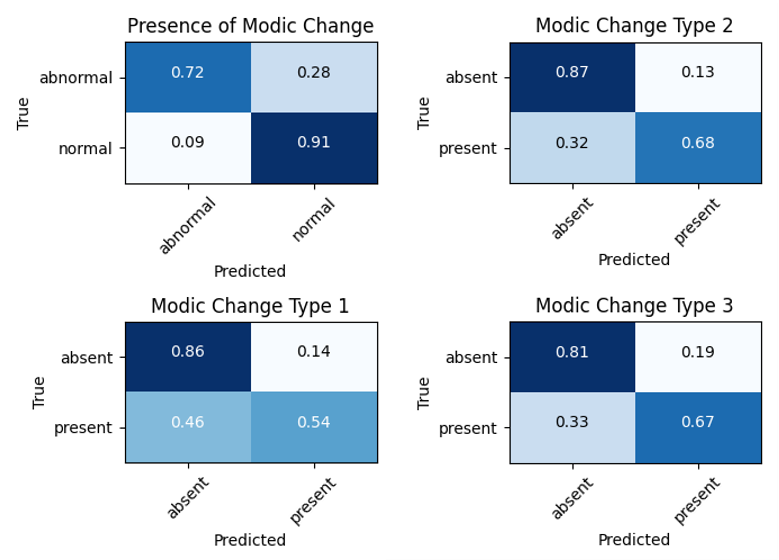
The Modic detection model successfully identified the presence or absence of changes in 85.7% of the unseen test set, with a sensitivity of 0.72, specificity of 0.91, and Cohen’s kappa coefficient of 0.63. Voxel-wise classification was derived from clusters centered at [0.23 (±0.73), 1.20 (±1.16)], [1.04 (±1.00), 0.37 (±0.85)], and [-0.53 (±0.41), -0.52 (±0.85)] (Fig. 2). In the assessment of the ROC curve to balance true positive and false positive rates, the optimum threshold was determined to be zero, where the presence of at least one voxel in a class resulted in categorizing the endplate with that class label (Fig. 3). Labeling of each endplate using this rule-based classification system resulted in sensitivities of [0.54, 0.68, and 0.67] and specificities of [0.86, 0.87, and 0.81] for Modic types 1, 2, and 3, respectively (Fig. 4).Discussion
This study used deep learning-based models to automatically localize and map Modic changes in vertebral bodies. Our results demonstrate substantial agreement of the detection model with radiologist-annotated grading to recognize damaged endplates. By leveraging vertebral body segmentation to mask neighboring spinal structures and signal intensity normalization with z-scoring within the vertebral bodies, the detection model was invariant to external factors in pathology or image acquisition noise. The quantitative nature of this voxel-wise mapping method allows further sensitivity to granular differences and characterizations of image abnormalities. For example, bone marrow pathologies, which have been associated with lower back pain,6,7 are heterogeneous and often transitional.8 Our mapping technique is able to visualize such progression and allow for assessment of these local features (Fig. 5). Furthermore, this model was developed using clinical MRI exams acquired between a period of 8 years, suggesting robustness and generalizability to real-world environments. The limitations of this study are the small and imbalanced sample set with relatively poor representation of Modic type 3. Future stages of this study will explore the implementation of this method to assist radiologist grading.Conclusion
In this work, we present a novel deep learning-based approach to localize and segment Modic changes, with results that demonstrate high agreement with radiologist grading. The introduction of this fully automatic, quantitative mapping technique may increase inter-operator reliability and ultimately improve robustness in understanding the associations of Modic changes with lower back pain and spinal degeneration.Acknowledgements
This work is supported by the National Institute of Health and National Institute of Arthritis and Musculoskeletal and Skin Diseases (Project #: UH2AR076724).References
1. Modic MT, Steinberg PM, Ross JS, et al. Degenerative disk disease: assessment of changes in vertebral body marrow with MR imaging. Radiology 1988;166(1 Pt 1):193–199.
2. Jensen TS, Karppinen J, Sorensen JS, et al. Vertebral endplate signal changes (Modic change): a systematic literature review of prevalence and association with non-specific low back pain. Eur Spine J. 2008 Nov;17(11):1407-22.
3. Zhang YH, Zhao CQ, Jiang LS, et al. Modic changes: a systematic review of the literature. Eur Spine J. 2008 Oct;17(10):1289-99.
4. Fields AJ, Battie MC, Herzog RJ, et al. Measuring and reporting of vertebral endplate bone marrow lesions as seen on MRI (Modic changes): recommendations from the ISSLS Degenerative Spinal Phenotypes Group. Eur Spine J 2019;28(10):2266-2274.
5. Milletari F, Navab N, Ahmadi SA. V-Net: Fully Convolutional Neural Networks for Volumetric Medical Image Segmentation. arXiv 2016;1606.04797.
6. Mitra D, Cassar-Pullicino VN, et al. Longitudinal study of vertebral type-1 end-plate changes on MR of the lumbar spine. Eur Radiol 2004 Sep;14(9):1574-81.
7. Vital JM, Gille O, Pointillart V, et. al. Course of Modic 1 six months after lumbar posterior osteosynthesis. Spine (Phila Pa 1976) 2003 Apr 1;28(7):715-20.
8. Hutton MJ, Bayer JH, Powell JM. Modic vertebral body changes: the natural history as assessed by consecutive magnetic resonance imaging. Spine (Phila Pa 1976). 2011 Dec 15;36(26):2304-7.
Figures