4053
Less is more: zero-shot detection and transfer learning for facet arthropathy localization and classification on lumbar spine MRIs
Upasana Upadhyay Bharadwaj1, Cynthia T Chin1, Valentina Pedoia1, and Sharmila Majumdar1
1Radiology, University of California, San Francisco, San Francisco, CA, United States
1Radiology, University of California, San Francisco, San Francisco, CA, United States
Synopsis
Lumbar facet arthropathy is frequently observed along with other degenerative changes of the spine in patients presenting with chronic low back pain. Deep learning has demonstrated unprecedented success in automated assessment of many spine degenerative changes, but heretofore not applied to facet arthropathy. This study presents binary classification of facet arthropathy (normal/mild vs moderate/severe) on T2-weighted axial MRI slices using a two-staged approach: zero-shot facet detection followed by classification. Our model achieves an AUC of 0.916 [0.911, 0.921] with sensitivity and specificity of 97.8% [97.4, 98.3] and 64.1% [63.1, 65.1], respectively and can potentially enhance the clinical workflow.
Introduction
Lumbar facet arthropathy is a degenerative condition of the spine, prevalent in 15% to 45% of patients presenting with chronic low back pain1,2. In clinical practice, Magnetic resonance imaging (MRI) is used to evaluate and identify causes of low back pain such as disc herniation, foraminal stenosis, and central canal stenosis, with computed tomography (CT) being the preferred imaging modality for facets3. Prior studies demonstrate automated diagnosis of lumbar spine degenerative changes, with the notable exception of facet arthropathy4,5,6. This study presents a deep learning approach for identifying facets and subsequently classifying arthropathy from T2-weighted axial lumbar spine MRIs.Methods
In a retrospective cross-sectional study, lumbar spine MRIs acquired between 2008 and 2018 were randomly selected after excluding cases with fractures, extensive hardware, primary tumors, and wide-spread metastatic disease to the spine. The study includes 98 patients (54 Female, 44 Male) with mean age 62 [22, 99] years presenting with acute-to-chronic spectrum of low back pain and/or radiculopathy [Figure 1c]. T2-weighted axial MRIs from this cohort were evaluated for facet arthropathy by a board-certified neuroradiologist and categorized into normal/mild vs moderate/severe7. A binary classification model was developed using a two-staged approach [Figure 1b]: (1) zero-shot facet detection; (2) classification. In stage (1), slices from the entire cohort were processed into patches of facets using a pre-trained dural sac segmentation model (U-Net model8 trained on an independent dataset with dice score of 0.93) [Figure 2a,b] and rule-based detection of facets: 36mmX36mm bounding boxes originating from the top-most point of the predicted dural sac, with the centroid partitioning the image into left and right [Figure 2c]. The dural sac was subtracted from each patch, and the final image was resized to 224x224. Annotations (location coordinates) [Figure 3a] were made on the mid-disc slice for each spinal level (L1/L2 to L5/S1) from which ground-truth bounding boxes of 36mmX36mm were created using the location coordinate as the centroid. Our zero-shot facet detection approach was evaluated using mean-average precision (mAP) and intersection-over-union (IoU) [Figure 3b,c]. In stage (2), the processed patches from stage (1) were partitioned into random train/validation/test splits at the patient-level with 42/21/35 patients and 357/183/285 patches [Figure 4a]. A Big Transfer (BiT) ResNet-50 model9 was fine-tuned on the training split for binary classification of Normal/Mild (259 patches) vs Moderate/Severe (98 patches) [Figure 4b]. Thresholds at three operating points – high sensitivity, high specificity, and equal-error rate (EER) – were selected using the validation split [Figure 4c]. Model performance was evaluated on the test split using AUC and sensitivity/specificity along with their 95% confidence intervals [Figure 5c]. Saliency maps [Figure 5b] were generated using integrated gradients for visualization10.Results
Zero-shot facet detection (stage 1) achieved an average IoU of 0.66, and a mean average precision of 89.0% at an IoU threshold of 0.5. Our approach had a recall of 100% with all ground-truth location coordinates falling within the 36mmX36mm model-generated bounding boxes. Classification of facet arthropathy (stage 2) on the test set had AUC of 0.916 (95% CI: [0.911, 0.921]). At the EER operating point, sensitivity and specificity were 76.2% (95% CI: [74.8%, 77.5%]) and 88.6% (95% CI: [88.9%, 90.5%]), respectively; at a high-sensitivity operating point, sensitivity and specificity were 97.8% (95% CI: [97.4%, 98.3%] and 64.1% [63.1%, 65.1%], respectively; and at a high-specificity operating point, sensitivity and specificity were 42.9% (95% CI: [41.3%, 44.5%]) and 96.1% (95% CI: [95.6%, 96.5%]), respectively.Discussion and Conclusion
To our knowledge, this is the first automated approach to classifying facet arthropathy from MRIs. New deep learning applications require task-specific data, however annotation costs for obtaining high quality masks can be exorbitant; we mitigate this by leveraging a previously trained dural sac segmentation model (different anatomy) and utilize it for localizing the facet (zero-shot). We evaluate our approach using standard object detection metrics, which indicate high precision (no subsequent training or fine-tuning). Rule-based techniques, in conjunction with available models, can be used to assess other anatomies such as the foramen. Classification of facet arthropathy and class imbalance required a data-efficient approach. Our model relies on a standard ResNet-50 architecture, but pre-trained on the entire ImageNet-21k dataset (14M images) using the big transfer approach9. Although not reported, our model exhibited significant improvements over training from scratch or pre-training on ImageNet-1k (1M images). With an AUC >0.90 and high sensitivity/specificity at relevant operating points, our model may be the first step towards automating MR diagnosis of facet arthropathy. Visualization of the models predictions were in line with clinical findings- with the saliency maps highlighting not just the superior and inferior articular processes of the facet joint but also the surrounding synovium and ligamentum flavum [Figure 5b].A potential limitation of our study is the lack of automated spinal level detection. Our pipeline operates on slices that best represent the facet for a given level. Augmentation by automated identification of relevant slices is the next step towards an end-to-end solution. Another limitation is the binarization of grades. Automated grading into four categories (Normal/Mild/Moderate/Severe) may be more clinically relevant. In conclusion, our study shows that a combination of rule-based and deep-learning techniques can achieve high accuracies in classifying relevant lumbar spine conditions with efficient data use.
Acknowledgements
This work was funded by the National Institutes of Health (NIH 2019 UH2AR076724): Technology Research Site for Advanced, Faster Quantitative Imaging for BACPACReferences
- Cohen SP, Raja SN. Pathogenesis, diagnosis, and treatment of lumbar zygapophysial (facet) joint pain. Anesthesiology. 2007 Mar;106(3):591-614.
- Manchikanti L, Hirsch JA, Pampati V. Chronic low back pain of facet (zygapophysial) joint origin: is there a difference based on involvement of single or multiple spinal regions? Pain Physician. 2003 Oct;6(4):399-405.
- Berg L, Thorensen H, Neckelmann G, et al. Facet arthropathy evaluation: CT or MRI? European Radiology. 2019 Sep;29(9):4990-4998.
- Lu J, Pedemonte S, Bizzo B, et al. Deep Spine: Automated Lumbar Vertebral Segmentation, Disc-Level Designation, and Spinal Stenosis Grading using Deep Learning. Proceedings of the 3rd Machine Learning for Healthcare Conference, in PMLR. 2018;85:403-419.
- Jamaluddin A, Kadir T, Zisserman A. SpineNet: Automated classification and evidence visualization in spinal MRIs. Medical Image Analysis. 2017;41:63-73.
- Lewandrowski K, Muraleedharan N, Eddy SA, et al. Artificial Intelligence Comparison of the Radiologist Report With Endoscopic Predictors of Successful Transforaminal Decompression for Painful Conditions of the Lumber Spine: Application of Deep Learning Algorithm Interpretation of Routine Lumbar Magnetic Resonance Imaging Scan. International Journal of Spine Surgery. 2020;14(s3):S75-S85.
- Urbina MC, Benitez HS, Rivera MAF, et al. Efficacy and Safety of Lumbar Arthroplasty in Degenerative Disc Disease. Coluna/Columna 2018;17(2):103-109.
- Ronnenberger O, Fischer P, Brox T. U-Net: Convolutional Networks for Biomedical Image Segmentation. Medical Image Computing and Computer-Assisted Intervention – MICCAI 2015. 2015;vol 9351.
- Kolesnikov A, Beyer L, Zhai X, et al. Big Transfer (BiT): General Visual Representation Learning. GitHub: https://github.com/google-research/big_transfer.
- Sundarrajan M, Taly A, Yan Q. Axiomatic Attribution for Deep Networks. Proceedings of the 34th International Conference on Machine Learning, PMLR 2017;70.
Figures
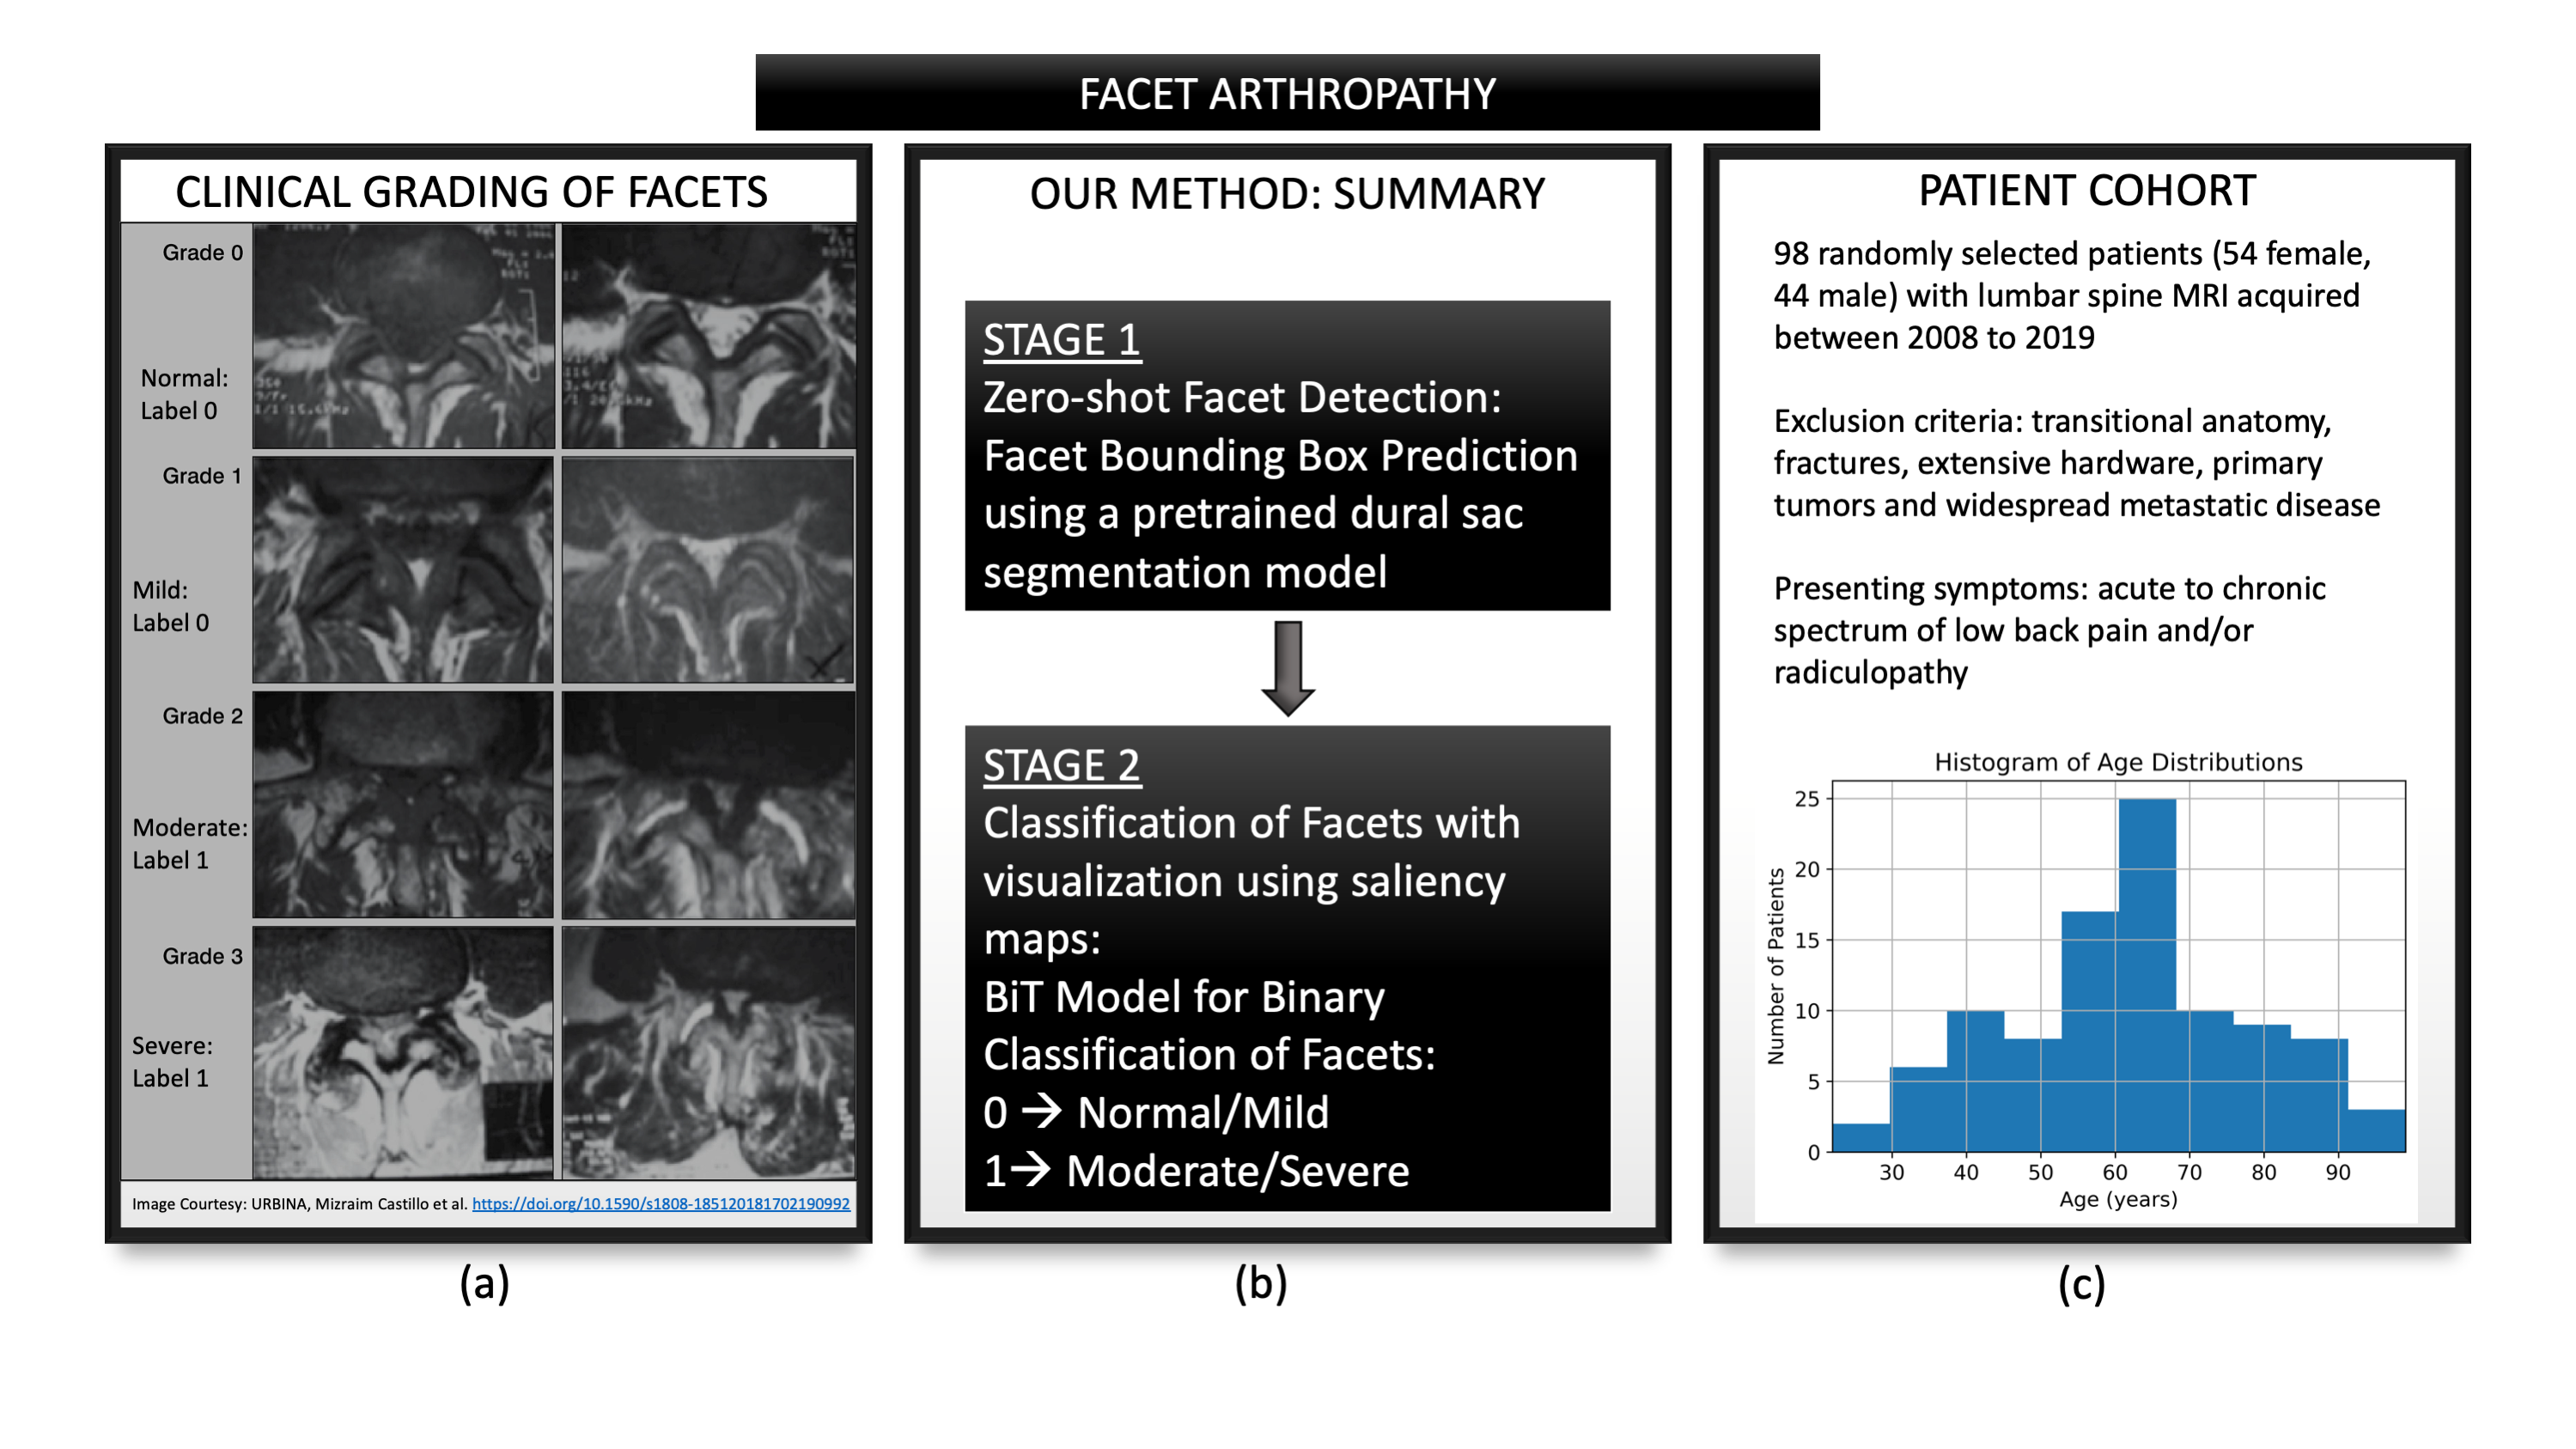
Figure 1: (a) provides a detailed visual overview
of facet grades (Normal, Mild, Moderate, Severe) on T2-axial slices. In this
study, grades were binarized into Normal/Mild vs Moderate/Severe. (b) provides
an overview of our approach and the two-staged pipeline: zero-shot facet
detection using an existing dural sac segmentation model followed by binary
classification. (c) provides a summary of the patient cohort, including a
histogram of the age distribution.
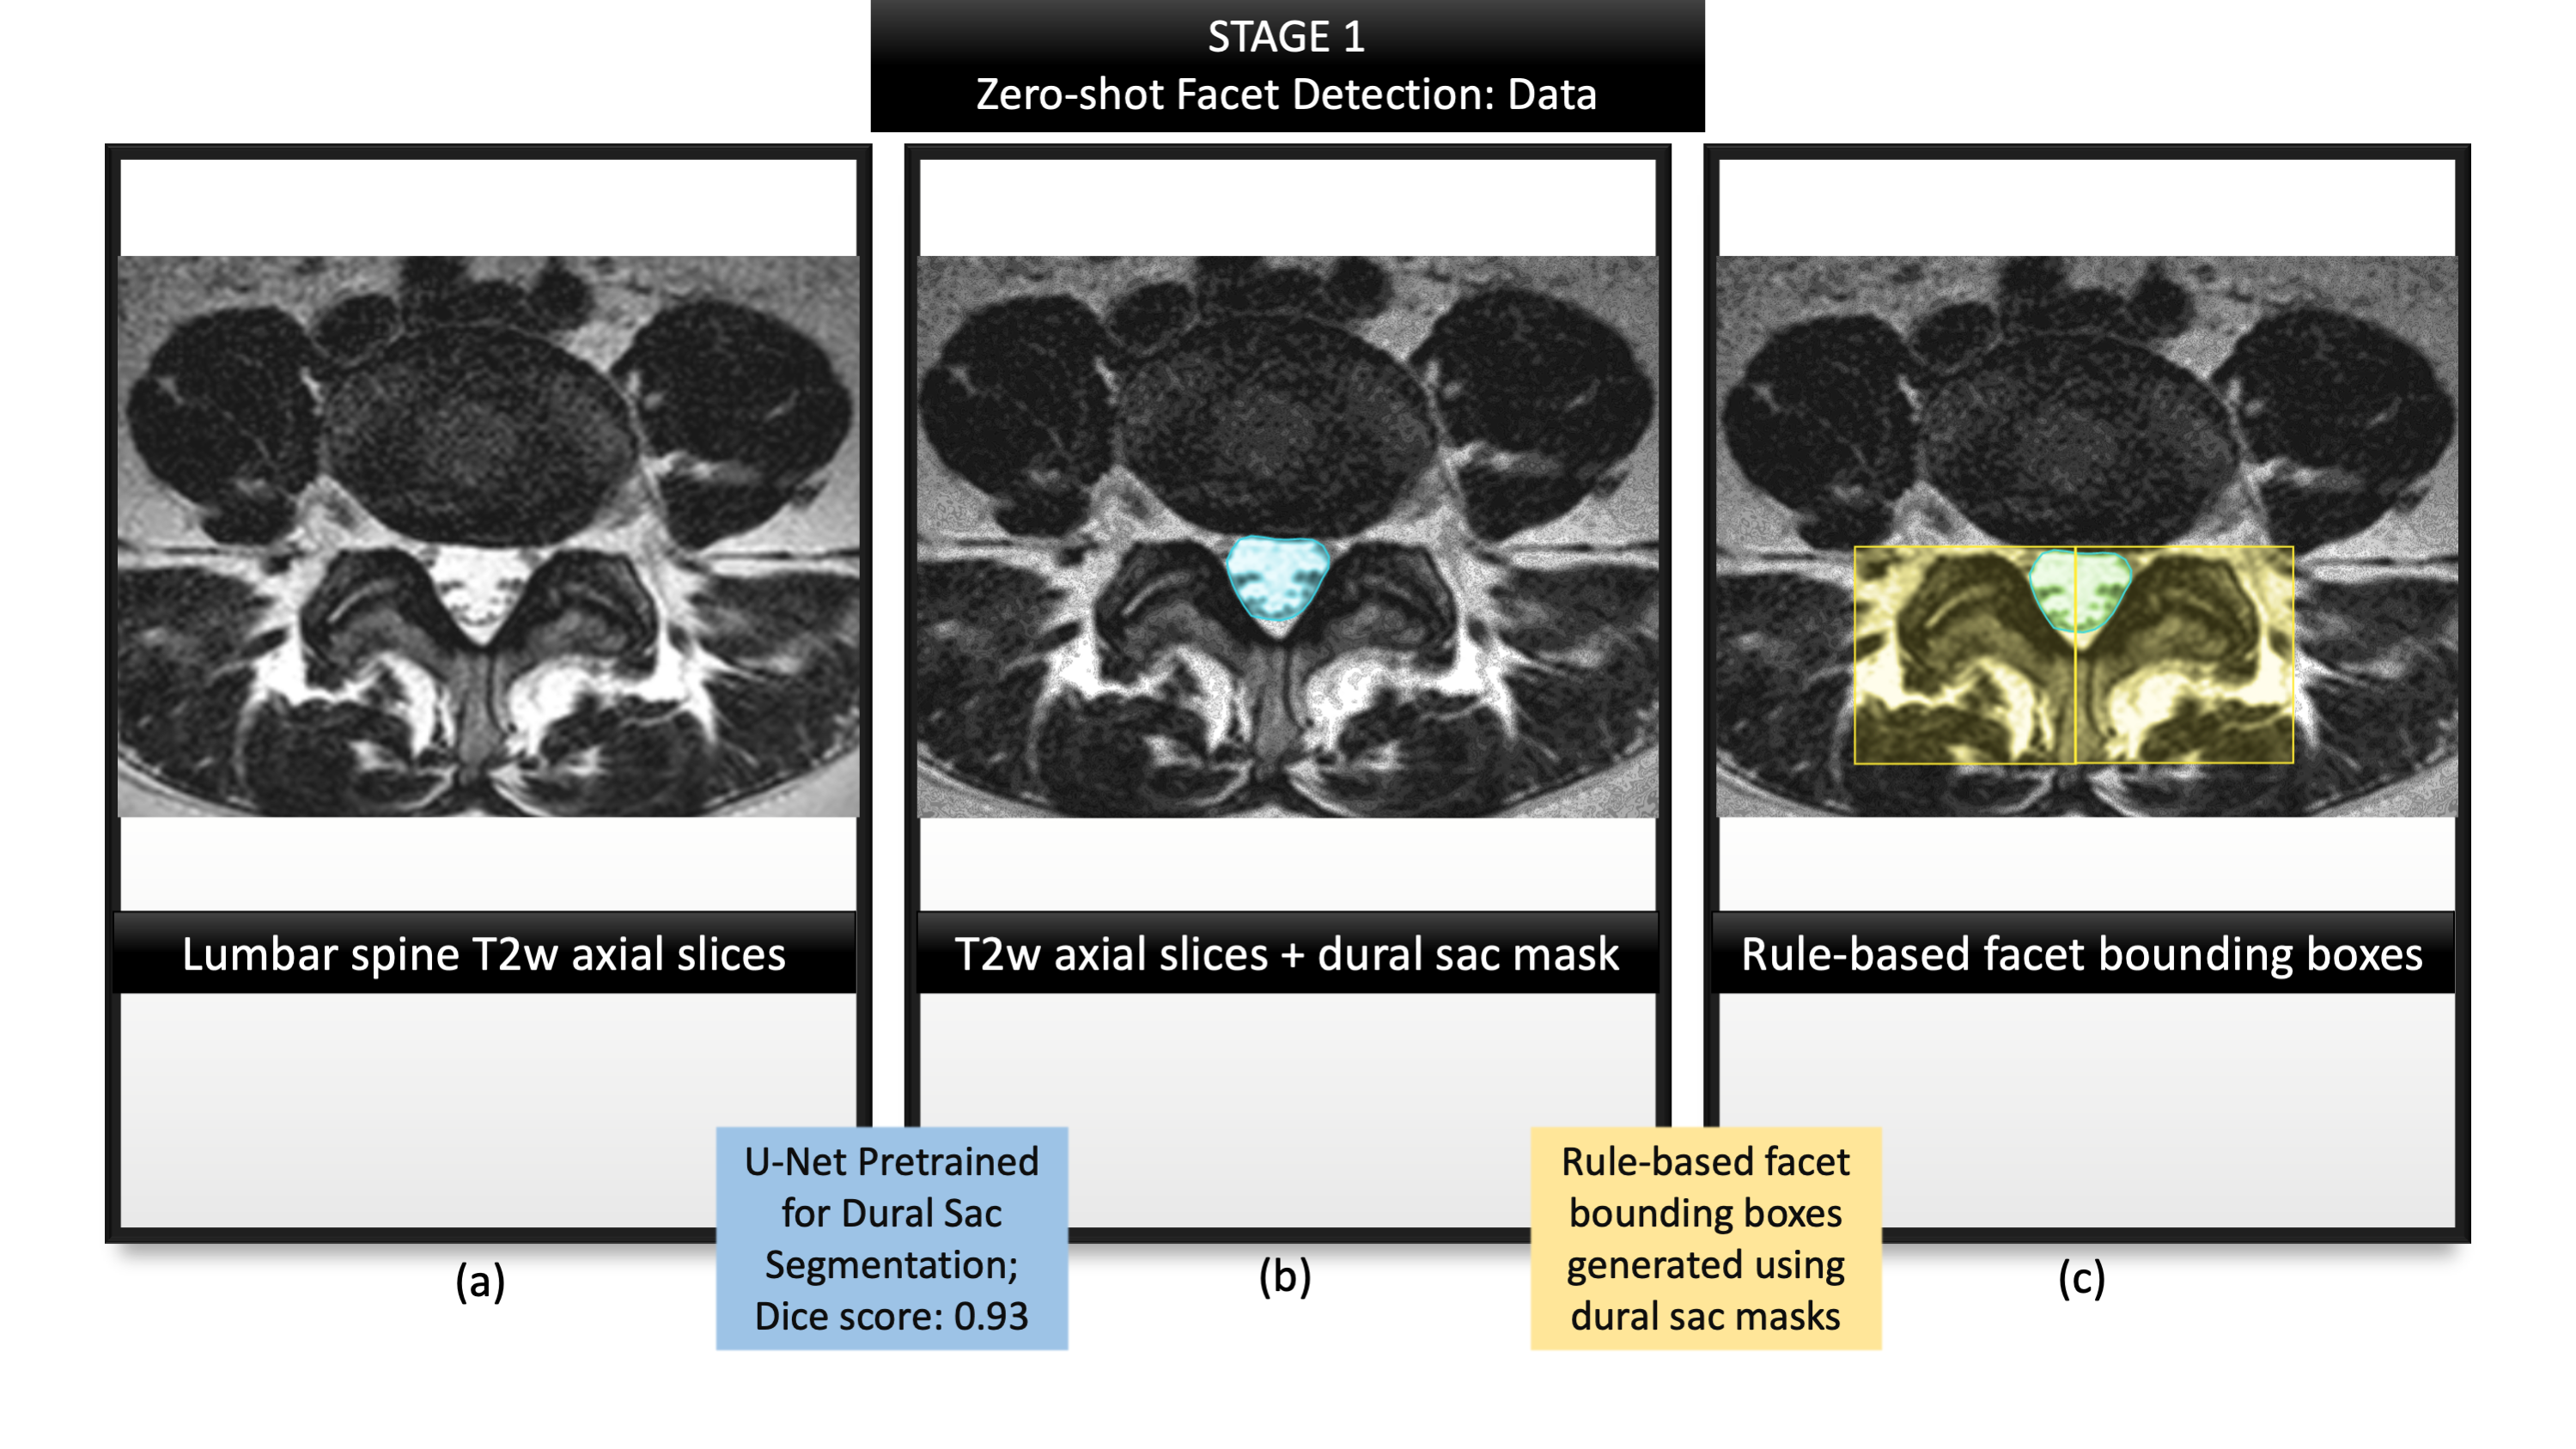
Figure 2: Summarizes the first stage of zero-shot
facet detection. (a) illustrates a representative T2-w axial slice from the
dataset; (b) visualizes the dural sac region predicted by a previously trained
U-Net segmentation model; (c) demonstrates our rule-based method of identifying
bounding boxes for the left and right facet, respectively (selecting the
top-most central point from the dural sac segmentation and drawing 36mm x 36mm
boxes originating from that coordinate in either direction).
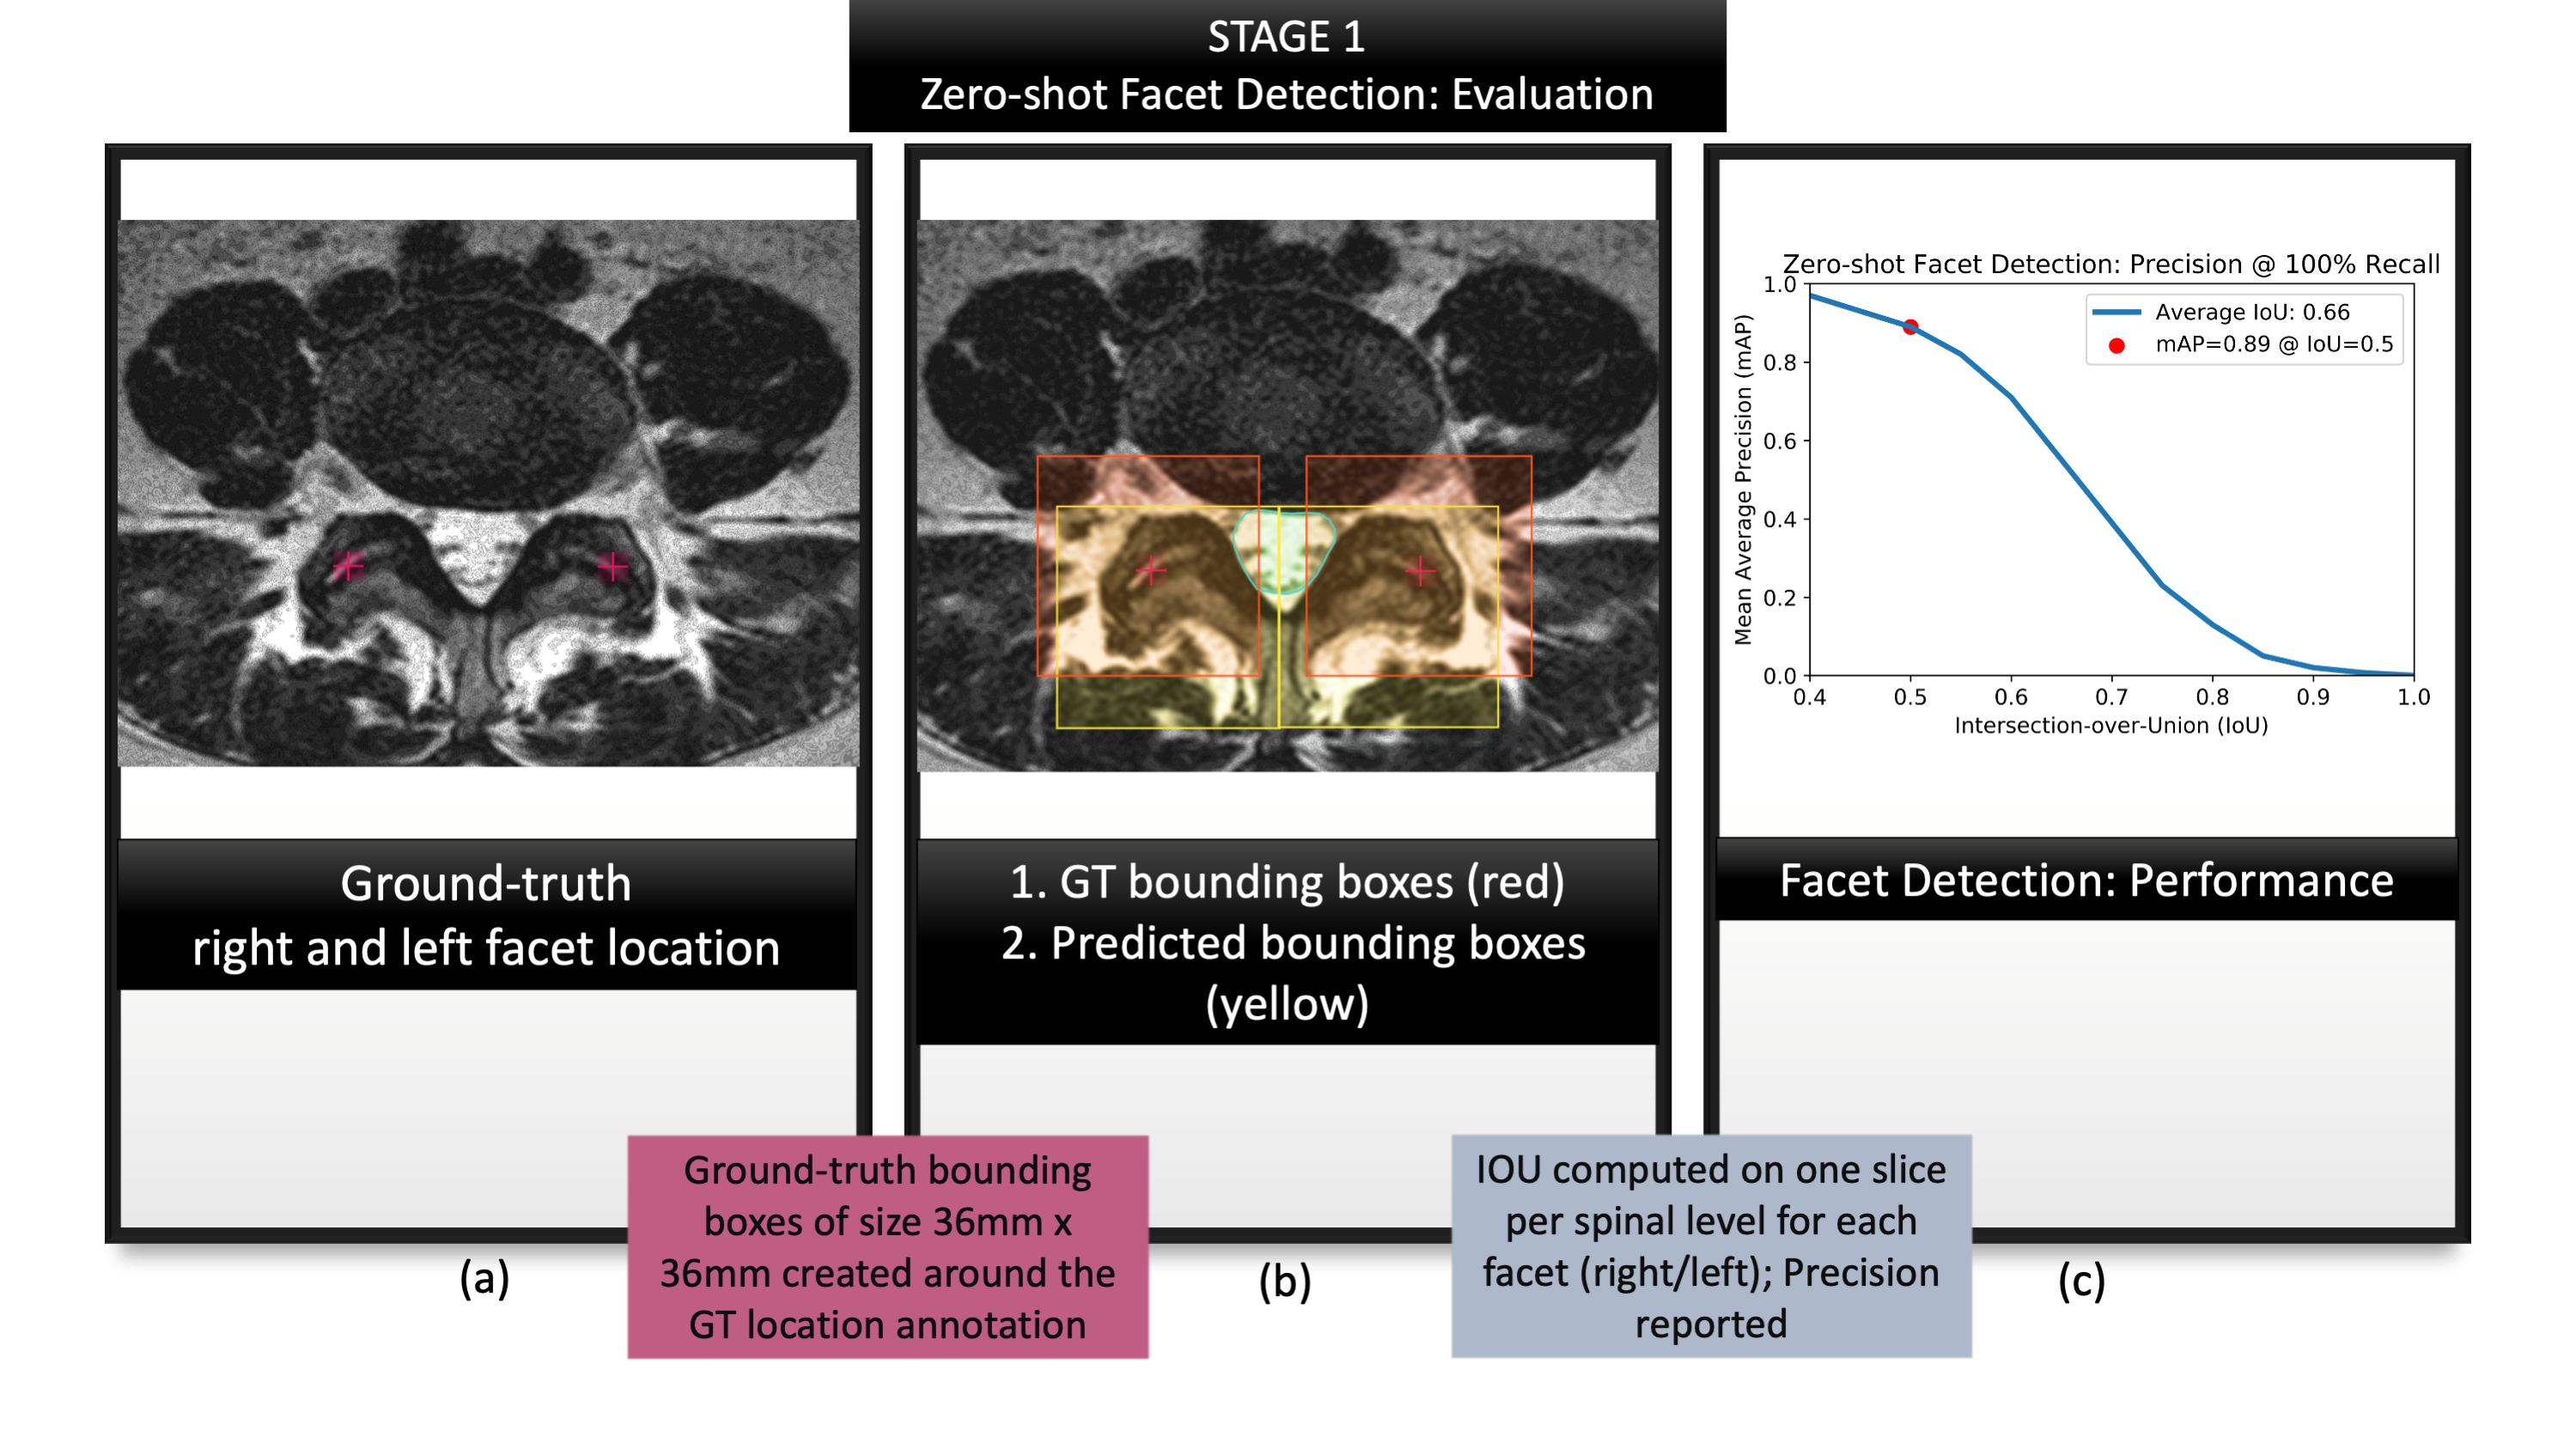
Figure 3: Summarizes the evaluation of first
stage: zero-shot facet detection. (a) visualizes location coordinates annotated
on the T2-w axial slices by a neuroradiologist. These location coordinates were
used purely for evaluating our localization, and not for training our models;
(b) visualizes ground-truth bounding boxes generated from the location
coordinates in (a) shown in red against predicted bounding boxes from zero-shot
detection, shown in yellow.; (c) characterizes the performance with a mAP-IoU
graph.
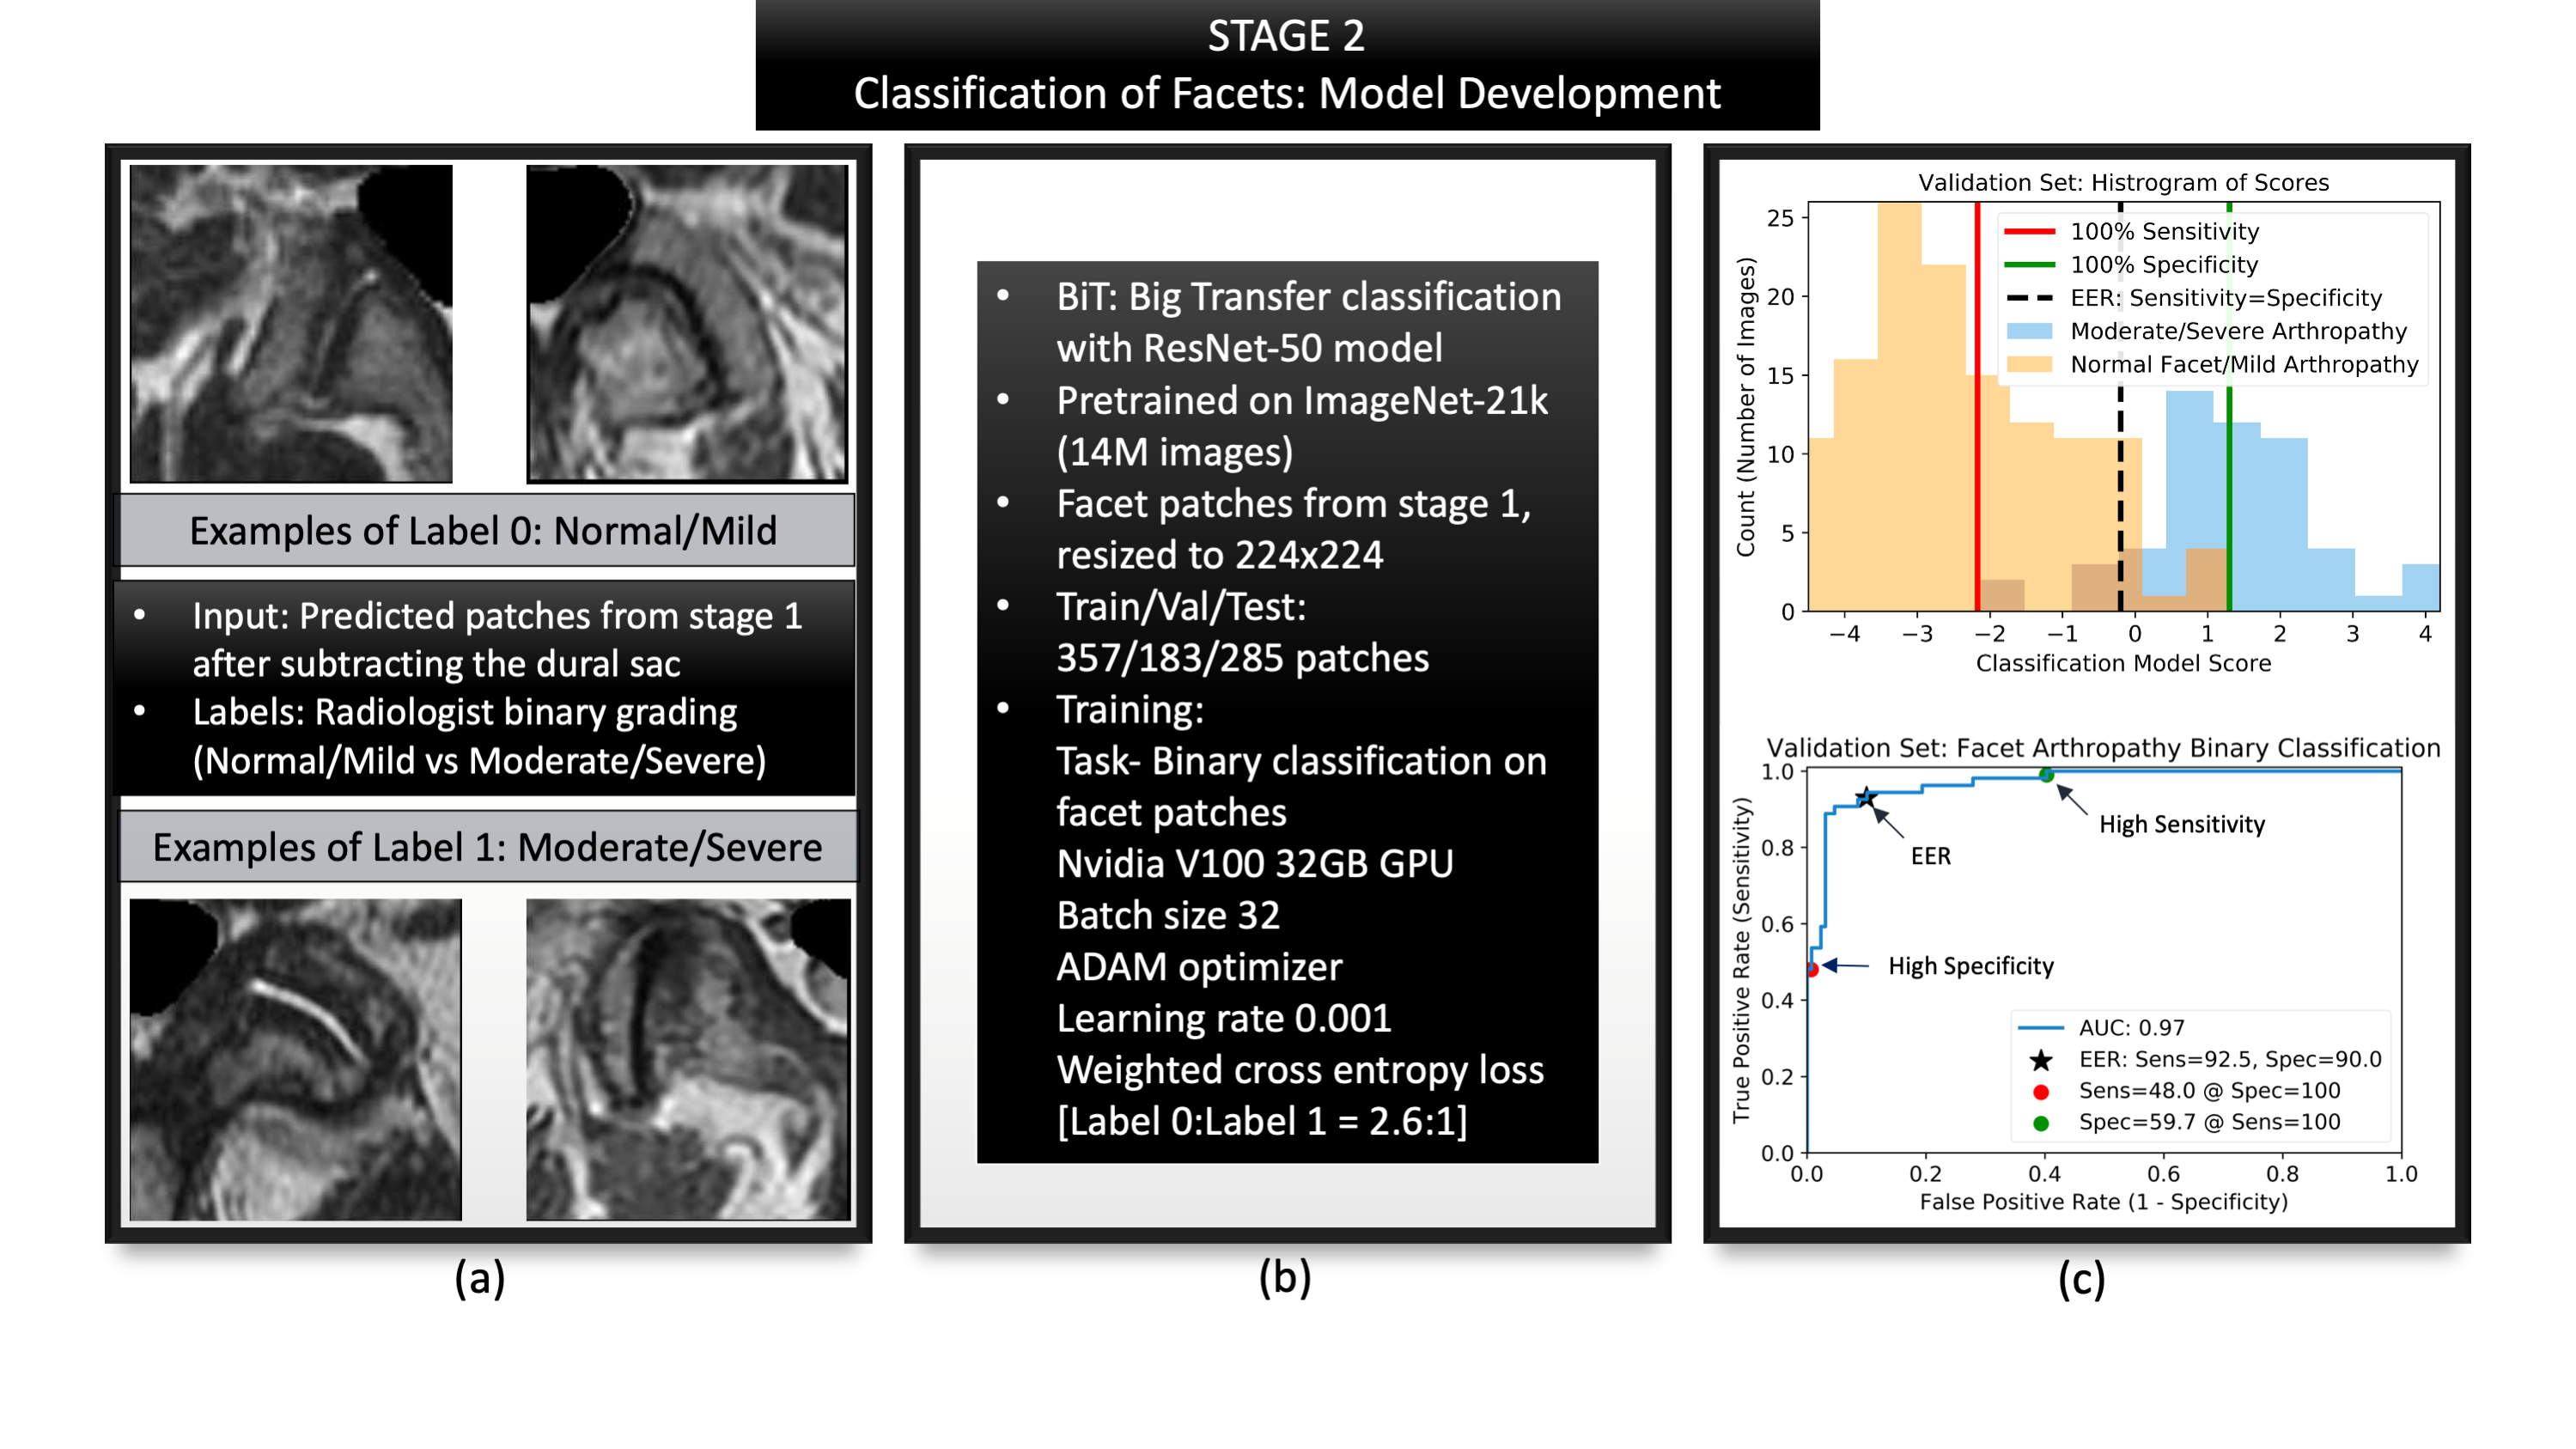
Figure 4: Summarizes the second stage of classification. (a) Shows representative patches generated from stage one, that were used as inputs with radiologist graded labels of label 0: normal/mild arthropathy changes and label 1: moderate/severe arthropathy changes. (b) Summarizes model parameters. (c) Validation graphs with a histogram of scores as well as the ROC curve to indicate how the three operating points and their respective thresholds were selected.
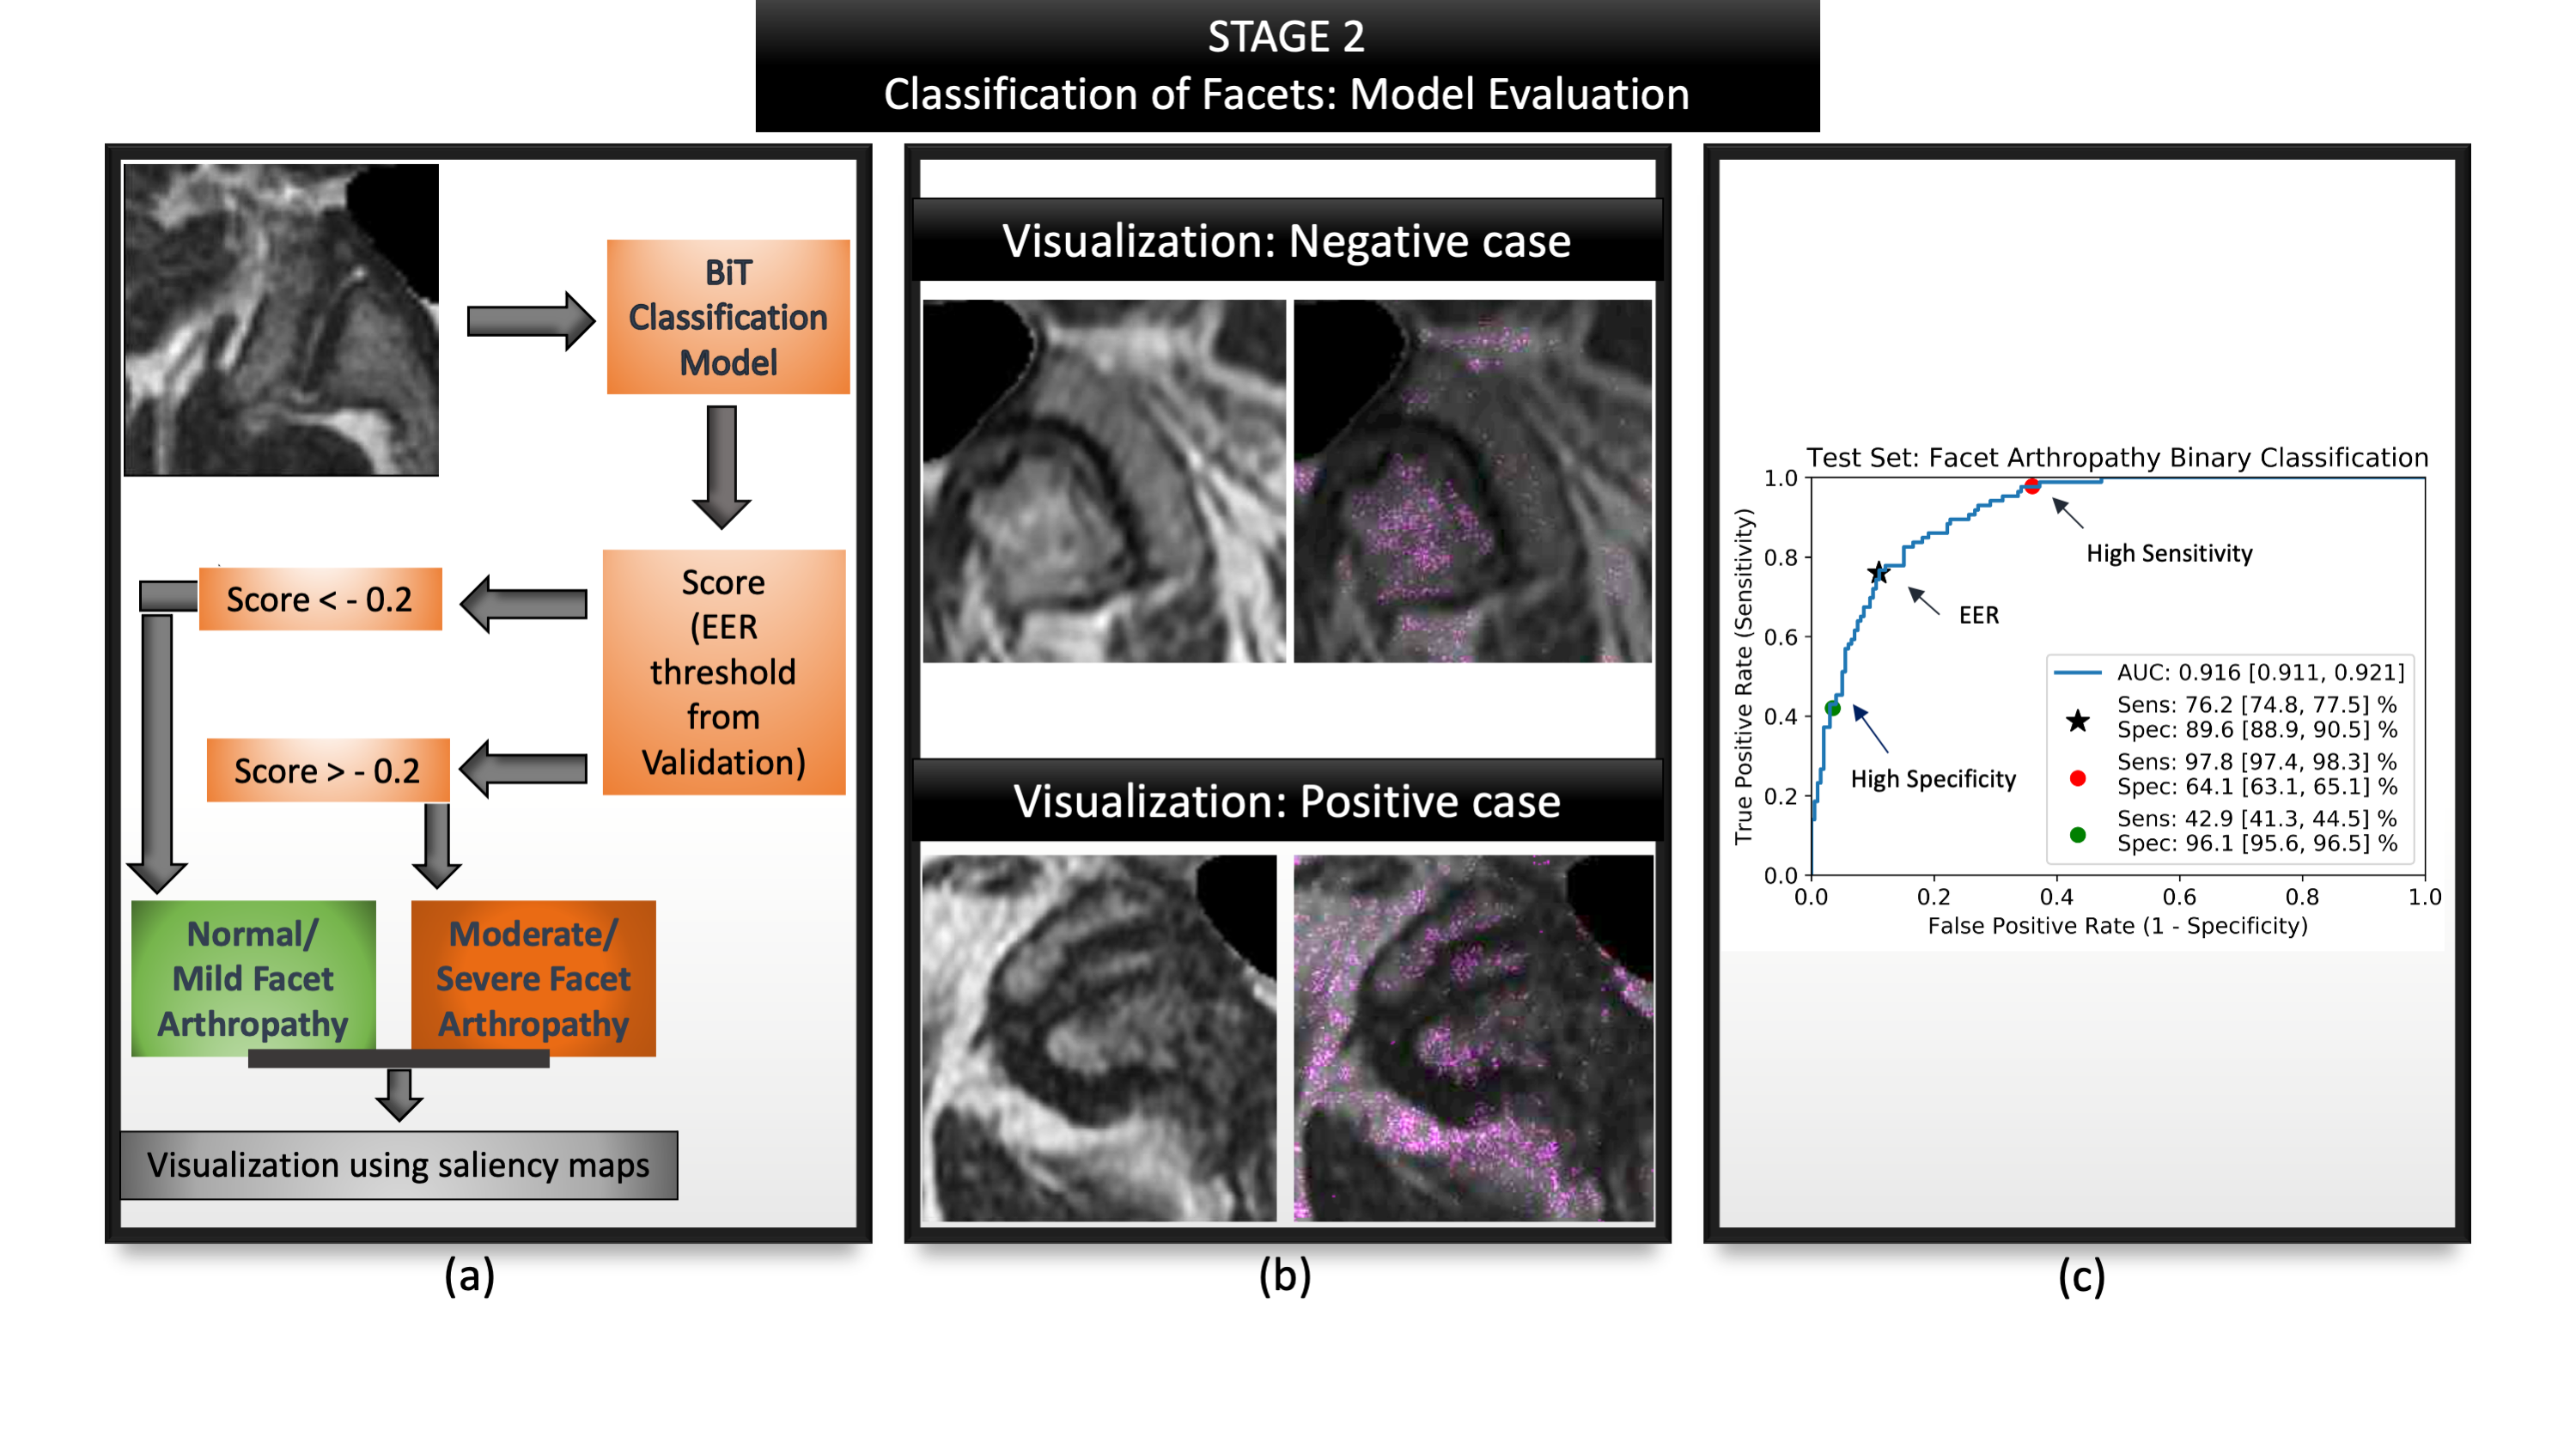
Figure 5: Summarizes the evaluation of second stage: facet classification. (a) Visualizes the entire evaluation pipeline where a patch is passed as input (b) Visualization of the model's predictions via saliency maps shows clinically valuable features being highlighted- image above highlights the superior articular portion of the facet as well as the ligamentum flavum; image below highlights the superior and inferior portions of the facet, synovium; (c) ROC curve highlighting AUC, sensitivity and specificity at various operating points along with their confidence intervals.