4050
Synovial Fluid Suppressed 3D T1ρ Mapping of Knee Cartilage using Deep Learning1Department of Medical Physics, Memorial Sloan Kettering Cancer Center, New York, NY, United States, 2Philips Healthcare, Andover, MA, United States, 3Department of Radiology, Albert Einstein College of Medicine and Montefiore Medical Center, Bronx, NY, United States
Synopsis
3D T1ρ mapping is a promising technique for quantitative assessment of biochemical changes in knee cartilage. However, synovial fluid, if not suppressed, may compromise T1ρ quantification, particularly in clinical conditions like osteoarthritis where cartilage is usually irregular and synovial fluid is increased. A long-T2-selective inversion approach can be used to suppress the synovial fluid signal at the cost of increased scan time by 50%. This study demonstrated that deep learning can be used to effectively eliminate synovial fluid from T1ρ data acquired without active fluid suppression, potentially leading to improved T1ρ quantification of knee cartilage accuracy without adding scan time.
INTRODUCTION
Quantitative T1ρ mapping has shown to provide promising imaging biomarkers for early detection of biochemical changes in knee cartilage.1 Magnetization-Prepared Angle-Modulated Partitioned k-Space Spoiled Gradient Echo Snapshots (3D MAPSS) is a fast imaging technique for high resolution quantitative T1ρ mapping. Recent studies suggest that the 3D T1ρ MAPSS sequence has good reproducibility across different MR systems at different sites.2 However, the signal from synovial fluid (SF), if not suppressed, can potentially undermine T1ρ quantification, particularly in clinical conditions where SF increases near cartilage. Notably, SF contaminations prevent reliable evaluation of the superficial layer of the cartilage, which is the area of concern in early stage of osteoarthritis (OA). A long-T2-selective inversion (LT2SI) approach has been proposed to eliminate the contamination of SF to knee cartilage T1ρ quantification at the cost of increased scan time by 50%.3 The additional time penalty needed for SF suppression during imaging will increase overall healthcare cost, reduce patient comfort, and potentially compromise quantitative accuracy due to patient motion. The purpose of this study was to use deep learning to remove SF from T1ρ data acquired without active fluid suppression during imaging.METHODS
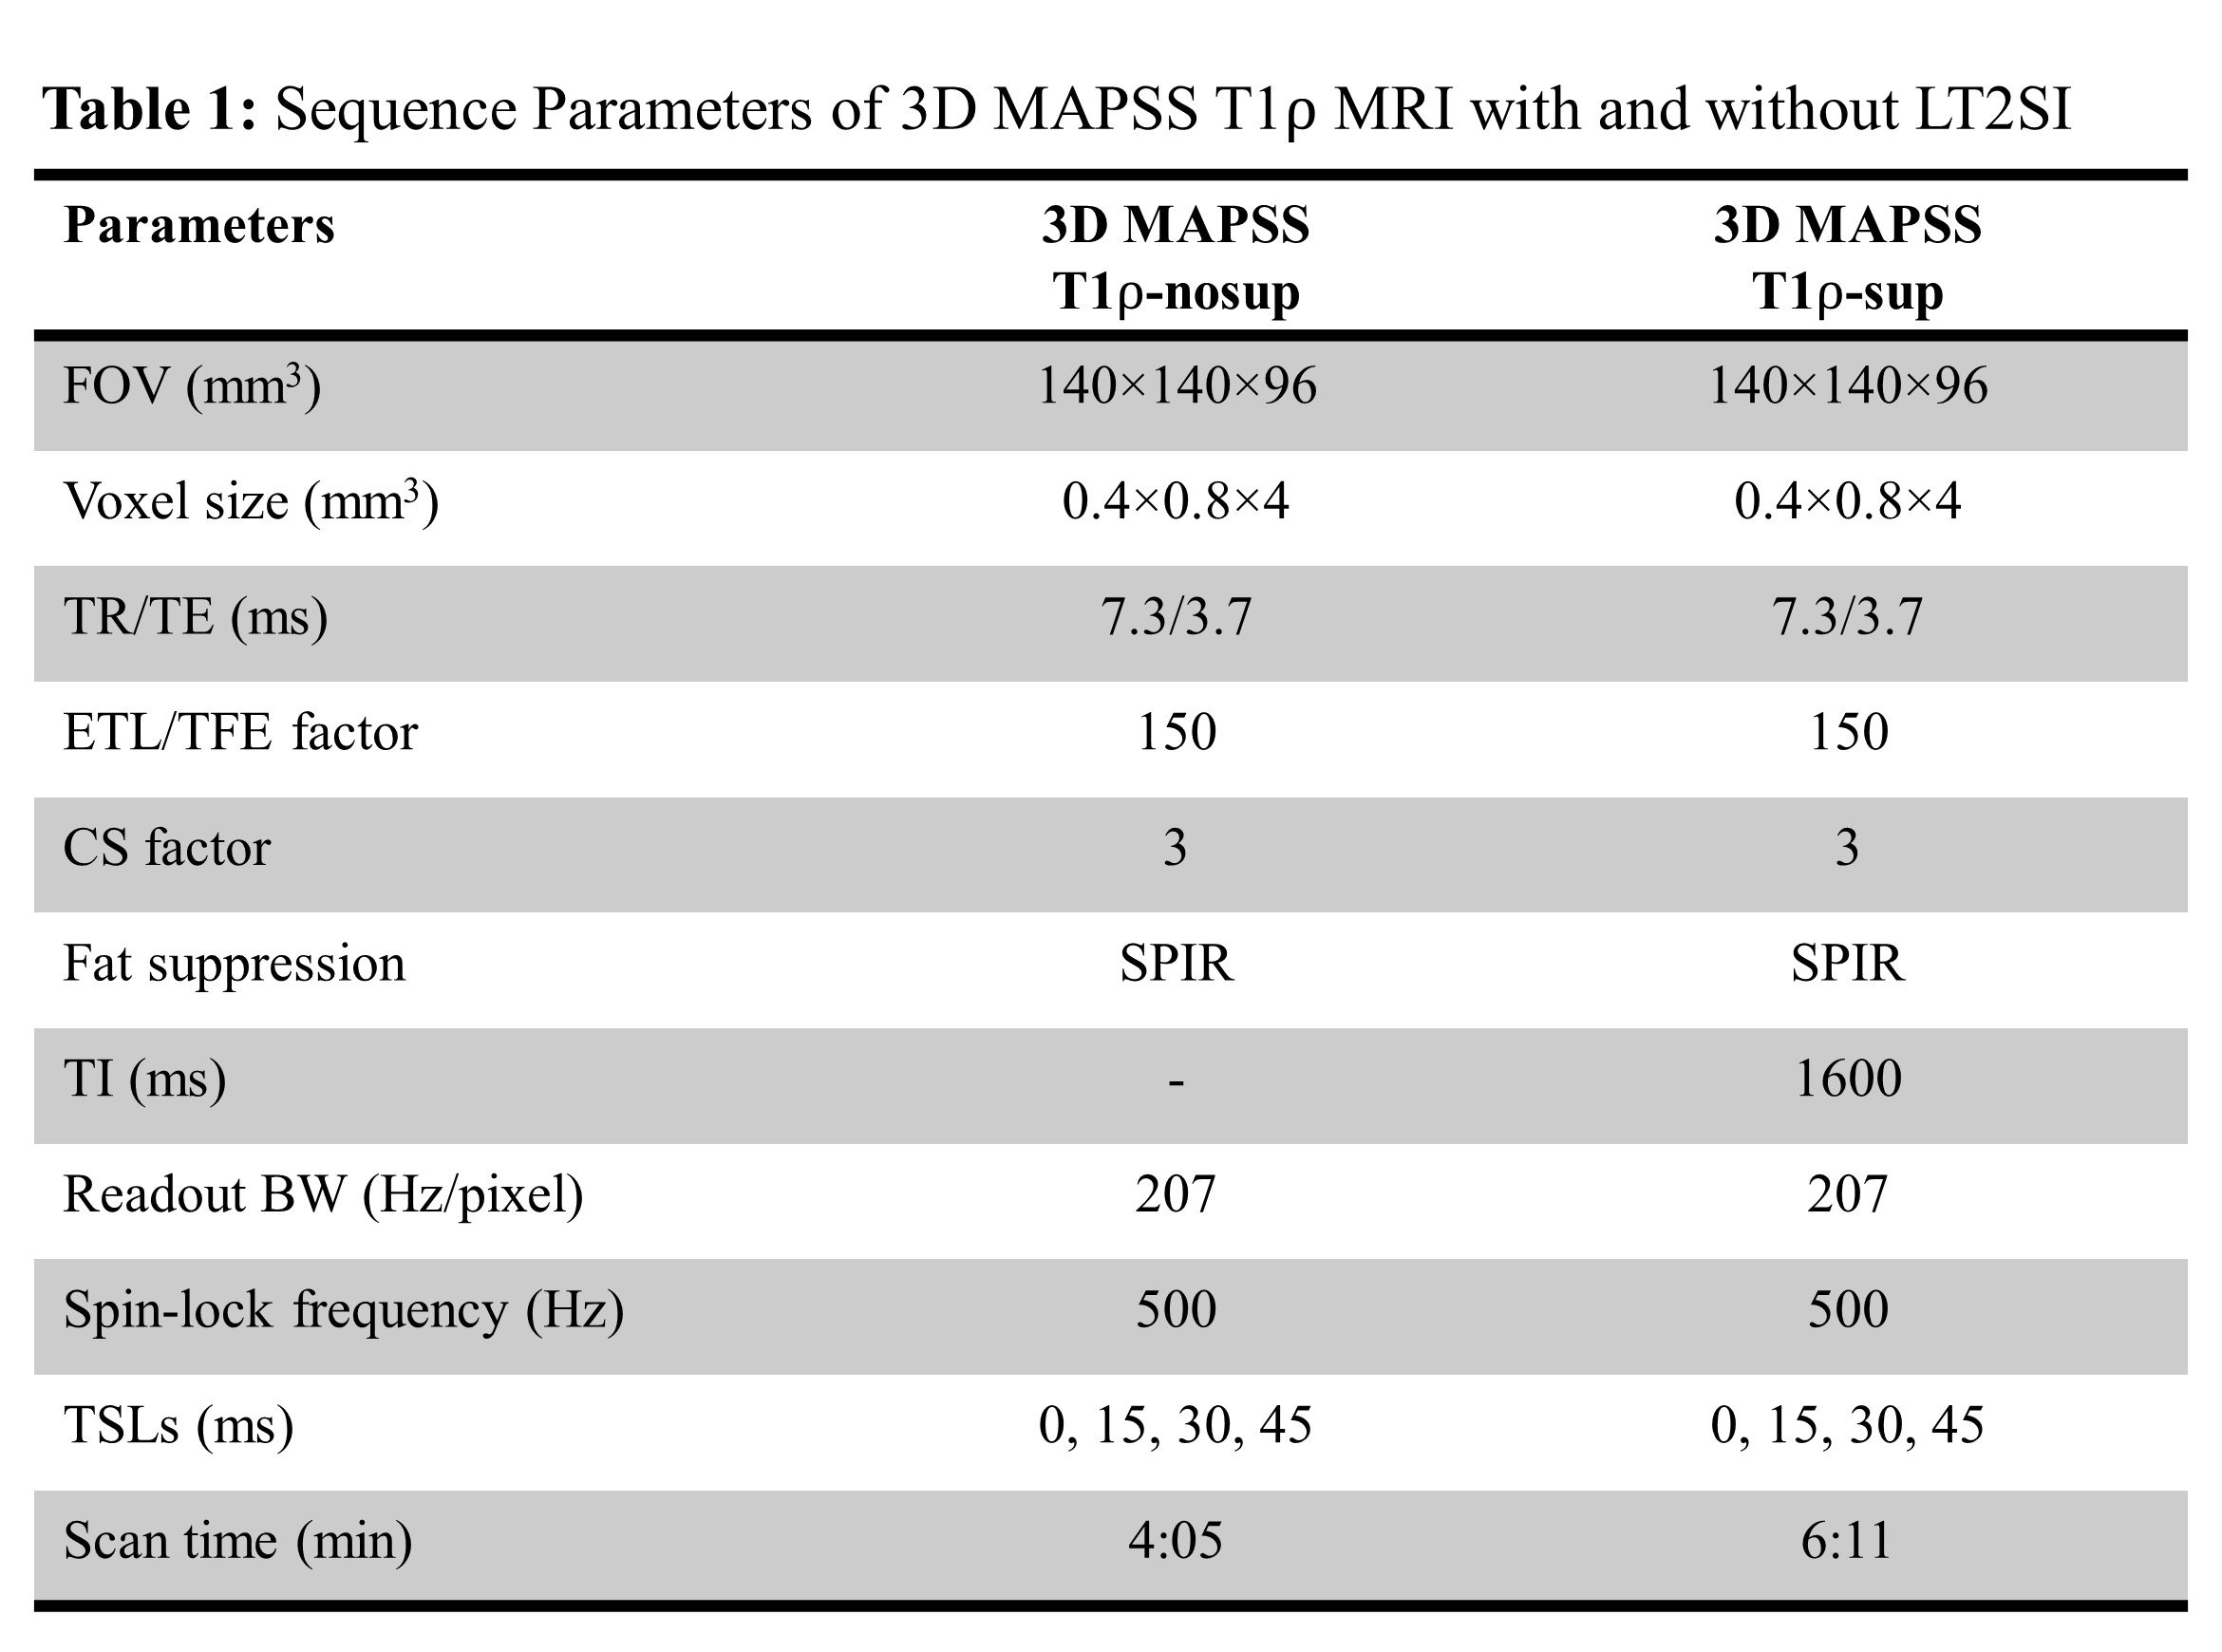
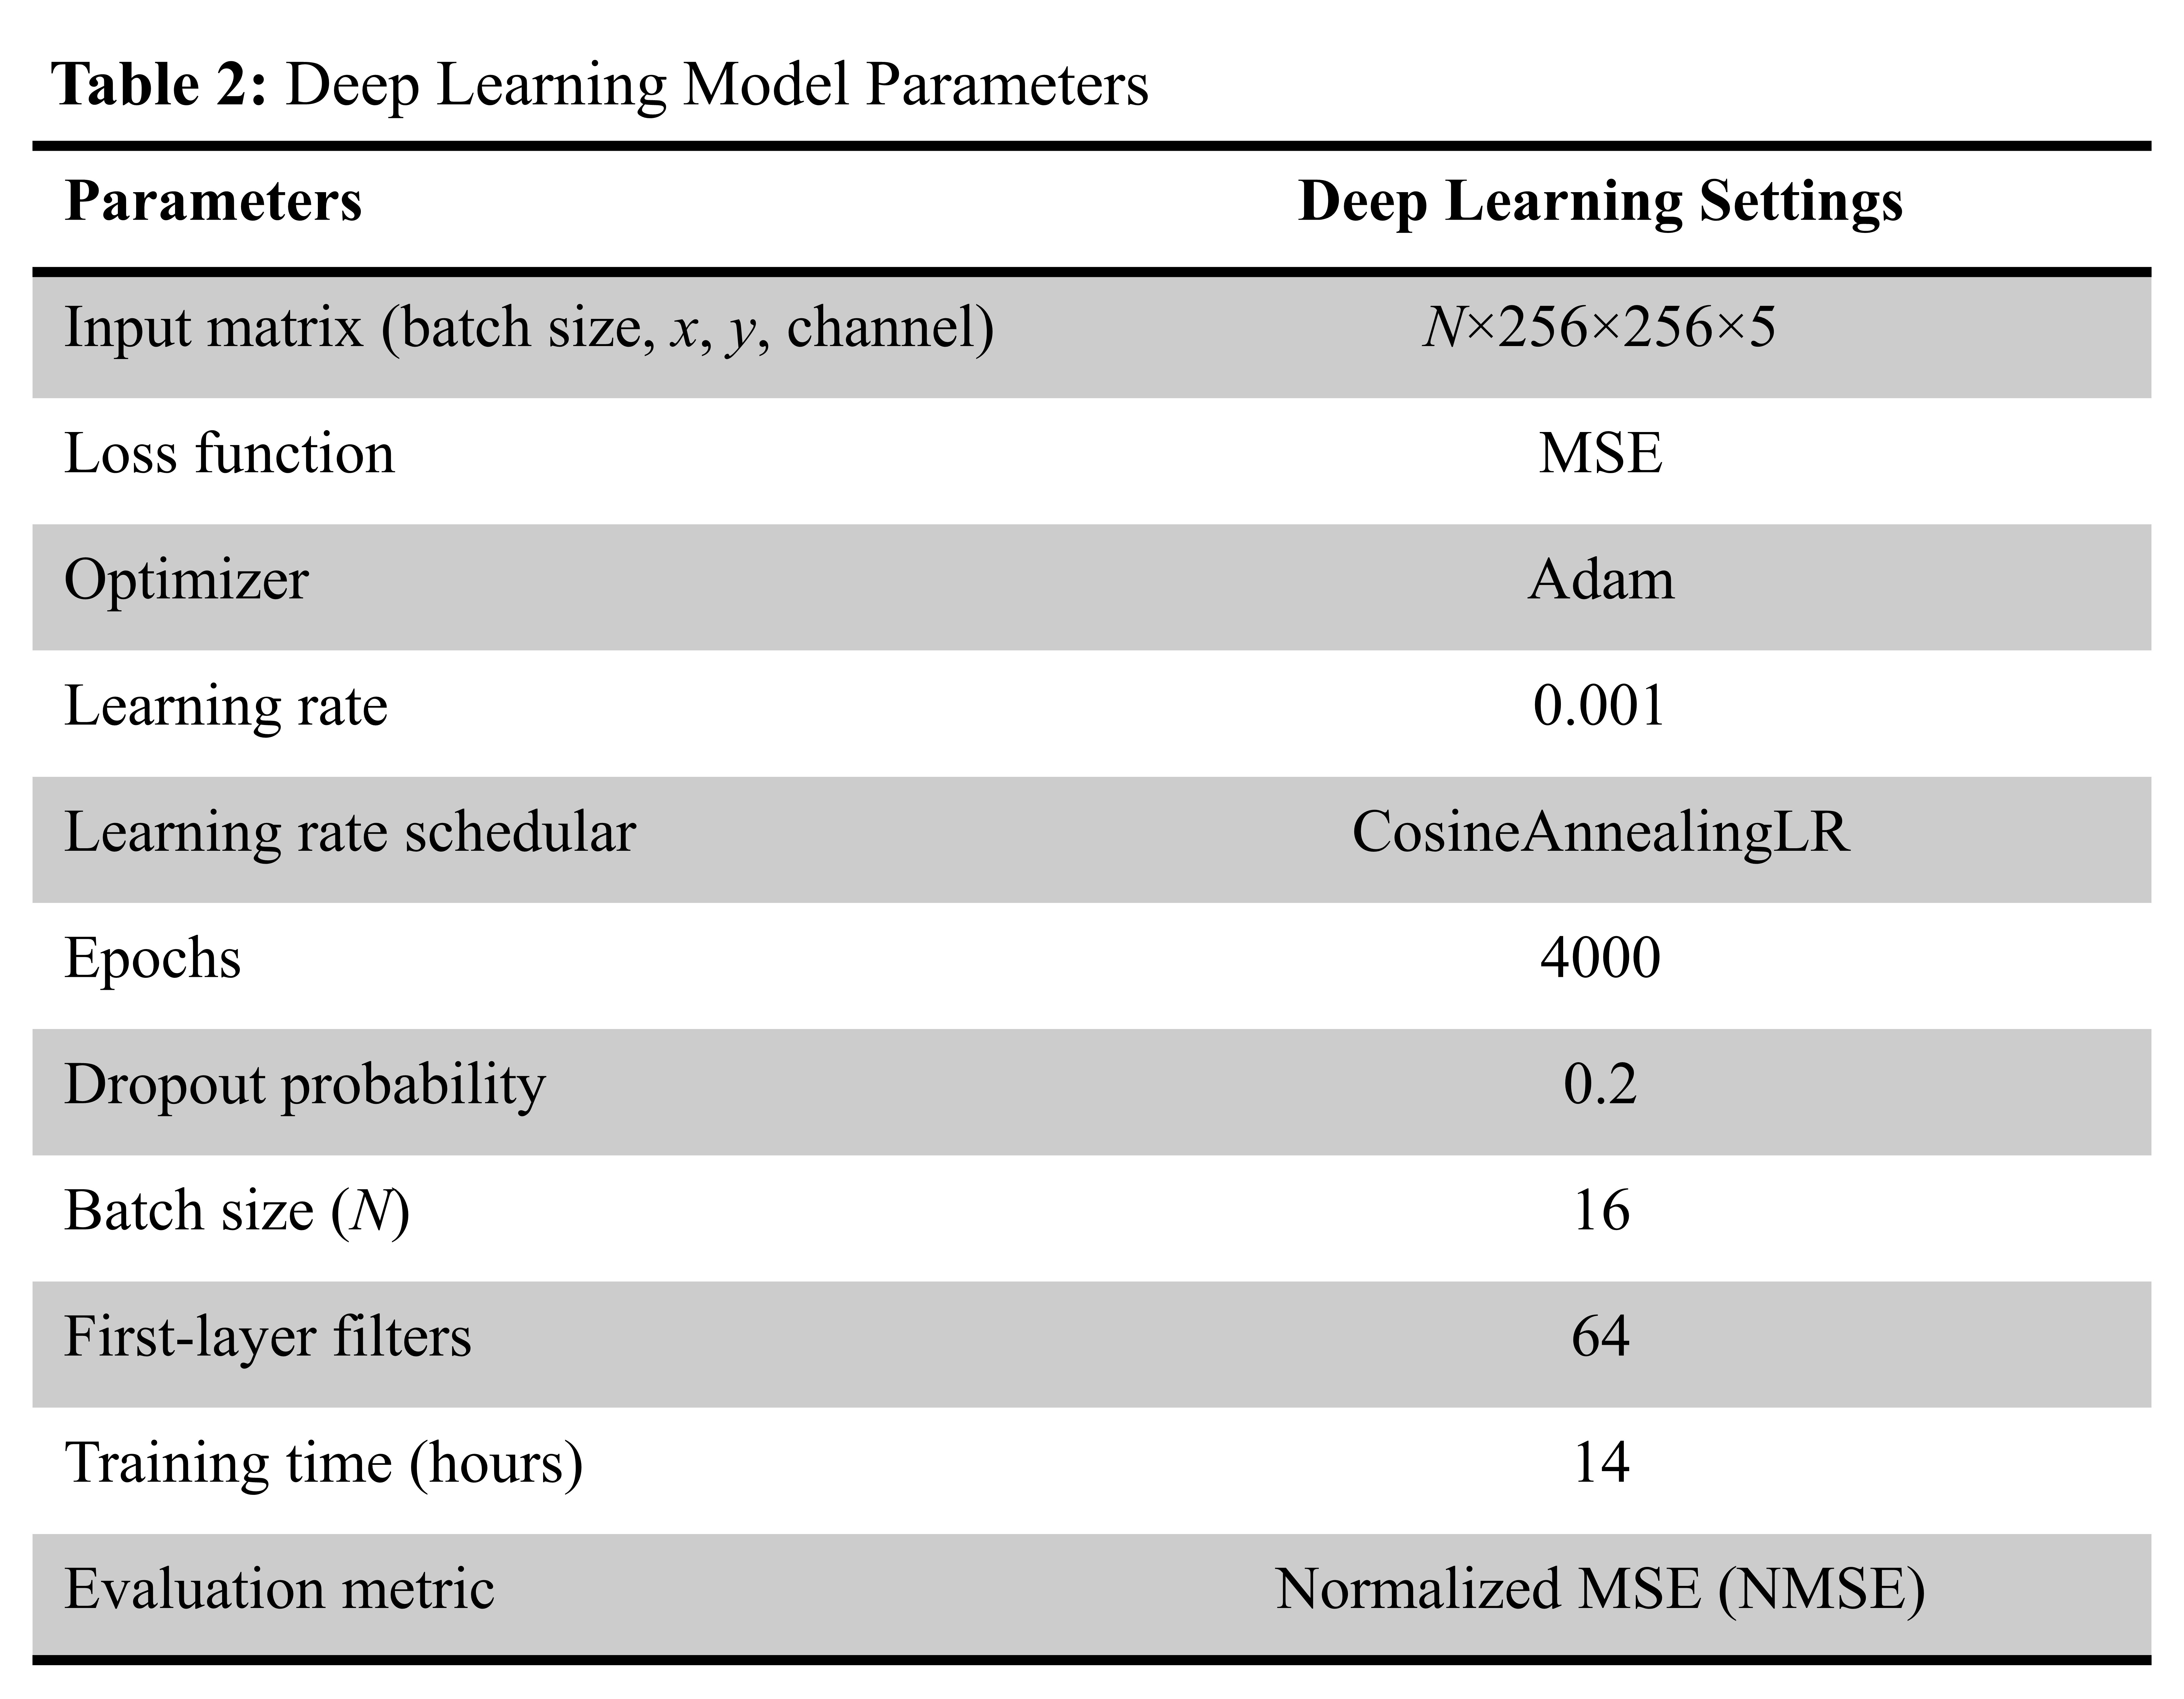
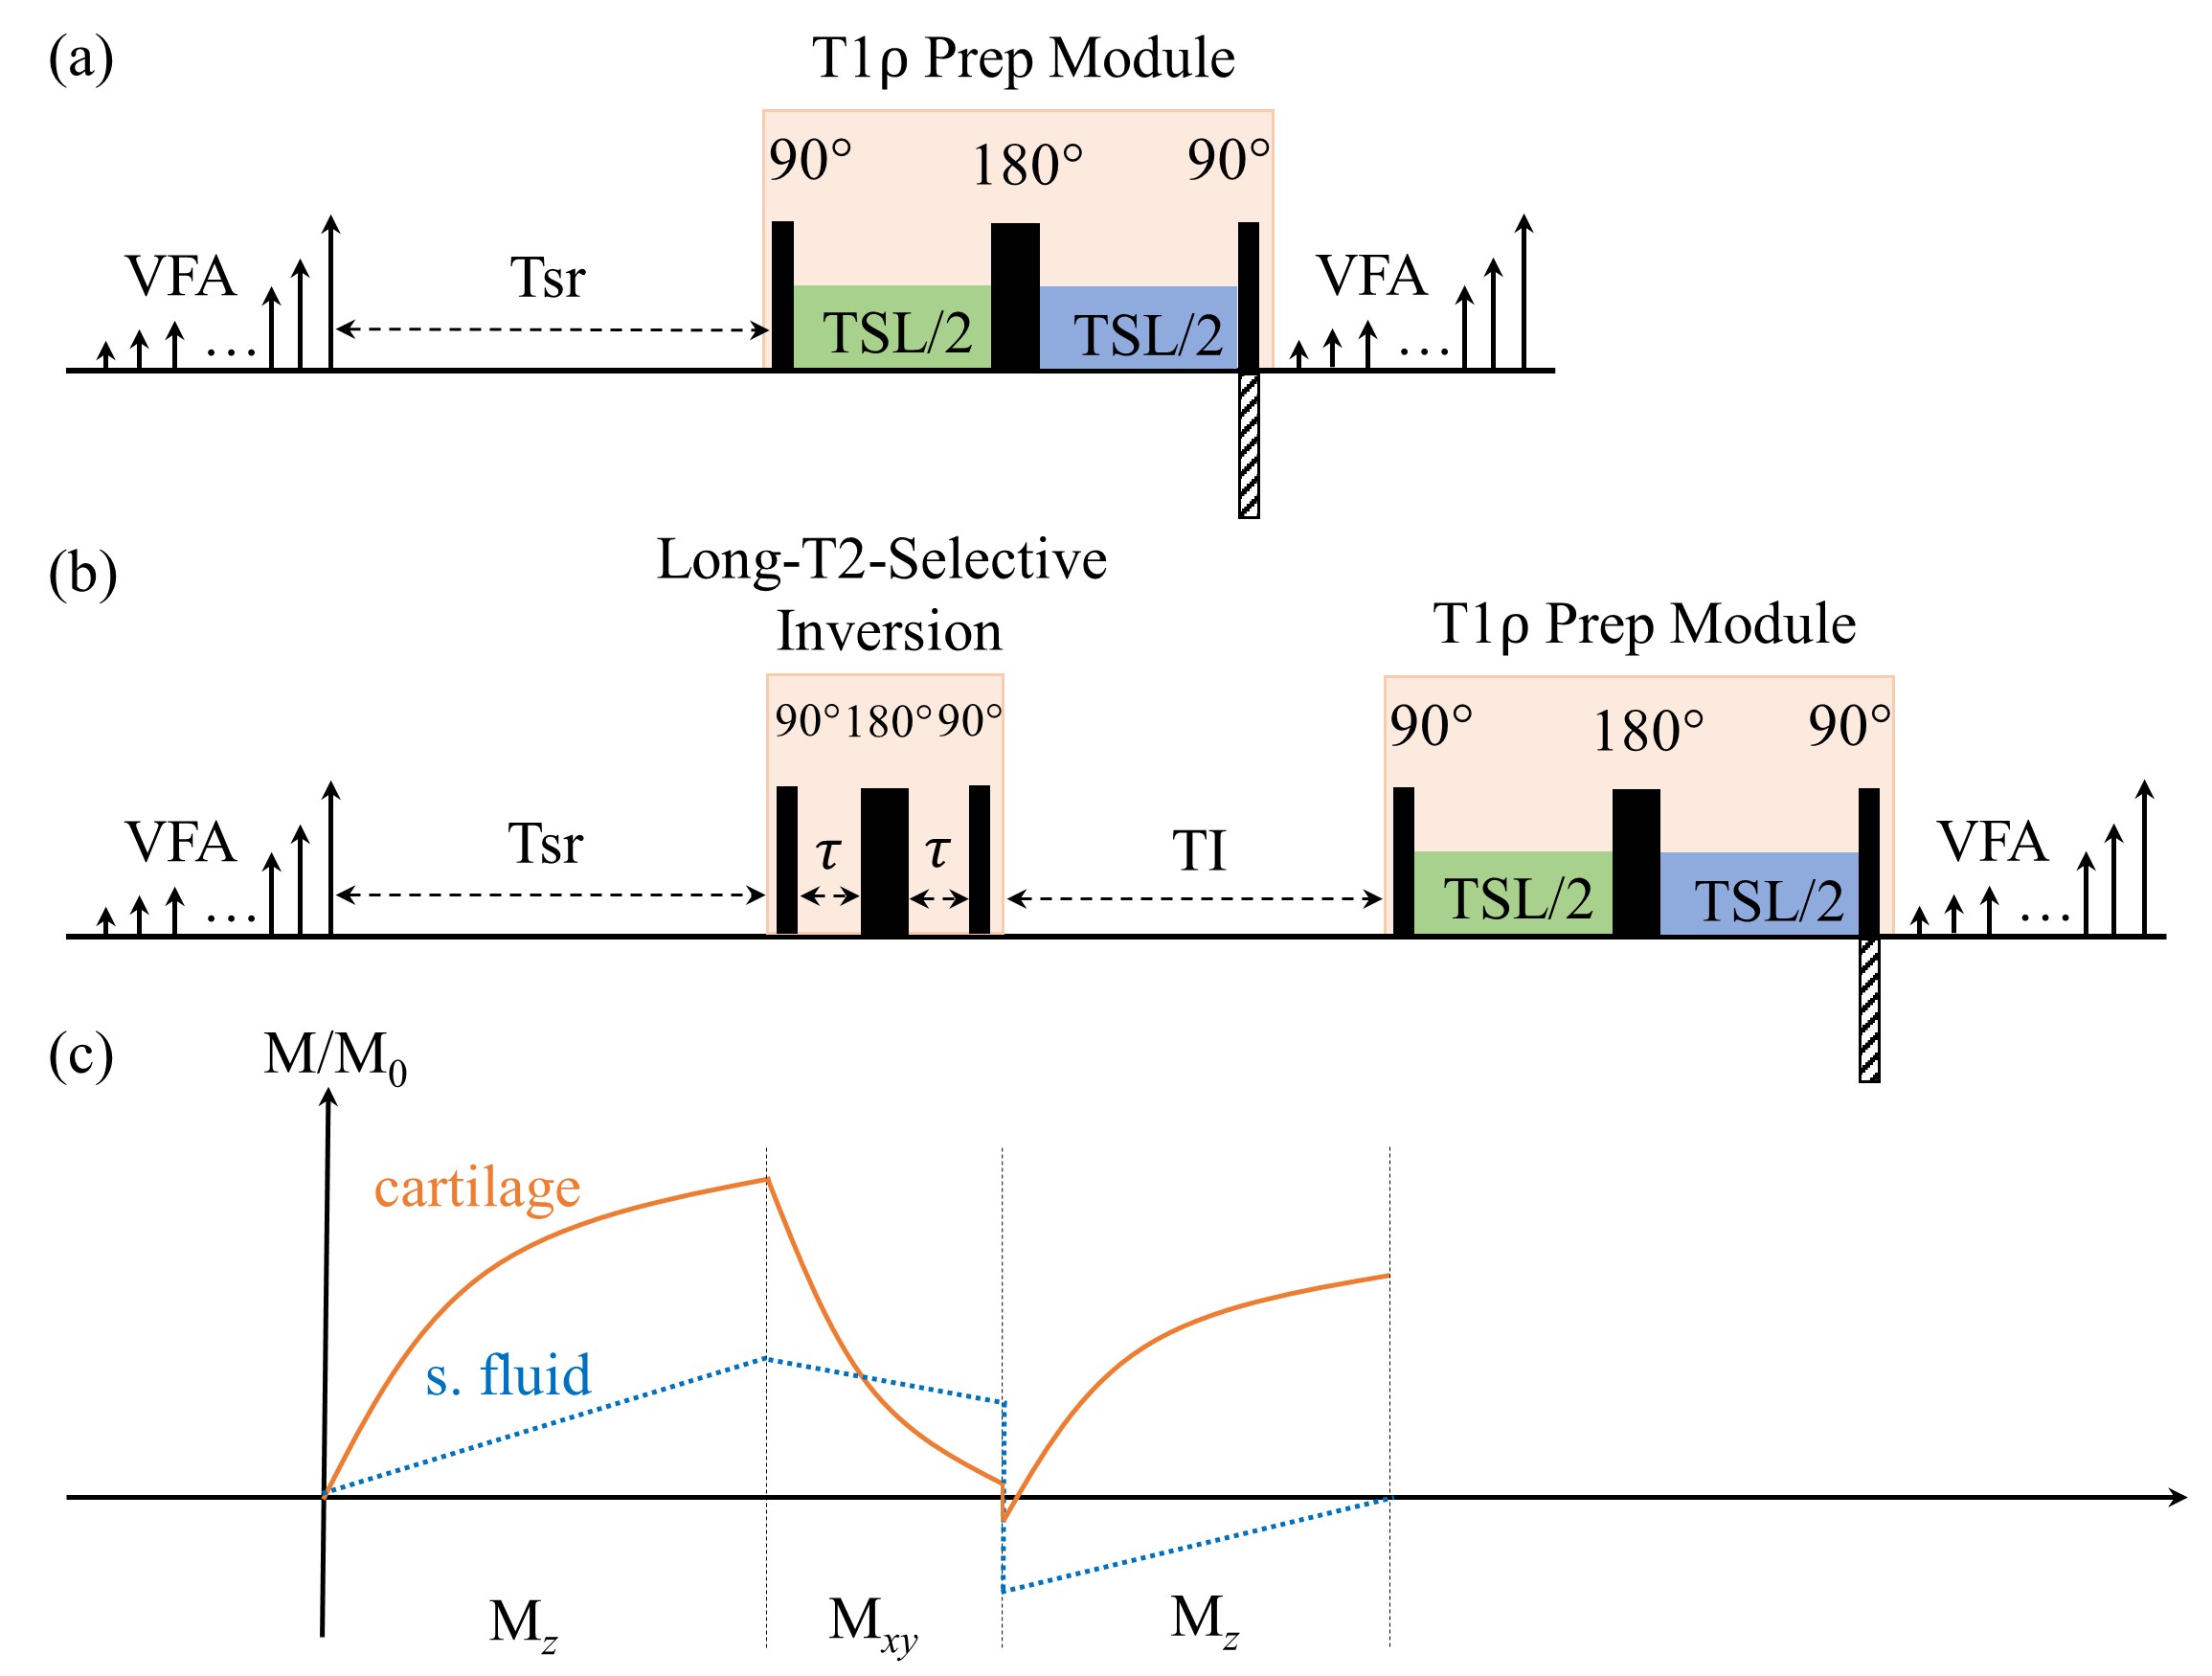
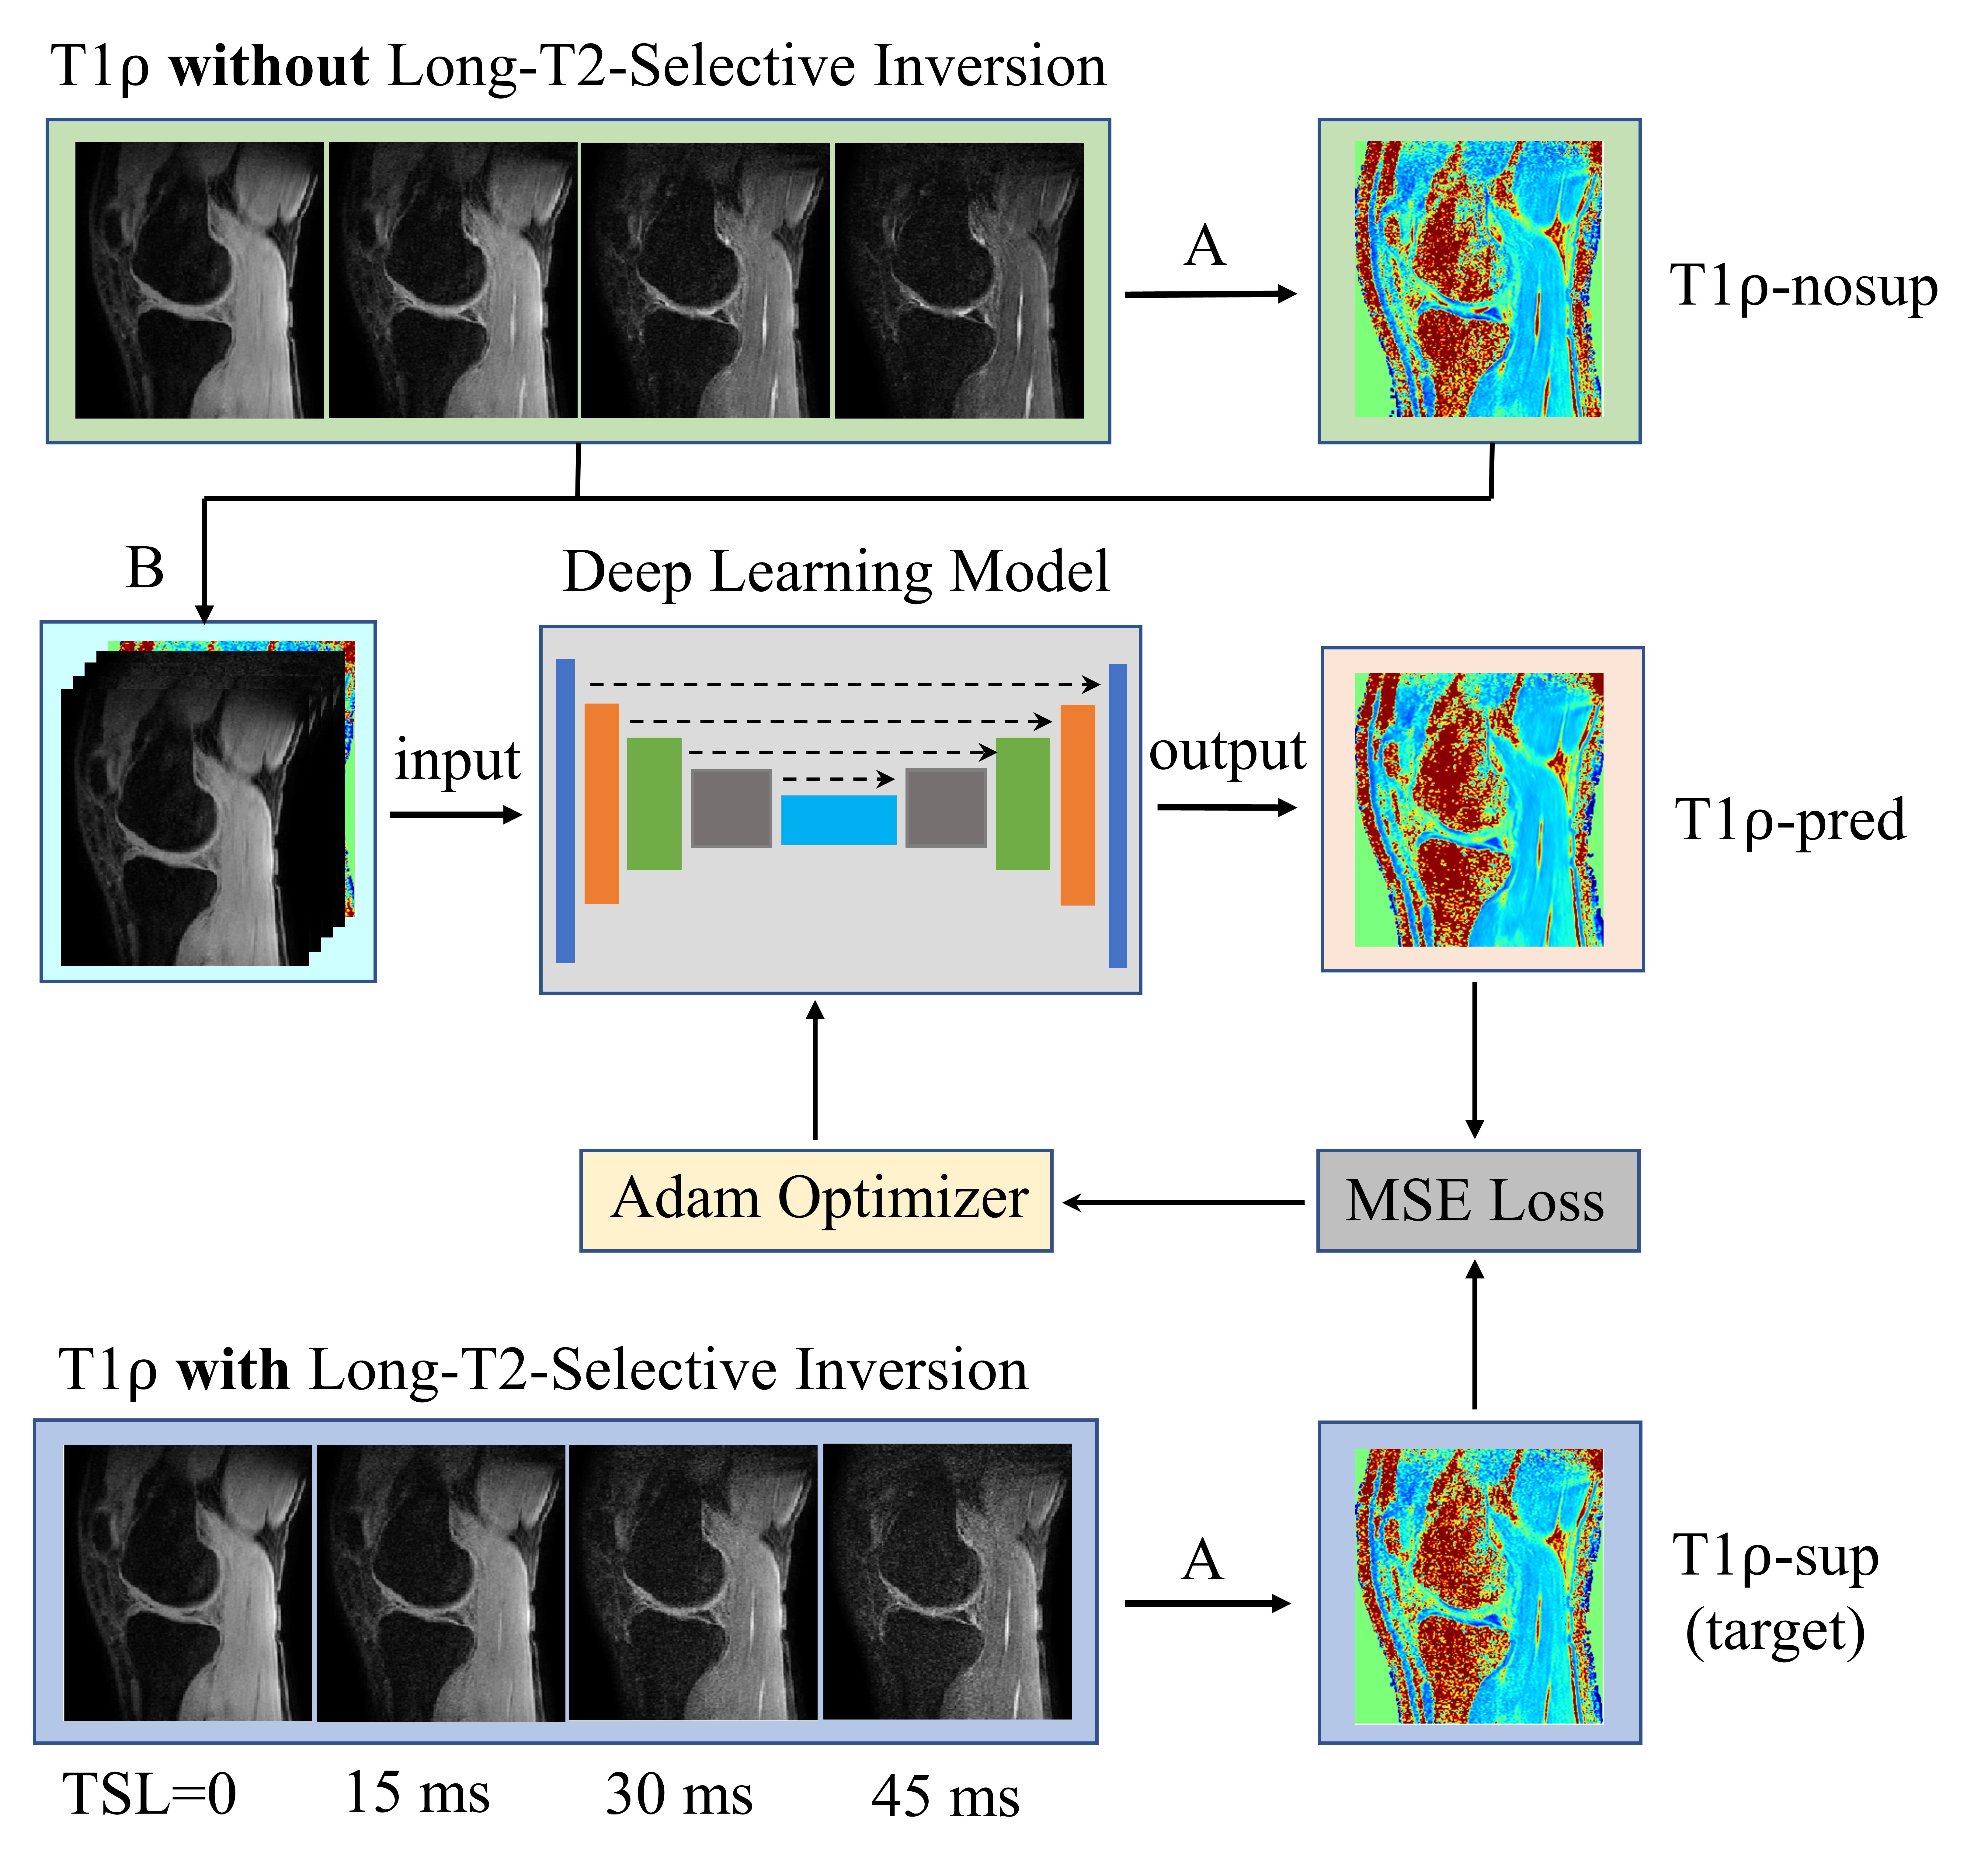
Figure 1 illustrates the 3D MAPSS T1ρ MRI sequence without (a) and with (b) the LT2SI module (90°-τ -180°- τ -90°), respectively.4 The inversion time (TI) was optimized to null SF signal before the T1ρ preparation module defined as 90°-TSL/2 -180°-TSL/2-90° (TSL: time of spin lock). Eight volunteers were scanned using a 16 channel T/R knee coil on a 3T clinical scanner (Ingenia Elition, Philips Healthcare, The Netherlands). For each subject, 3D MAPSS T1ρ imaging with full coverage of the knee joint in a sagittal view was performed with and without the LT2SI module (see Table 1 for detailed sequence parameters). The study was approved by local institutional review board and patient consent was obtained from all subjects. Two 4D knee datasets (x×y×z×TSL: 350×175×48×4) with and without SF suppression were available for each subject. The preprocessing step included co-registration of the 3D volumes across the TSL dimension and resize of the datasets to 256×256×48×4. Figure 2 shows the workflow for using deep learning to obtain SF suppressed T1ρ maps from scans without LT2SI. Firstly, two sets of 3D T1ρ maps [x×y×z] were calculated for each subject using conventional non-linear exponential curve fitting. The T1ρ map without SF suppression (T1ρ-nosup) was then combined with the four TSL source images to form a five-channel dataset as input to the deep learning model. The T1ρ map obtained with LT2SI (T1ρ-sup) was used as the target image (ground truth). The deep learning model consisted of an encoder and decoder with skip connections to facilitate feature propagation. The loss function was defined as mean squared error (MSE) = $$$ \frac{1}{n}\sum_{i=1}^n(y_{i}-\widetilde{y}_{i})$$$, where $$$y_{i}$$$ and $$$\widetilde{y}_{i}$$$ are T1ρ maps of the target and model prediction. Table 2 shows the parameter settings of the deep learning model. Datasets of seven subjects were used for training (80%) and validation (20%), and the remaining subject was used as unseen dataset for testing. Normalized mean squared error (NMSE) was used to evaluate the model performance on the test dataset. All deep learning experiments were performed on a workstation equipped with NVIDIA GTX 1080Ti GPU, Intel Core i7-8700K CPU, and 32GB RAM.RESULTS
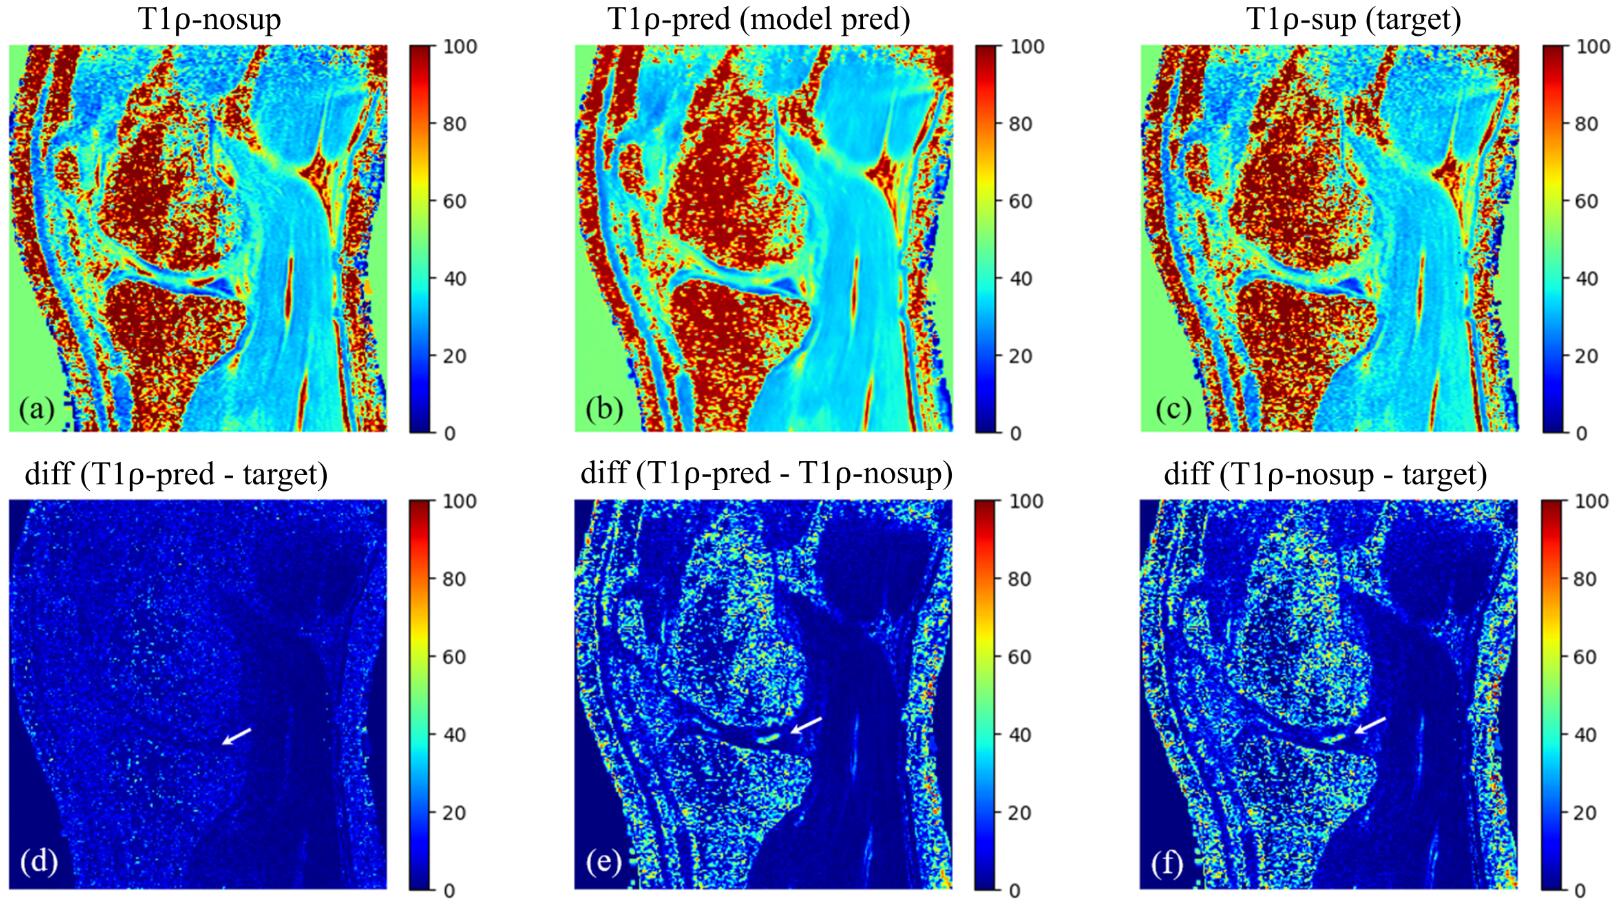
Figure 3 shows example images of T1ρ-nosup (a) and T1ρ-sup (c) from conventional curve fitting method, along with the T1ρ map predicted by the deep learning model (b). Distinctively high T1ρ values from SF can be easily identified near the knee cartilage on the T1ρ-nosup map (a), while they were much reduced on the T1ρ maps of the T1ρ-sup (c) and deep learning prediction (b). Pairwise difference images (d-f) were calculated to further illustrate the performance of deep learning model in suppressing SF (white arrows). For the test subject, the NMSE was reduced from 0.1310 (T1ρ-nosup) to 0.1140 (model prediction), using the target (T1ρ-sup) as reference images.DISCUSSION
Accurate measurement of T1ρ values in knee cartilage is critical for quantitative assessment of early changes in patients with OA. The T1ρ method must have high sensitivity and accuracy to detect a change of T1ρ values at the level of 11-14% to suggest a true change in cartilage composition.5 It is well known that OA is usually accompanied by increased SF with T1ρ value 10 times larger than that of the cartilage.6 If not suppressed, the high T1ρ value of SF may reduce the quantification accuracy of knee cartilage, particularly for voxels at the superficial layer of the cartilage due to partial volume effect and spatial blurring. The LT2SL module has shown to effectively suppress SF on T1ρ maps, but at the cost of increased scan time by 50%. This study demonstrated the feasibility of using deep learning to remove SF from T1ρ-nosup images without additional scan time. Further studies are warranted to investigate the influence of SF on T1ρ quantification in different cartilage segmentations in a larger patient cohort.CONCLUSION
Deep learning method can be used to obtain synovial fluid suppressed 3D T1ρ mapping of knee cartilage without adding scan time. This will help improve T1ρ quantification accuracy and facilitate its clinical adoption.Acknowledgements
None.References
1. Prasad AP, Nardo L, Schooler J, Joseph GB, Link TM. T1ρ and T2 relaxation times predict progression of knee osteoarthritis. Osteoarthritis Cartilage. 2013; 21(1):69-76.
2. Kim J, Mamoto K, Lartey R, Xu K, Nakamura K, Shin W, Winalski CS, Obuchowski N, Tanaka M, Bahroos E, Link TM, Hardy PA, Peng Q, Reddy R, Botto-van Bemden A, Liu K, Peters RD, Wu C, Li X. Multi-vendor multi-site T1ρ and T2 quantification of knee cartilage. Osteoarthritis Cartilage. 2020; 28(12):1539-1550.
3. Peng Q, Wu C, Li X, Sperling K. Fast synovial fluid suppressed 3D T1ρ imaging of the knee cartilage on 3T. ISMRM Workshop on Advanced Musculoskeletal MRI: Arthritis and Beyond, Hangzhou, China, September 15-17, 2017.
4. Wong EC, Liu TT, Luh W, Frank LR, Buxton RB. T1 and T2 selective method for improved SNR in CSF-attenuated imaging: T2-FLAIR. Magn Reson Med. 2001; 45(3):529-532.
5. QIBA MSK Biomarker Committee. MR-based cartilage compositional biomarkers (T1ρ, T2) for risk prediction, early diagnosis and monitoring of treatment of degenerative joint disease. Qiba MSK Profile 2020-01-28 (profile publically available at https://qibawiki.rsna.org/index.php/MSK_Biomarker_Ctte).
6. Hoff P, Buttgereit F, Burmester G, Jakstadt M, Baber T, Andreas K, Matziolis G, Perka C, Rohner E. Osteoarthritis synovial fluid activates pro-inflammatory cytokines in primary human chondrocytes. Int Orthop. 2013; 37(1): 145-151.
Figures