4047
Automation of Quantifying Axonal Loss in Patients with Peripheral Neuropathies through Deep Learning Derived Muscle Fat Fraction1Department of Neurology, Wayne State University School of Medicine, Detroit, MI, United States, 2John D. Dingell VA Medical Center, Detroit, MI, United States
Synopsis
Axonal loss determines the final disability in
patients with peripheral neuropathies. Consequently, axonal loss results in
intramuscular fat accumulation. Therefore, measuring muscle fat fraction
through Dixon MRI has been a promising biomarker for monitoring disease
progression. However, the responsiveness is yet to be improved, particularly in
the early phase of the disease. In this study, we developed a deep learning-based
method to automate the quantification of individual muscle fat fraction, which mitigates
the laborious manual segmentations and enables the use of individual muscle fat
fraction as outcome measures to track axonal loss in patients with neuropathies.
Introduction
Peripheral neuropathies are a group of diseases presenting with sensory loss, muscle weakness and atrophy in distal limbs.1 Severity of axonal loss determines the final disabilities in patients with neuropathies.2 Because axonal degeneration results in intramuscular fat accumulation, the degree of fat replacement in denervated muscles has become a promising biomarker for monitoring disease progression.Indeed, volumetric muscle fat fraction (FF) quantified by Dixon MRI has shown an excellent responsiveness over 12-month in patients with Charcot-Marie-Tooth (CMT) type 1A, a common inherited neuropathy.3, 4 However, the responsiveness of volumetric muscle FF could be diluted if only one or a few muscles are denervated, particularly in the early phase of the disease. Therefore, it is reasonable to speculate that FF in individual muscles may provide even better responsiveness. To this end, one needs to segment individual muscles repetitively over time.
Individual muscle segmentation on MRI images is challenging due to their small sizes, irregular shapes, and spatial inhomogeneity on MRI images.5-11 Furthermore, separating a muscle from adjacent muscles often depends on knowledge of anatomy, but not characteristics of MRI images.
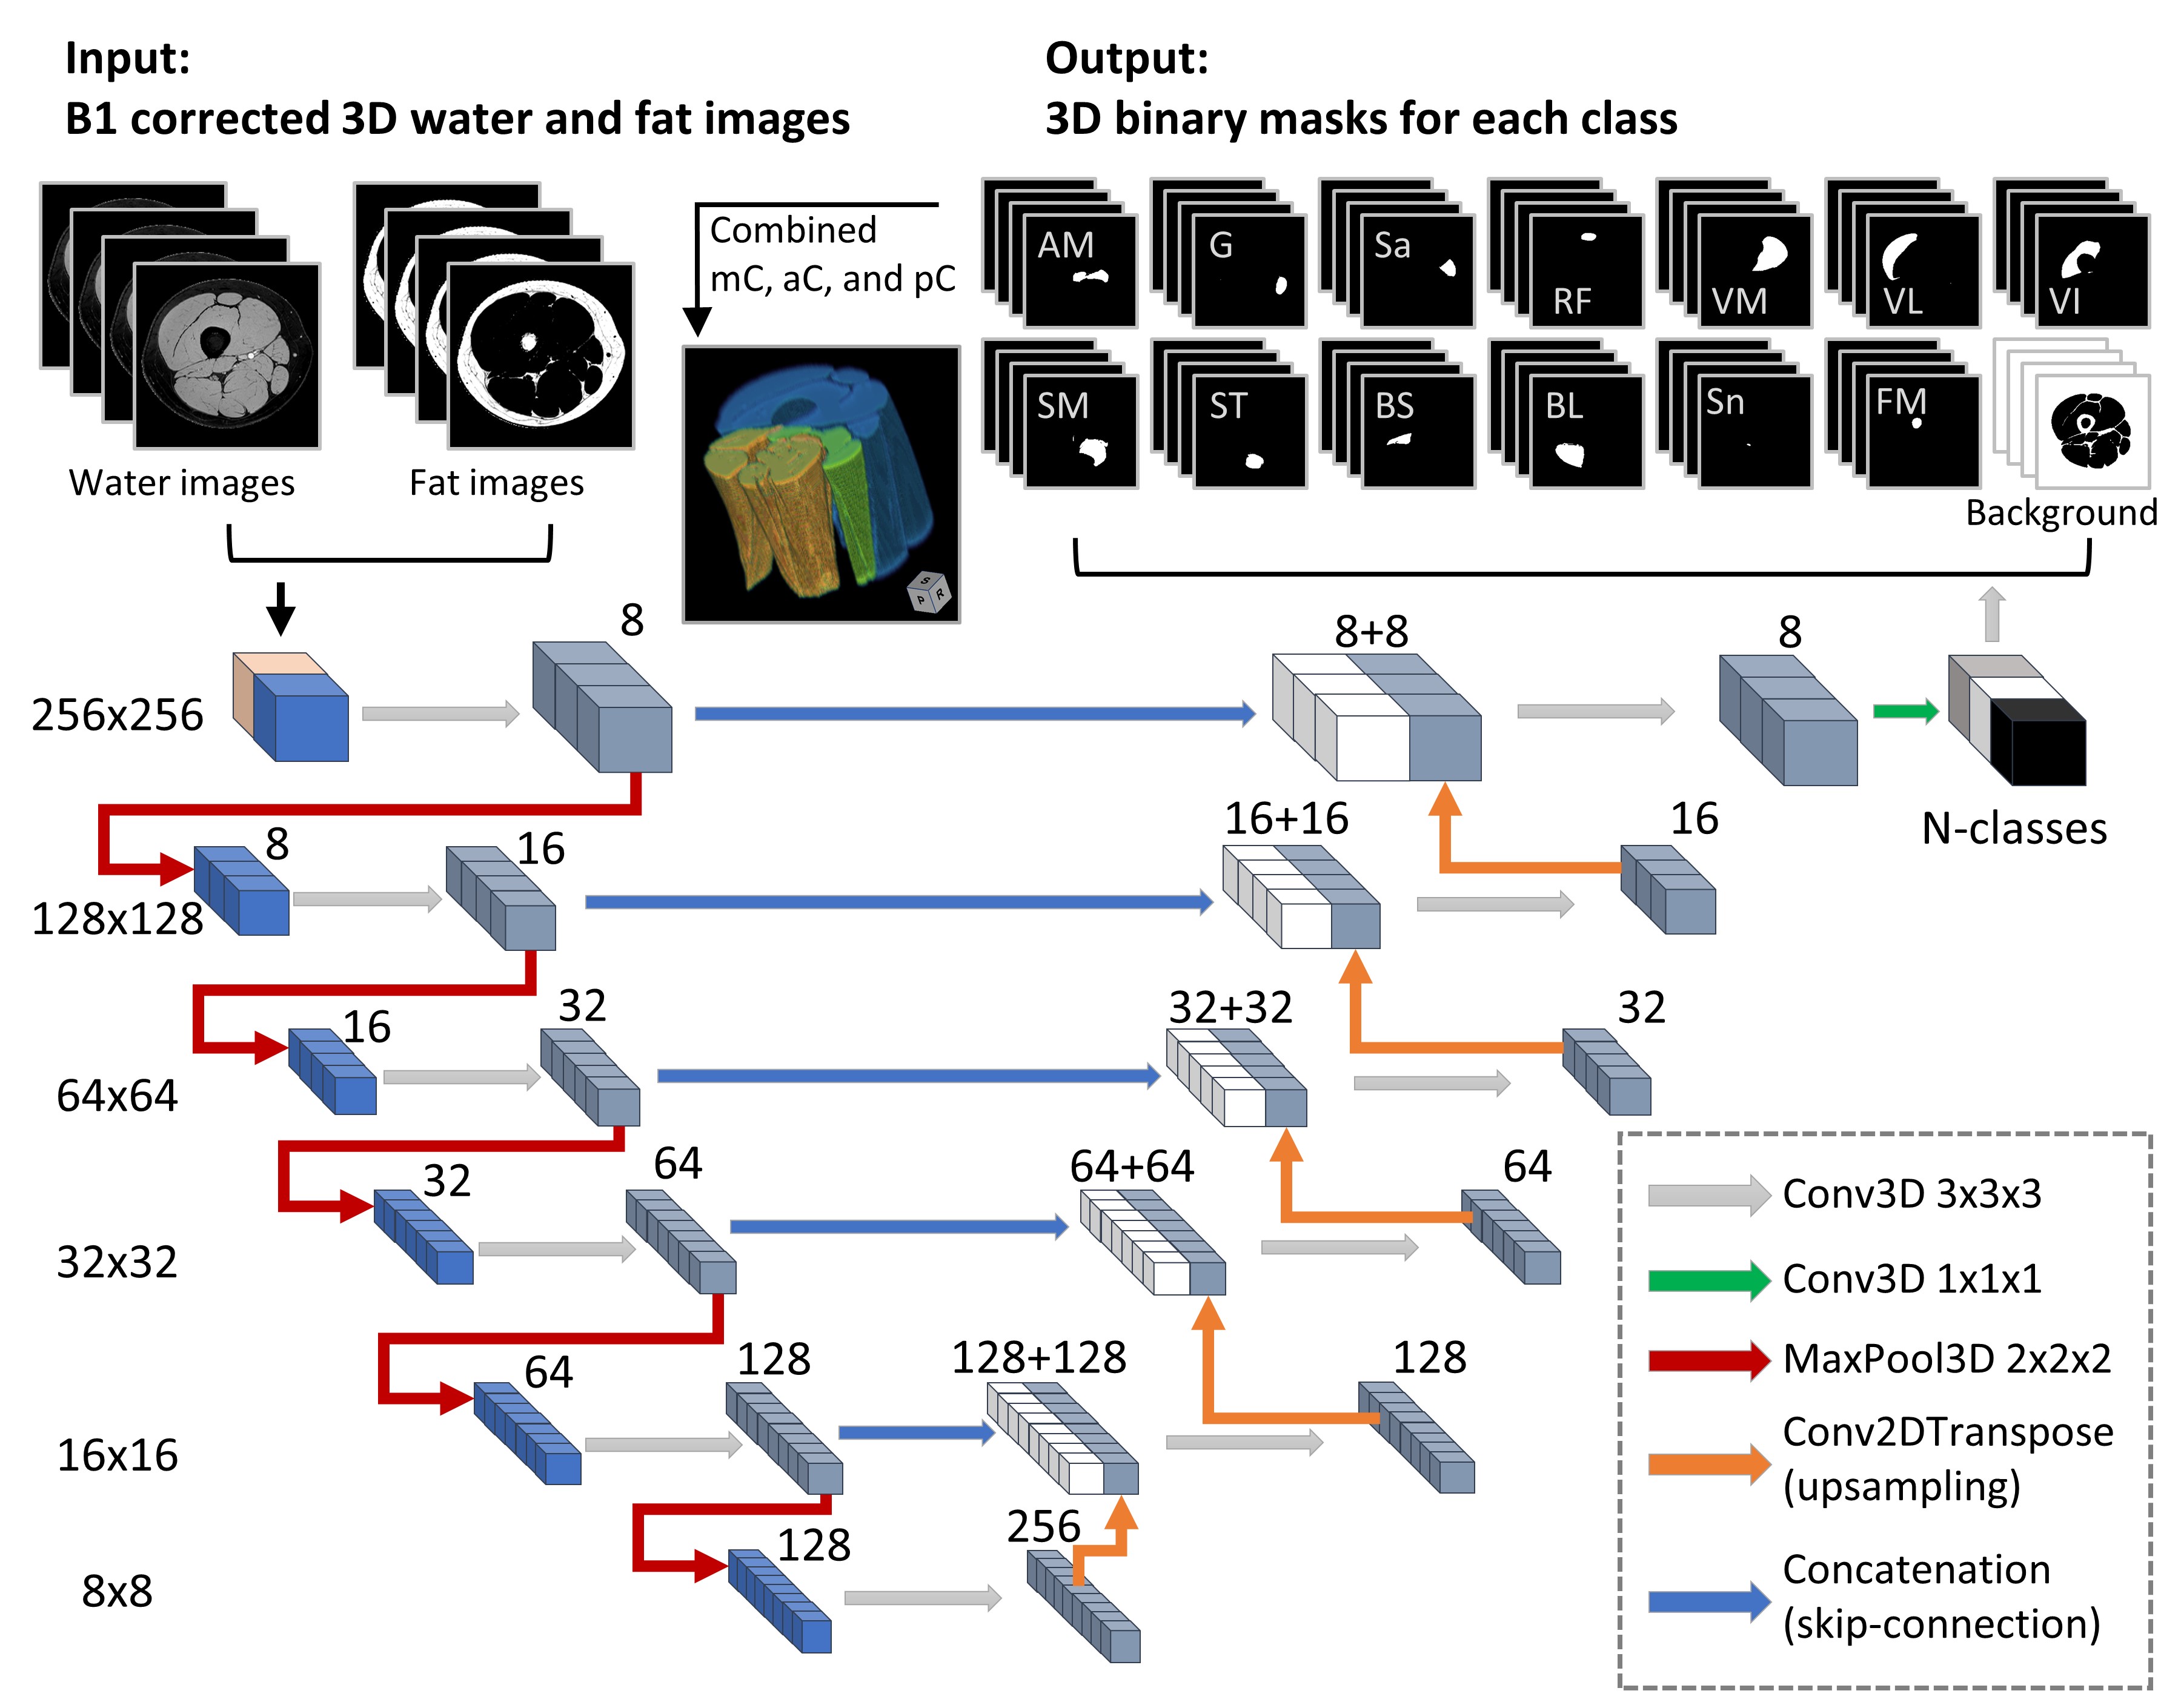
In this study, we leveraged a large set of manually segmented individual muscle images, and developed a supervised deep learning-based model using the U-Net architecture12 to automate the quantification of individual muscle FF in patients with neuropathies.
Methods
Subjects: The study enrolled 19 healthy volunteers and 24 patients with polyneuropathies. It was approved by local IRB. Written consent was acquired from each participant.Data acquisition: Participant’s right leg was examined on a 3T Siemens Verio scanner at mid-thigh and mid-calf levels as previously described.13 We collected data from 40 thighs and 21 calves from the 43 participants.
Data processing: An established two-point Dixon method was used for fat/water decomposition.14 Then, a FF image was created using FF=F/(W+F)×100. Two 3D gradient echo scans were also processed using a variable flip angle T1 mapping algorithm15 to extract B1+ and B1- maps which were used to correct spatial inhomogeneity on the water and fat images.
Manual segmentation: Three independent raters manually segmented muscles on the water image using the SPIN software. We also labeled bone marrows on the fat image, the sciatic and tibial nerves on the water image.
Automatic segmentation: As shown in Figure 1, a 3D U-Net model was implemented using open-source library Keras with Tensorflow backend.12, 16, 17 All subjects were randomly enrolled into either training (nthigh=23; ncalf=10) or testing group (nthigh=17; ncalf=11). Training was performed with an Adam Optimizer and learning rate 1 × 10⁻⁵; and stopped improving after 50 epochs.
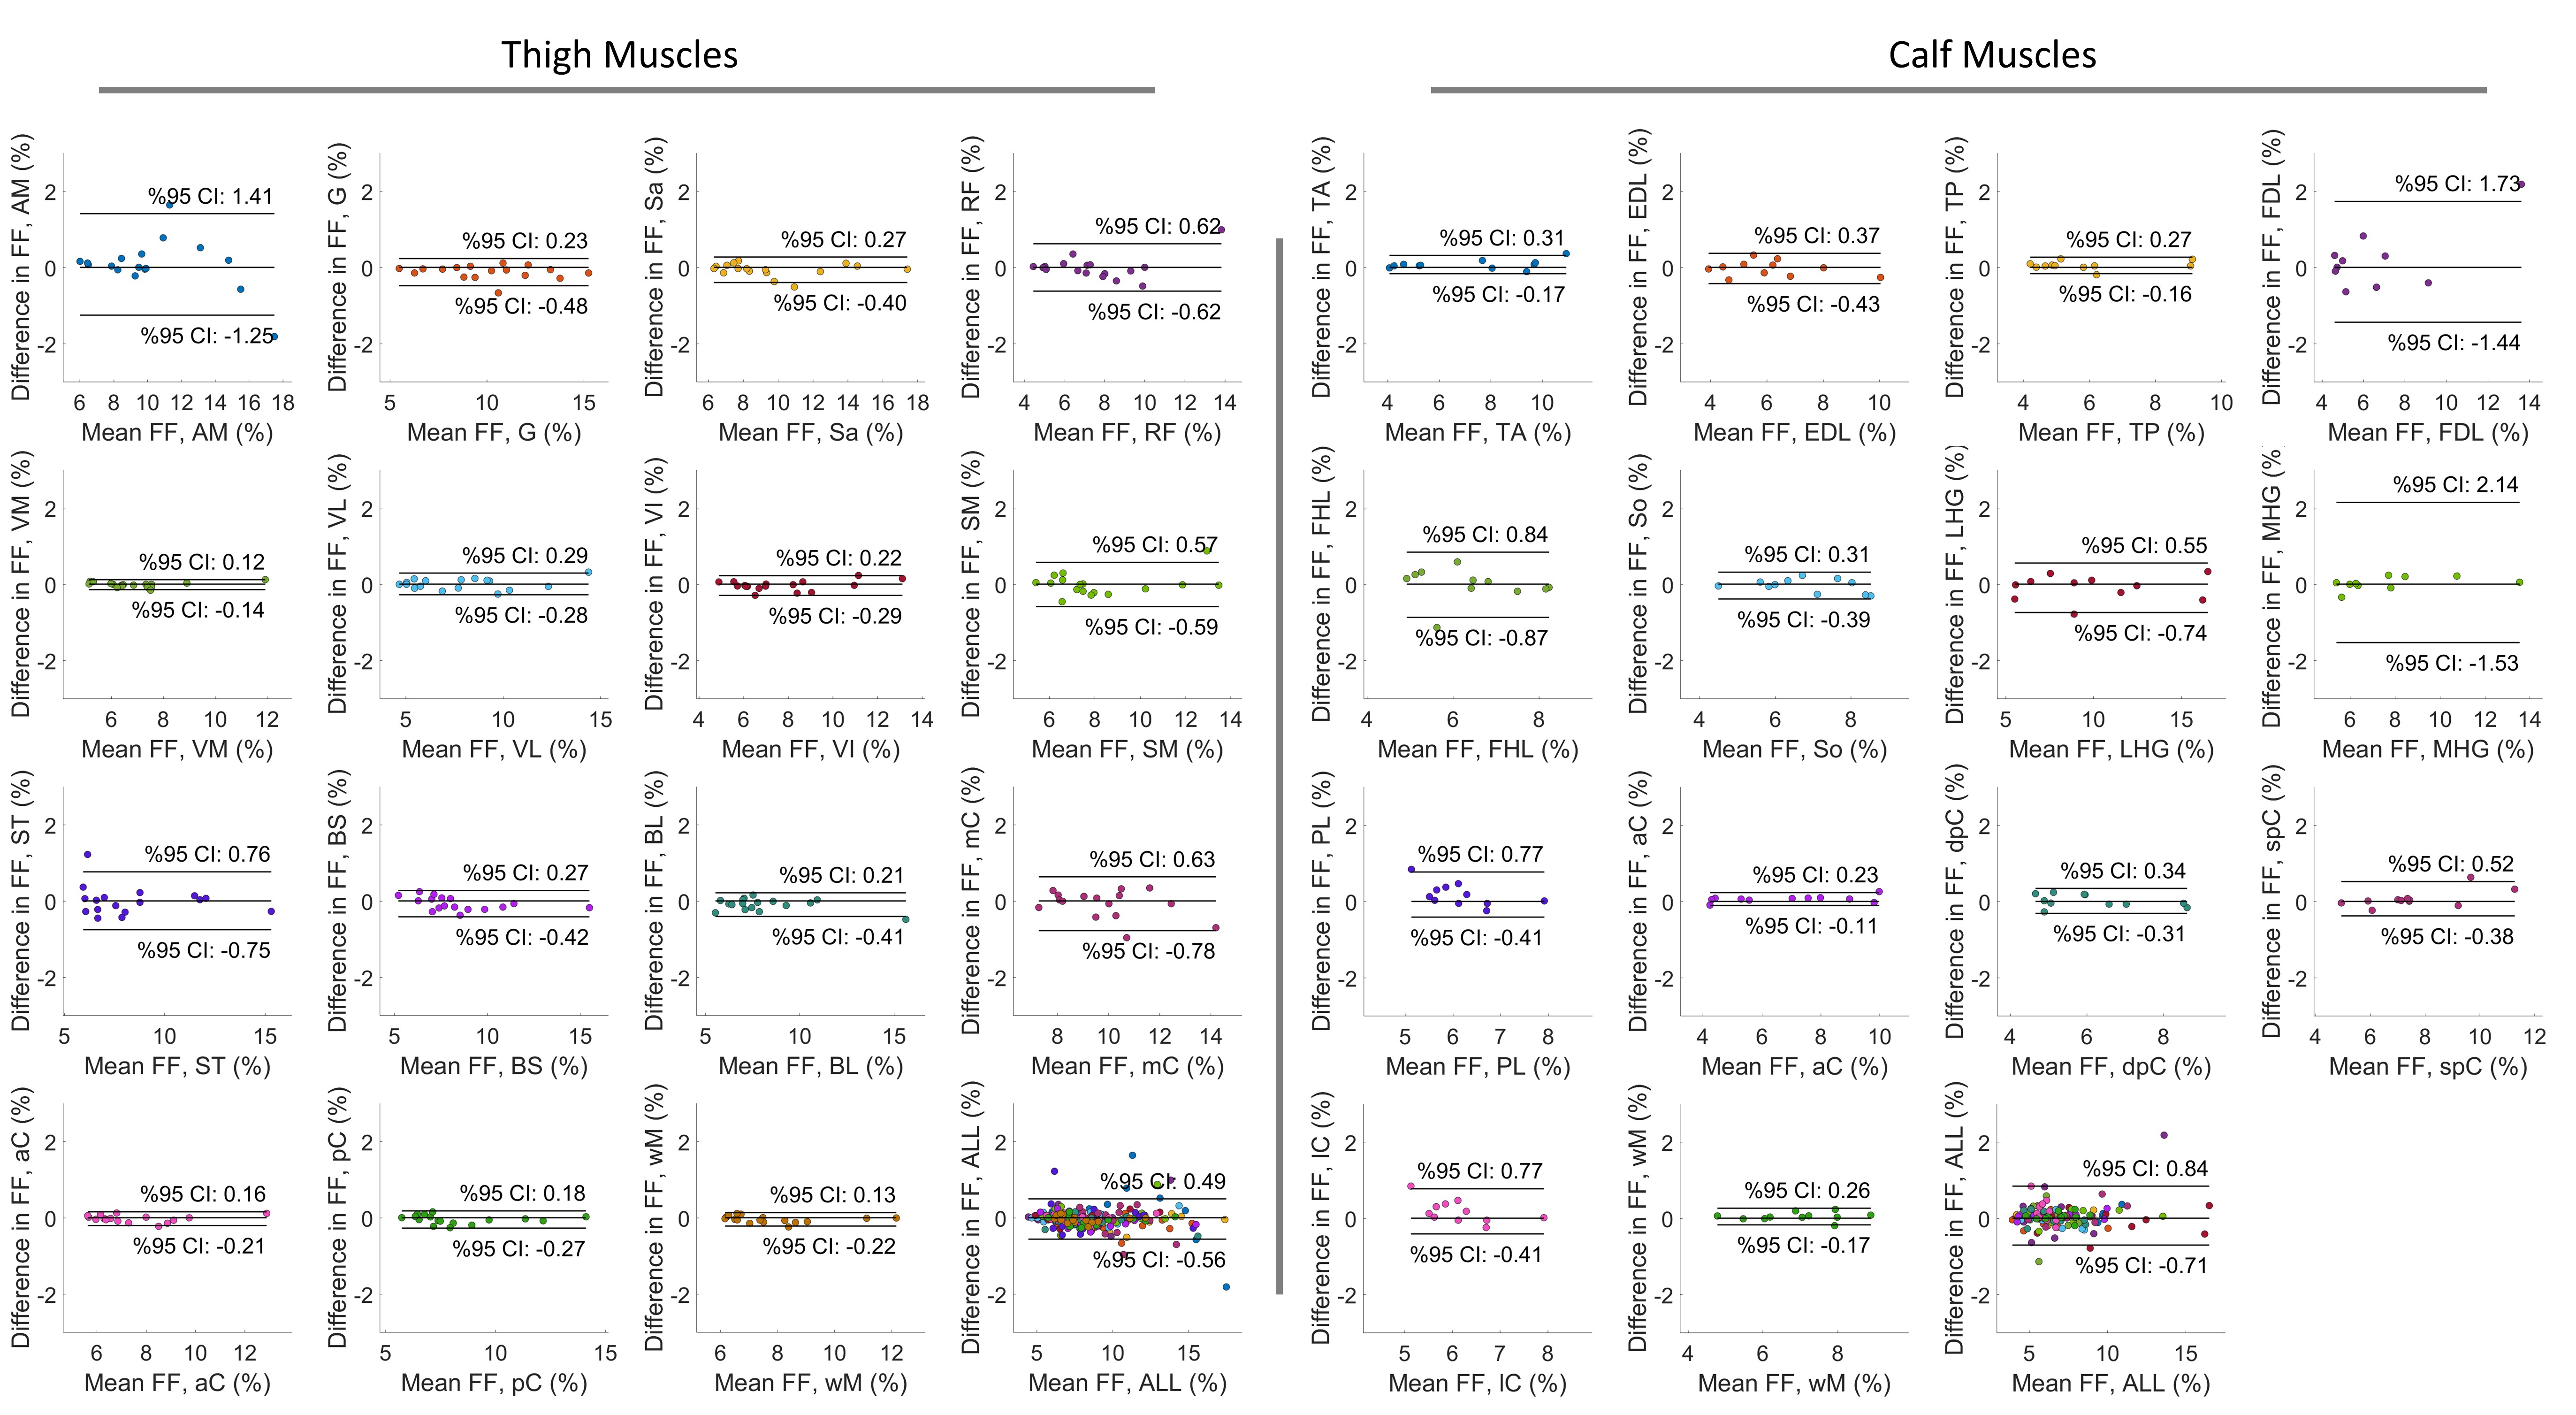
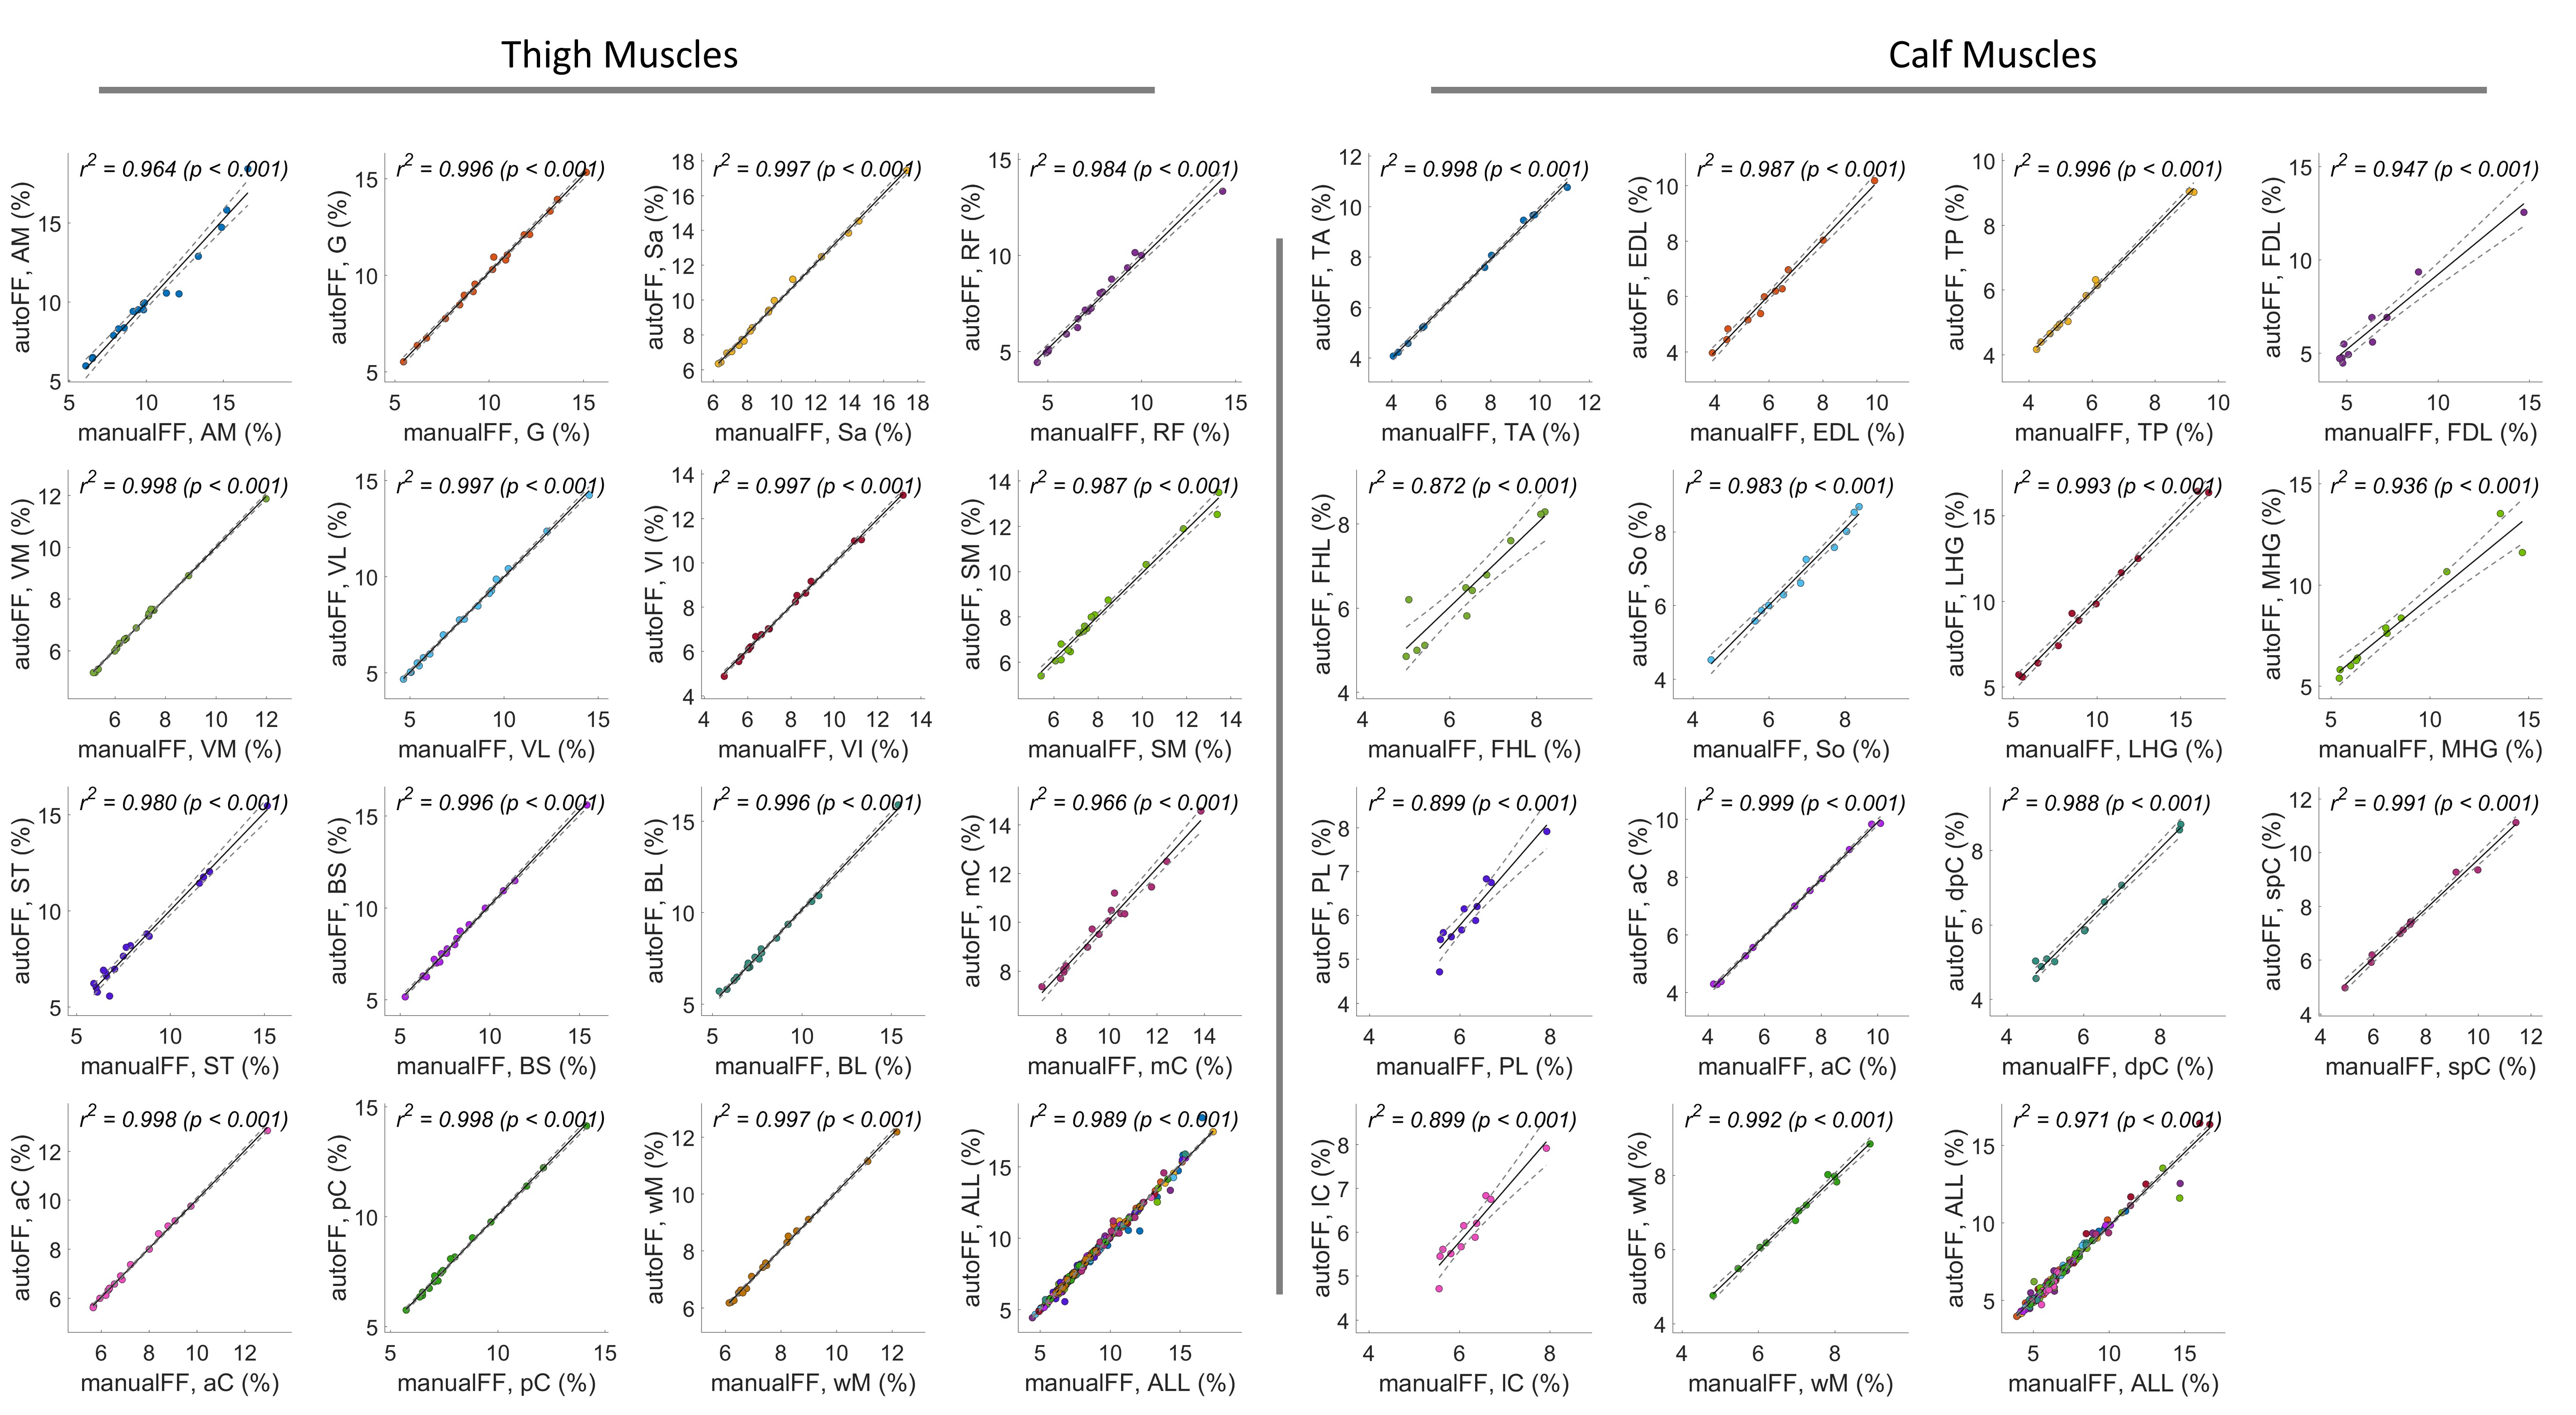
Performance analysis: Dice coefficient (DC) was calculated between binary masks from the automatic and the manual segmentation methods. We further calculated the FF values for each muscle. Bland-Altman and Pearson correlation analyses were performed to compare the FF values between the two methods. The ± 95% confident intervals (CI) and the Pearson coefficient (r2) were reported. In addition to individual muscles, results were evaluated for muscle compartments (subgroups of combined muscles) and the whole muscle in calf or thigh.
Results
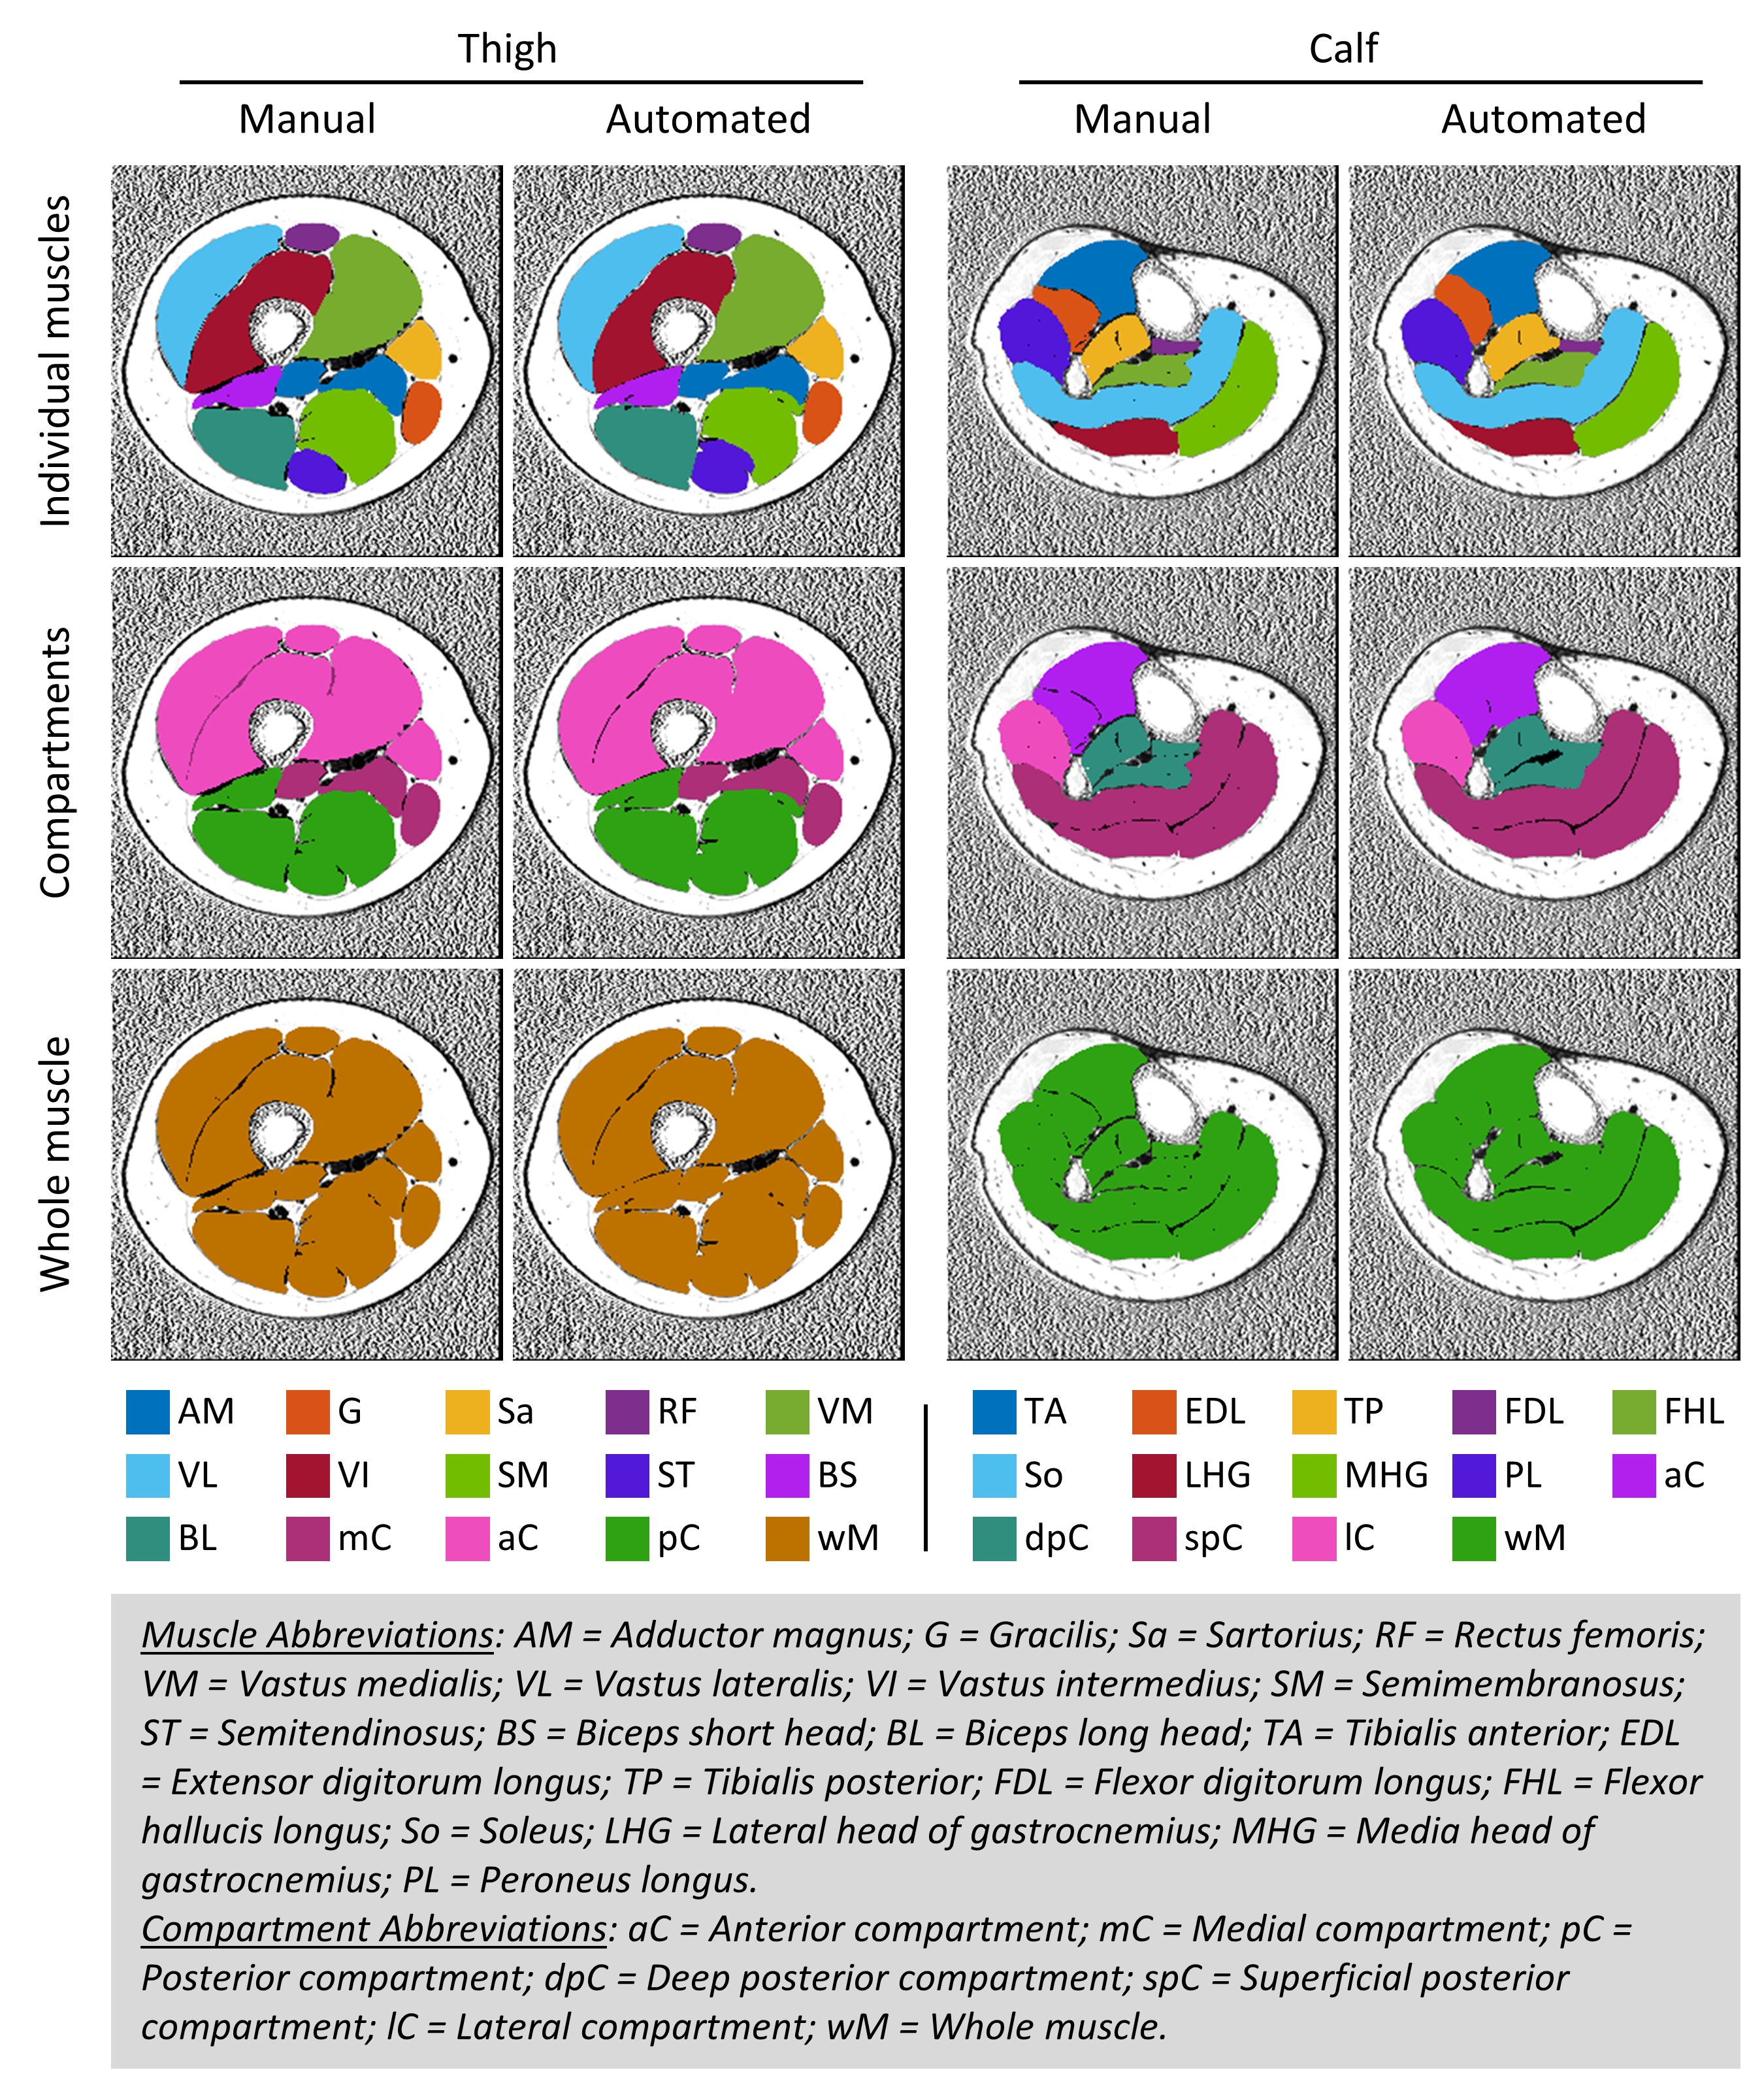
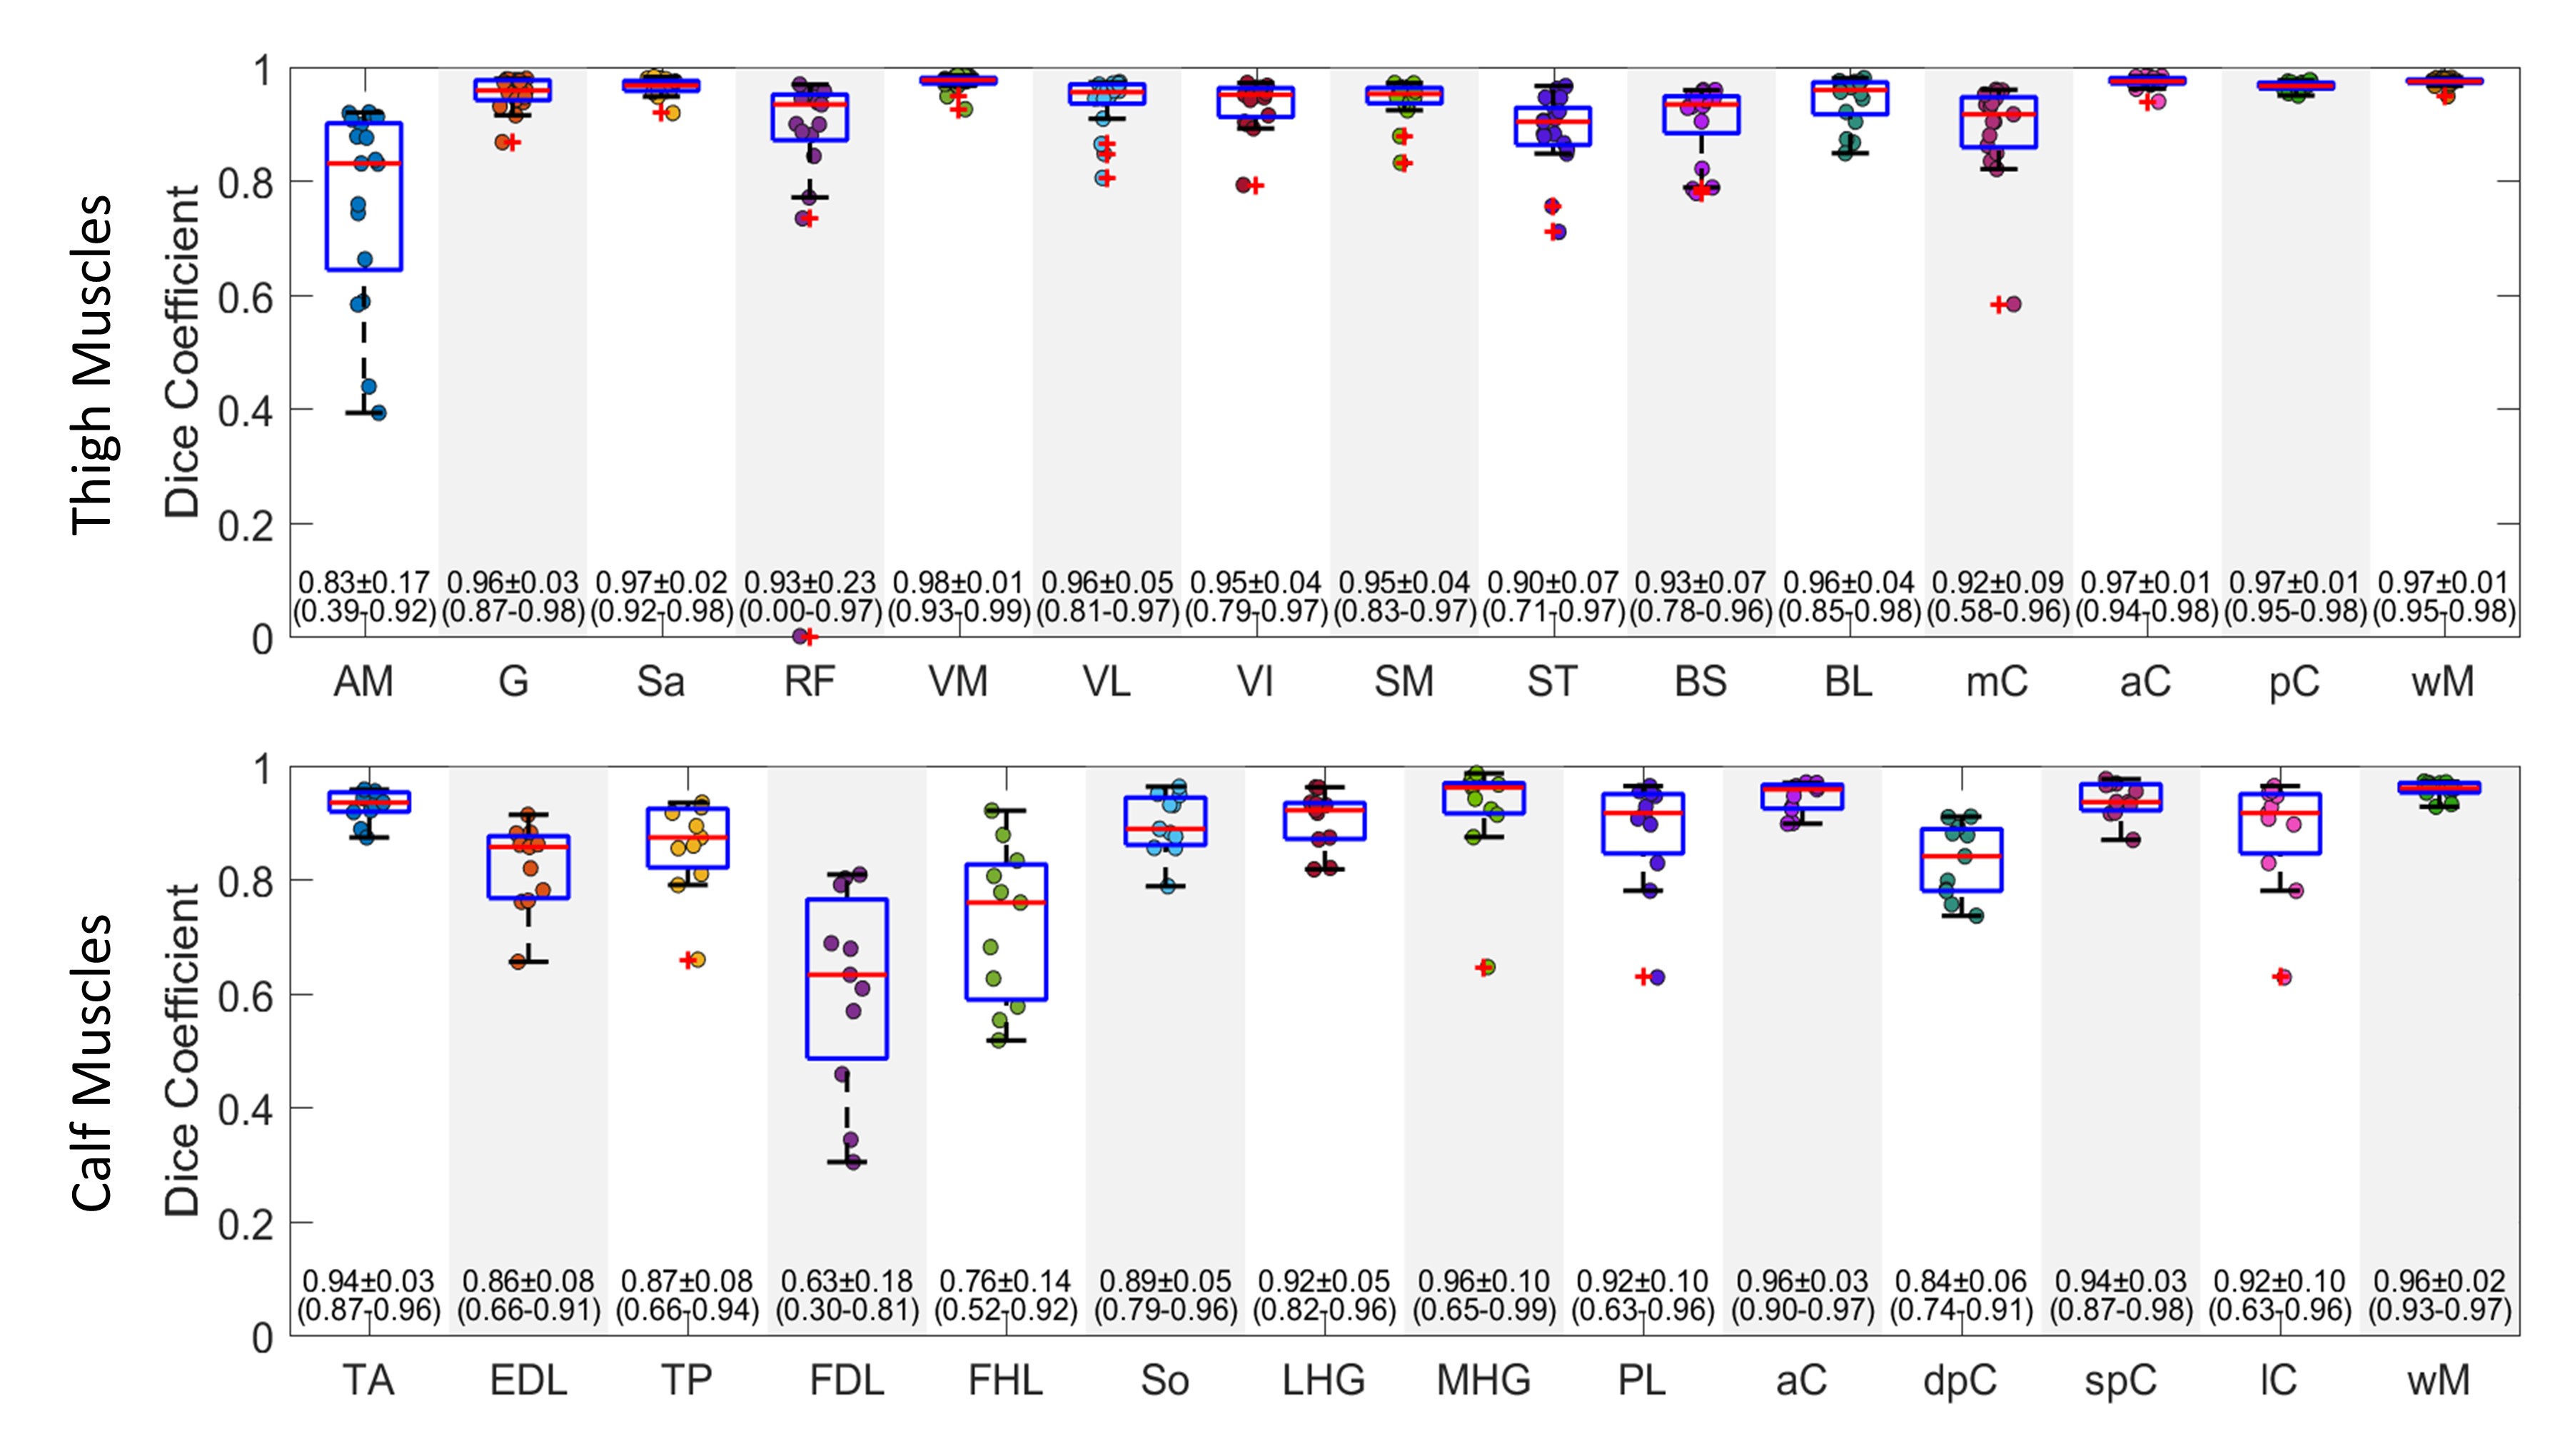
Representative muscle segmentation results are shown in Figure 2. In general, the results from the automatic segmentation well agreed with those from manual method, which is supported by an overall DC of 0.96 ± 0.10 for thigh and 0.91 ± 0.12 for calf muscles (Figure 3). As shown in Figure 4 and 5, the autoFF agreed with the manualFF well in either the thigh (± 95% CI = [0.49, -0.56], r2 = 0.989) or the calf (± 95% CI = [0.84, -0.71], r2 = 0.971).Discussion
In this study, we have automated quantification of FF in individual muscles using a 3D U-Net model. The results demonstrated good agreements between the automatic method and the manual segmentation.Lower DC values (<0.85) were noticed in 3 out of 20 muscles: AM = 0.83 ± 0.17, FDL = 0.63 ± 0.18 and FHL = 0.76 ± 0.14. The relative lower DC values were likely caused by small sizes with highly irregular shapes in the 3 muscles (Figure 2). We expect to improve the accuracy in the three muscles when more data become available for training.
Although volumetric muscle FF has been used as a monitoring biomarker in CMT1A4, its responsiveness may not be sufficient to show progression when FF is measured in early stage of diseases or over a short period13, 18. Furthermore, the FF from a severely denervated muscle could be compromised by a “floor” effect; and would not be suitable for tracking the progression. These shortcomings may be circumvented by targeting a partially denervated muscle that may show better responsiveness. However, analysis of individual muscles repetitively over time imposes a huge labor demand if done manually. Given the length-dependent nature of axonal loss in neuropathies, it often needs to measure muscle FF in both thigh and calf18, which adds more labor. Our U-Net model may overcome the difficulties through automatic segmentation.
Conclusion
In conclusion, our method is able to automatically quantify individual muscle FF in patients with peripheral neuropathies. This development mitigates the laborious manual segmentations; and enables the use of individual muscle FF as outcome measures in longitudinal studies to track axonal loss.Acknowledgements
We thank our research coordinator Mrs. Melody Hackett, and the MRI technician Mr. Yang Xuan for their assistance in coordinating the study participants and acquiring the MRI data. This study is supported by grants from NIH (R01NS066927, R01NS115748), VA BLR&D (IBX003385A), and Detroit Medical Center Foundation (2018-3328).References
1. Li J. Inherited neuropathies. Seminars in neurology; 2012: Thieme Medical Publishers: 204-214.
2. Li J, Ghandour K, Radovanovic D, et al. Stoichiometric alteration of PMP22 protein determines the phenotype of hereditary neuropathy with liability to pressure palsies. Archives of neurology 2007;64:974-978.
3. Morrow JM, Sinclair CD, Fischmann A, et al. MRI biomarker assessment of neuromuscular disease progression: a prospective observational cohort study. The Lancet Neurology 2016;15:65-77.
4. Rossor A, Shy M, Reilly M. Are we prepared for clinical trials in Charcot-Marie-Tooth disease? Brain Research 2019:146625.
5. Ogier AC, Heskamp L, Michel CP, et al. A novel segmentation framework dedicated to the follow‐up of fat infiltration in individual muscles of patients with neuromuscular disorders. Magnetic Resonance in Medicine 2020;83:1825-1836.
6. Kanber B, Morrow JM, Klickovic U, et al. Musclesense: a Trained, Artificial Neural Network for the Anatomical Segmentation of Lower Limb Magnetic Resonance Images in Neuromuscular Diseases. Springer, 2020.
7. Guo Z, Zhang H, Chen Z, et al. FilterNet: A Neighborhood Relationship Enhanced Fully Convolutional Network for Calf Muscle Compartment Segmentation. arXiv preprint arXiv:200611930 2020.
8. Kemnitz J, Baumgartner CF, Eckstein F, et al. Clinical evaluation of fully automated thigh muscle and adipose tissue segmentation using a U-Net deep learning architecture in context of osteoarthritic knee pain. Magnetic Resonance Materials in Physics, Biology and Medicine 2020;33:483-493.
9. Anwar SM, Irmakci I, Torigian DA, et al. Semi-Supervised Deep Learning for Multi-Tissue Segmentation from Multi-Contrast MRI. arXiv preprint arXiv:200903128 2020.
10. Amer R, Nassar J, Bendahan D, Greenspan H, Ben-Eliezer N. Automatic Segmentation of Muscle Tissue and Inter-muscular Fat in Thigh and Calf MRI Images. International Conference on Medical Image Computing and Computer-Assisted Intervention; 2019: Springer: 219-227.
11. Makrogiannis S, Serai S, Fishbein KW, Schreiber C, Ferrucci L, Spencer RG. Automated quantification of muscle and fat in the thigh from water‐, fat‐, and nonsuppressed MR images. Journal of Magnetic Resonance Imaging 2012;35:1152-1161.
12. Ronneberger O, Fischer P, Brox T. U-net: Convolutional networks for biomedical image segmentation. International Conference on Medical image computing and computer-assisted intervention; 2015: Springer: 234-241.
13. Fritz NE, Chen Y, Waters L, et al. Fatigue in patients with hereditary neuropathy with liability to pressure palsies. Annals of Clinical and Translational Neurology 2020;7:1400-1409.
14. Zhang T, Chen Y, Bao S, et al. Resolving phase ambiguity in dual‐echo dixon imaging using a projected power method. Magnetic resonance in medicine 2017;77:2066-2076.
15. Chen Y, Haacke EM, Xuan Y, et al. Proximal Nerve Quantitative MRI in Charcot-Marie-Tooth (CMT) Diseases. Proc Intl Soc Mag Reson Med 28; 2020; Virtual: 1564.
16. Géron A. Hands-on machine learning with Scikit-Learn, Keras, and TensorFlow: Concepts, tools, and techniques to build intelligent systems: O'Reilly Media, 2019.
17. Çiçek Ö, Abdulkadir A, Lienkamp SS, Brox T, Ronneberger O. 3D U-Net: learning dense volumetric segmentation from sparse annotation. International conference on medical image computing and computer-assisted intervention; 2016: Springer: 424-432.
18. Pridmore M, Castoro R, McCollum M, Kang H, Li J, Dortch R. Length-dependent MRI of hereditary neuropathy with liability to pressure palsies. Annals of clinical and translational neurology 2019; DOI:10.1002/acn3.50953.
Figures