4032
In vivo hypoxia monitoring using a novel single sided NMR device1School of Chemical and Physical Sciences, Victoria University of Wellington, Wellington, New Zealand, 2Centre for Translational Physiology, University of Otago, Wellington, New Zealand, 3School of Engineering and Computer Science, Victoria University of Wellington, Wellington, New Zealand, 4MacDiarmid Institute for Advanced Materials and Nanotechnology, Wellington, New Zealand, 5Department of Paediatrics and Child Health, University of Otago, Wellington, New Zealand, 6Robinson Research Institute, Victoria University of Wellington, Wellington, New Zealand
Synopsis
In this study, we investigate how a low field single-sided NMR device can be used to monitor brain tissue properties in-vivo. This device produces a B0 field with a sweet spot in the brain, which defines the region of tissue that is measured. An ovine model of brain hypoxia was developed, to allow tissue oxygenation to be controlled. We observed that the T2 decreased during hypoxia, recovering once normal oxygenation levels were re-established. These results shows that single-sided NMR devices have the potential to be used for real-time monitoring applications.
Introduction
Technologies for non-invasive real-time measurement of the brain’s condition such as near-infrared spectroscopy is limited due to the lack of penetration depth, and contamination of the signal by non-target tissue. MRI produces a wealth of physiological information, with contrast parameters such as T1, T2, diffusion, magnetisation transfer etc. that reflect cellular properties of tissue1. However, the use of these techniques for monitoring and diagnosis are limited by the cost and time required for imaging.Single-sided MR systems have been developed that can measure these parameters without the need to image the body in an MRI system2-6. However, their utility in biomedical applications has been limited with few examples of their feasibility for detecting physiologically relevant changes in MR parameters using low and inhomogeneous B0 fields. In this study, we implemented a single-sided NMR system to monitor changes in brain T2 in an ovine model of acute global hypoxia. Specifically, we sought to determine whether the effect of tissue oxygenation on T2, which is known to diminish under lower B0 fields7-9, can be reliably detected using a 0.2T device.
Methods
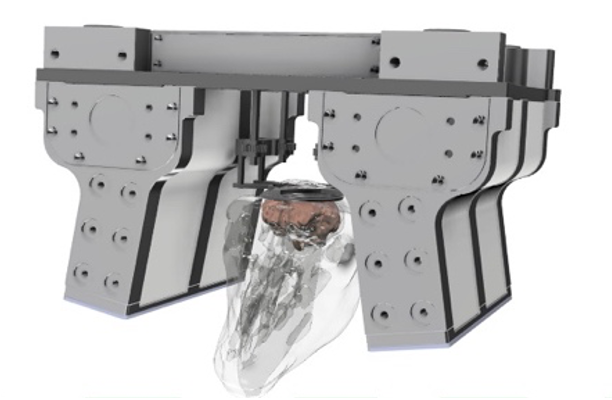
An ovine model for acute hypoxia was developed to investigate whether changes can be detected in brain in-vivo during hypoxia. By controlling respiration rate and tidal volume, the oxygen saturation was lowered to create a hypoxic state. As a gold standard, the sO2 was measured by pulse oximetry, invasive probe (Integra Licox) and blood gas analysis. Additionally, ECG, ABP and breathing gases were also monitored.Following a baseline period of normoxia, a hypoxic state was induced up to 3 times before euthanasia. This study was approved by the University of Otago Animal Ethics Committee. A 0.2 T single-sided system10 was used to monitor brain in-vivo. The device produces a sweet spot B0 field, with a 10x10x50 mm homogeneous region where the NMR signal is detected, at a depth of up to 50mm. The magnet was positioned over the midline of the head, with the height adjusted to target a region around the surface of the brain (Figure 1).
CPMG experiments were used to measure T2, measured with multiple inter-echo intervals, to test how this affected the sensitivity of these measurements. To reduce the amount of electrical interference, electronic monitoring devices, such as pulse oximetry sensors, and temperature probes were placed away from the system, and a conductive blanket was used to cover the system. This allowed us to obtain a usable SNR.
Results
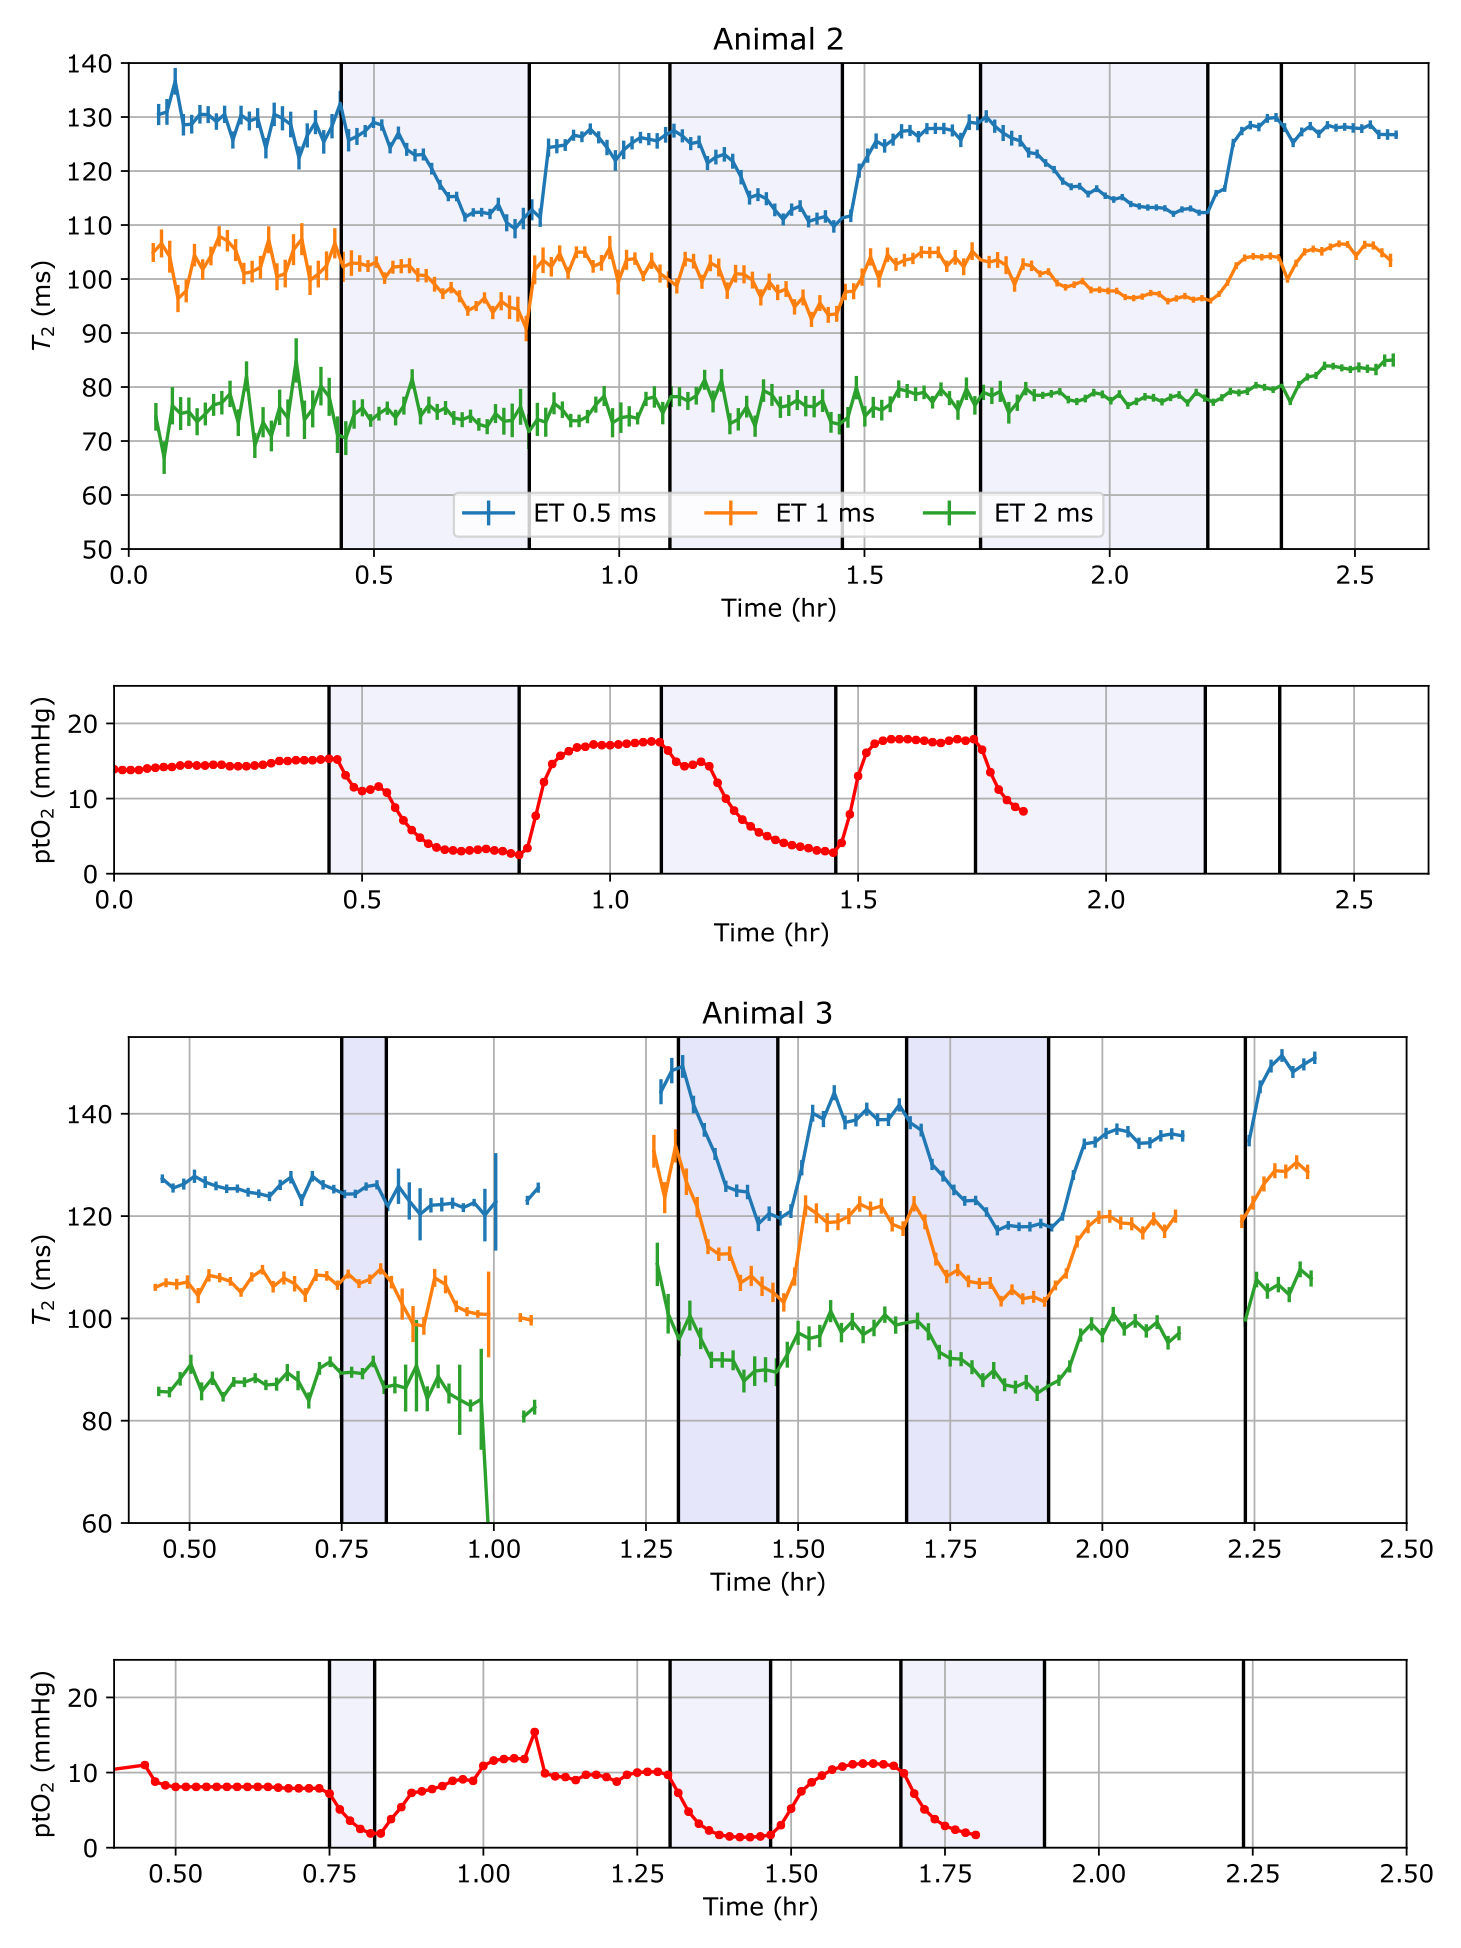
Arterial blood gas measurement showed that blood sO2 during hypoxic periods decreased to an average of 44% or less, which is significantly below the 95-99% that in the normoxic periods. Tissue oxygenation (ptO2) measurements decreased from a normal value of around 20 mmHg to less than 5 mmHg during the hypoxic stages.For an initial analysis, the CPMG echo train decays were fit to a monoexponential function, which returned a single T2. Two examples of the T2 monitoring data are shown in Figure 2, alongside the tissue oxygenation measurements (ptO2). During the hypoxic periods, the T2 decreased by up to 20 ms when measured with the 0.5 ms echo interval, quickly recovering once normal oxygenation is reached. Measurements with longer 1 ms and 2 ms echo intervals produce a shorter T2, because of diffusion through the inhomogeneous field of the magnet. The changes during the hypoxic periods are less significant in these longer echo interval experiments, possibly due to this effect. In one animal, following euthanasia, a sharp increase in T2 occurred within minutes. This effect was visible in all of the different echo interval measurements.
Discussion
These results demonstrate the feasibility of measuring T2 in brain in-vivo, in a clinical environment. The experimental protocol creates a severe hypoxic challenge, which is correlated with a decrease in T2. The cause of this change is likely to be related to the BOLD effect, with a size that is similar to previous measurements at low field9. However, there are also other explanations such as changes in the relative fractions of different tissue compartments with different T2s, or increased heart rate and blood flow. Additionally, there is also variation in T2 measurements across different animals. This may reflect different anatomic features being detected due to the relative position of the magnet and the head. Once correctly positioned, time series data for each animal was recorded without repositioning the device.An unexpected result was the rapid increase in T2 following euthanasia. This effect could be due to changes in different T2 components. Alternatively, due to the inhomogeneous field of the magnet, the effect may reflect diffusion changes in the brain triggered by tissue ischaemia10,11.
Conclusion
We have shown that a novel single-sided NMR device operating at 0.2T can detect changes in T2 that occur during cerebral hypoxia in-vivo. With further development, NMR devices such as these can be used to apply NMR techniques for real-time monitoring in clinical environments where MRI is impractical.Acknowledgements
This work was funded by the New Zealand Ministry of Business Innovation and Employment.
References
1. Cheng HLM, Stikov N, Ghugre NR, and Wright GA, Practical medical applications of quantitative MR relaxometry. J. Magn. Reson. Imaging. 2012; 36(4):805–824
2. van Landeghem M, Danieli E, Perlo J, Blümich B, and Casanova F, Low-gradient single-sided NMR sensor for one-shot profiling of human skin. J. Magn. Reson. 2012;215:74–84
3. Brizi L et al., Bone volume–to–total volume ratio measured in trabecular bone by single-sided NMR devices. Magn. Reson. Med. 2017; 79(1):501–510
4. Keschenau PR et al., Evaluation of the NMR-MOUSE as a new method for continuous functional monitoring of the small intestine during different perfusion states in a porcine model. PLOS ONE. 2018; 13(11):e0206697
5. Ali TS et al., Transverse relaxation-based assessment of mammographic density and breast tissue composition by single-sided portable NMR. Magn. Reson. Med. 2019; 82(3):1199–1213
6. Bashyam A, Frangieh CJ, Li M, and Cima MJ, Dehydration assessment via portable, single sided magnetic resonance sensor. Magn. Reson. Med. 2020;83(4):1390–1404
7. Brooks RA, Vymazal J, Baumgarner CJ, Tran V, and Bulte JWM, Comparison of T2 relaxation in blood, brain, and ferritin. J. Magn. Reson. Imaging. 1995;5(4):446–450
8. Grgac K, Li W, Huang A, Qin Q, and van Zijl PCM, Transverse water relaxation in whole blood and erythrocytes at 3T, 7T, 9.4T, 11.7T and 16.4T; determination of intracellular hemoglobin and extracellular albumin relaxivities. Magn. Reson. Imaging. 2017;38:234–249
9. D. Thomas et al., Oxygen Saturation Dependent Effects on Blood Transverse Relaxation at Low Fields, in Proceedings of the 27th Annual Meeting of ISMRM, Montreal, Canada, May 2019, Abstact #4978.
10. D. Thomas et al., Single sided magnet system for relaxometry and diffusion measurement,” in Proceedings of the 28th Annual Meeting of ISMRM, Jul. 2020, Abstract #1255.
11. Bai R, Stewart CV, Plenz D, and Basser PJ, Assessing the sensitivity of diffusion MRI to detect neuronal activity directly,” Proc. Natl. Acad. Sci. 2016;113(12):E1728–E1737
Figures