4026
Reliability of brain volumetrics in low-field portable MRI1Bioengineering, University of Pennsylvania, Philadelphia, PA, United States, 2Computer Science, University of Pennsylvania, Philadelphia, PA, United States, 3Hyperfine Research, Guilford, CT, United States, 4Neurology, Perelman School of Medicine, Philadelphia, PA, United States, 5Radiology, Perelman School of Medicine, Philadelphia, PA, United States
Synopsis
A growing body of literature demonstrates the value of MRI-based volumetric measures in diagnosing and treating neurodegenerative disorders. However, clinicians cannot offer biomarker screening for at-risk patients due to MRI systems’ high cost and limited access. Low-field MRI scanners offer a potential method for collecting low-cost images that could be analyzed for longitudinal biomarker changes or used in population-level studies. Here we examine the reliability of volumetric measurements made on a low-field MRI system. We compare the variability of 6 tissue volumes collected over 40 scans for 3T and 64mT systems, as well as the overlap between volume segmentations.
Introduction
Brain volumetrics derived from MRI have proven to be powerful biomarkers for neurodegenerative and other disorders1–3. However, access to clinical 1.5T and 3T systems is limited and screening the entire at-risk population for MRI-based neurodegenerative biomarkers is not currently feasible. Low-field strength MRI could facilitate low cost imaging of large numbers of patients for clinical or research purposes and has already shown promise in the assessment of brain-injury patients4. The purpose of this study was to evaluate the rescan reliability of a 64mT low-field MRI scanner and compare the reliability of volumetric estimates between a 64mT and 3T system. To this end, we performed repeated 64mT scanning on a single subject and compared volumetric measurements to those made on a clinical 3T system. We also compare the variability in brain volumes using an analog 3T scan-rescan dataset5.Methods
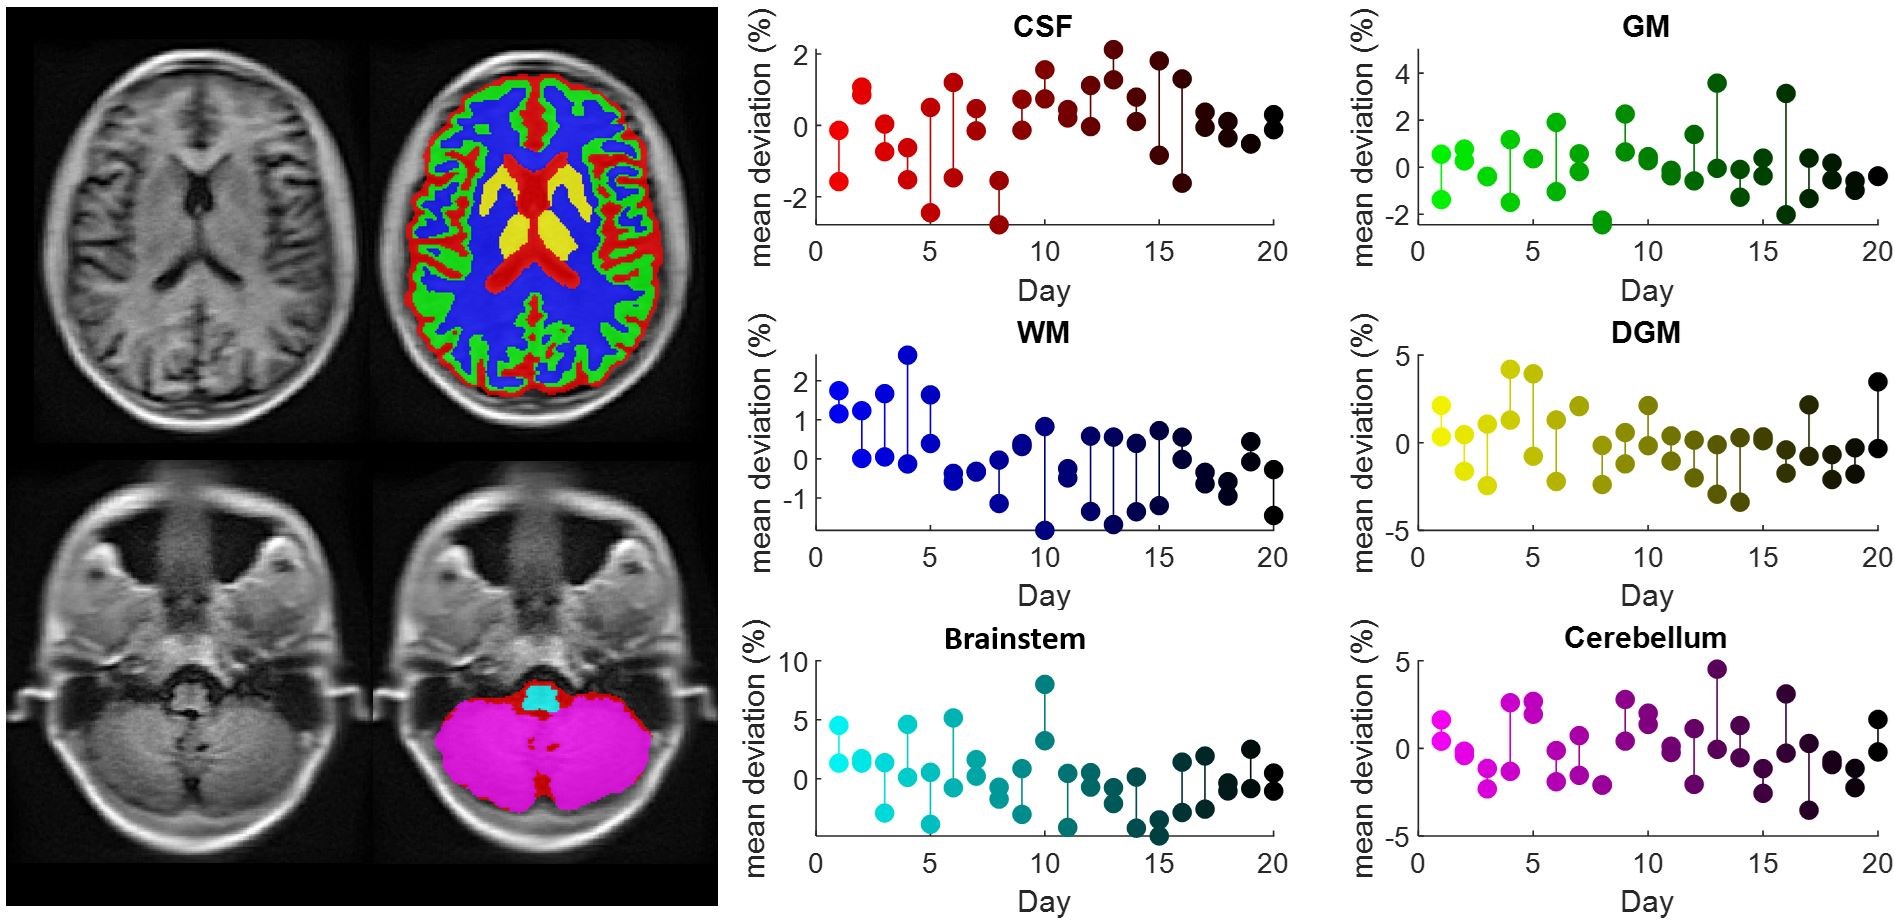
Human subject imaging was approved by the Institutional Review Board of the University of Pennsylvania. Using a 64mT low-field MRI scanner (Swoop, Hyperfine, Guilford, CT), a single subject (M-26y.o.) was scanned 40 times during 20 sessions over a 5-week period. Two T1-weighted scans (TE = 6.16 ms, TR = 1500 ms, TI = 300 ms, scan time = 4:52 min, average = 1, resolution = 1.5x1.5x5 mm3) were collected during each session with the participant being repositioned between scans. The subject was scanned once in a 3T scanner (TE=2.52 ms, TR = 1900 ms, TI = 900 ms, scan time = 7:14 min, average = 1, resolution = 1mm isotropic) to provide ground truth volume measures. Additionally, a similar scan-rescan dataset collected on a 3T scanner (also 40 scan iterations) was obtained from an open access source5. Using Advanced Normalization Tools (ANTs), each image was segmented into 6 canonical macro-scale intracranial volumes; gray matter (GM), white matter (WM), deep gray matter (DGM), brainstem, cerebellum, and cerebrospinal fluid (CSF)6. A single-subject template was generated by registering and averaging all 40 scans (fig. 1 – left). Coefficient of variation (COV) was employed to assess inter-session and intra-session reliability of volume measurements (fig. 1 – right). Sørensen-Dice coefficient (SDC) was used to assess similarity of low-field scans segmentations and same-subject 3T segmentations7,8.Results
Across all volumes and scanners, inter-session and intra-session variation was not significantly different (Fig. 1, p = 0.49-0.99). The magnitude of variability was similar between scanners (3T: 0.4-1.2%, 64mT: 1.0-2.8%). Similarity between the 64 mT and 3T segmentation, assessed using SDC, is reported for each tissue as follows: GM = 0.4±0.06, WM = 0.54±0.08, DGM = 0.43±0.12, brainstem = 0.64±0.13, cerebellum = 0.67±0.11, and CSF = 0.32±0.07.Discussion and Conclusion
Images collected on a low-field (64mT) MRI scanner permit segmentation of macro-scale brain volumes. The reliability of volume estimates at low field is similar to images collected at 3T, although small regions (DGM, brainstem) and regions near the head coil aperture (cerebellum) showed higher variability at 64mT. Similarity between 3T and 64mT segmentations revealed lower accuracies for structures influenced by gyrification (CSF, GM) which likely reflects difficulties registering fine structures in 64mT images. Overall, these initial results are encouraging and indicate that known volumetric biomarkers of neurodegeneration, such as total gray matter volume and total CSF volume, could be reliably measured on low-field strength systems. Further studies exploring the effects of resolution on brain volume measurements and validating low field volumetric measurements across multiple subjects and ages are ongoing.Acknowledgements
We thank Hyperfine Research for the use of their low-field MRI scanner and the Penn Neuroradiology Research Core for assisting with patient recruitment and scanning. This work was supported by the NIH (T32NS091006-01), the HHMI-NIBIB Interfaces Initiative (5T32EB009384-10), Jonathan and Bonnie Rothberg, The Mirowski Family Fund, and Neil and Barbara Smit.References
1. Leung KK, Bartlett JW, Barnes J, Manning EN, Ourselin S, Fox NC. Cerebral atrophy in mild cognitive impairment and Alzheimer disease: Rates and acceleration. Neurology. 2013;80(7):648-654. doi:10.1212/WNL.0b013e318281ccd3
2. Petersen RC, Aisen PS, Beckett LA, et al. Alzheimer’s Disease Neuroimaging Initiative (ADNI): Clinical characterization. Neurology. 2010;74(3):201-209. doi:10.1212/WNL.0b013e3181cb3e25
3. Risacher S, Saykin A, Wes J, Shen L, Firpi H, McDonald B. Baseline MRI Predictors of Conversion from MCI to Probable AD in the ADNI Cohort. Curr Alzheimer Res. 2009;6(4):347-361. doi:10.2174/156720509788929273
4. Sheth KN, Mazurek MH, Yuen MM, et al. Assessment of Brain Injury Using Portable, Low-Field Magnetic Resonance Imaging at the Bedside of Critically Ill Patients. JAMA Neurol. September 2020. doi:10.1001/jamaneurol.2020.3263
5. Maclaren J, Han Z, Vos SB, Fischbein N, Bammer R. Reliability of brain volume measurements: A test-retest dataset. Sci Data. 2014;1(1):140037. doi:10.1038/sdata.2014.37
6. Avants, Brian B., Tustison, Nick, Song G. Advanced normalization tools (ANTS). Insight j 2. 2009:1-35.
7. Dice LR. Measures of the Amount of Ecologic Association Between Species. Ecology. 1945;26(3):297-302. doi:10.2307/1932409
8. Sørensen TJ. A method of establishing groups of equal amplitude in plant sociology based on similarity of species content and its application to analyses of the vegetation on Danish commons. K Danske Vidensk Selsk. 1948;5(4):1-34.
Figures