4025
Low-Field Point-of-Care MRI: Automated Estimates of Brain Midline Shift Correlate With Clinical Outcomes in Stroke1Hyperfine Research Inc., Guilford, CT, United States, 2Yale University School of Medicine, New Haven, CT, United States
Synopsis
Low-field (64 mT) point-of-care (POC)-MRI was acquired at the bedside from patients with ischemic and hemorrhagic stroke in the neurointensive care unit at a major academic medical center (n=128). An AI system was trained to quantify brain midline shift (MLS), a standard neuroradiological marker of brain injury from POC-MRI, using anatomical annotations from independent neuroradiologists. A cross-validation experiment showed that AI estimates of MLS from POC-MRI were associated with stroke severity and disability at subsequent discharge. AI estimates of MLS greater than 1.5 mm were positively predictive of poor discharge outcome in the full sample and in ischemic stroke.
Introduction
A portable point-of-care MRI system (POC-MRI, Hyperfine Research Inc., Guilford, CT) has recently been shown to be effective in imaging pathology in stroke.1 Shifts of midline structures such as the septum pellucidum or the pineal gland are standard indicators of brain injury, with larger MLS being associated with neurological deterioration and early mortality in ischemic stroke.2–7 POC-MRI may enable rapid bedside detection of progressive cerebral edema in stroke based on automated measurement of midline shift (MLS). Here we communicate feasibility of using deep learning methods to automatically characterize MLS on POC-MRI in an inpatient stroke population, towards automated monitoring of brain changes from imaging at the bedside using POC-MRI.8Methods
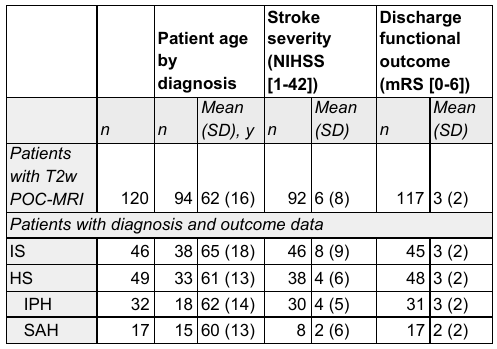
ImagingFrom July 2018 to March 2020, all patients who were admitted with acute brain injury to the neuroscience intensive care unit (NICU) at Yale New Haven Hospital were prospectively screened for inclusion in this study. POC-MRI was acquired inside NICU patient rooms. Ongoing standard of care treatment, including ventilation, intravenous infusions, and telemetry was continued during imaging. T2-weighted (T2w) images were used in this study. Sequence parameters for T2w images were: TR, 4000 milliseconds; TE, 228 milliseconds; TI, 1400 milliseconds; 1.5 × 1.5 × 5 mm resolution; 36 slices. Scanning times were recorded along with any patient complications or electronic disturbance to monitoring in the ICU room. Patients who completed imaging (N=128, see Table 1) were grouped by primary diagnosis and by stroke category, either ischemic stroke (IS) or hemorrhagic stroke (HS).
Training Data
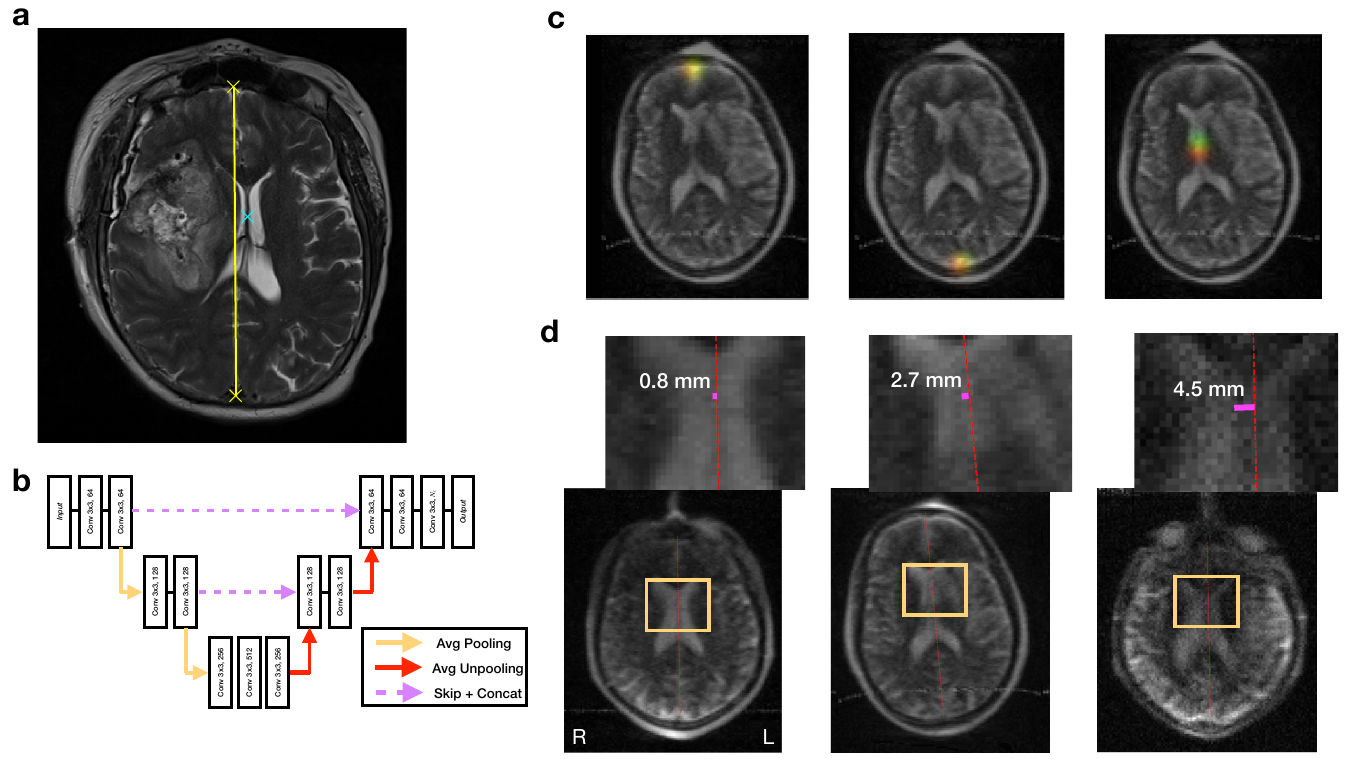
A supervised deep learning experiment in a split-half cross-validation design was used to train and evaluate an artificial neural network to annotate T2w POC-MRI of human brain with stroke pathology (MLS-AI). Training data included volumetric images including native POC-MRI images and publicly available (Human Connectome Project) high-field MRI images adapted to POC-MRI resolution and noise content. Using annotations on POC-MRI obtained from 3 independent neuroradiologists, the network was trained to identify three anatomical points used clinically to measure MLS: the anterior and posterior falx cerebri, and the septum pellucidum (Figure 1a).
Model Architecture
The deep learning model was an end-to-end fully convolutional neural network (CNN) based on the Res-U-net architecture10 (Figure 1b). This network was trained to encode the mapping of three-dimensional T2w POC-MRI to probability maps for neuroanatomical landmarks in rank-4 tensors (Figure 1c). Training involved deep learning model parameter estimation and model validation. Model training and evaluation using two-fold cross-validation produced MLS estimates from each image in the stroke sample; no model was used to evaluate an image that was used to train it. No clinical outcome data was involved in model training.
Clinical Outcomes and Statistical Analysis
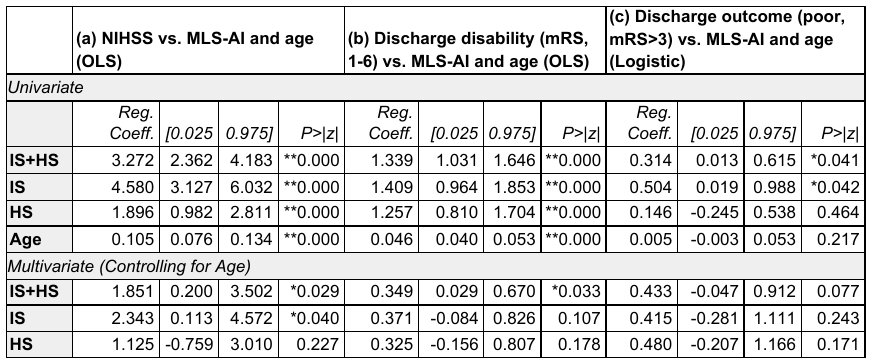
Multiple linear and logistic regression analysis was used to evaluate the association of stroke severity measured as NIH Stroke Scale (NIHSS) near the time of imaging, and functional outcome at discharge measured as the modified Rankin Scale (mRS), as a function of MLS-AI (displacement, mm) and patient age. Leave-one-out cross-validation was conducted to determine the 95% percentile confidence intervals of the estimated effect size (EE). Analysis was conducted at the level of the sample and in the independent study groups, IS and HS. The null hypothesis of statistical tests were rejected at two levels of significance, p<0.05, and p<0.005.
Results
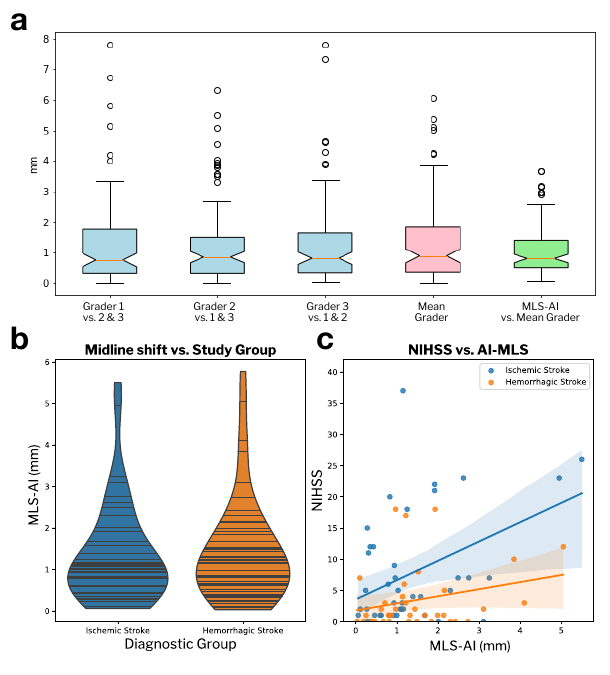
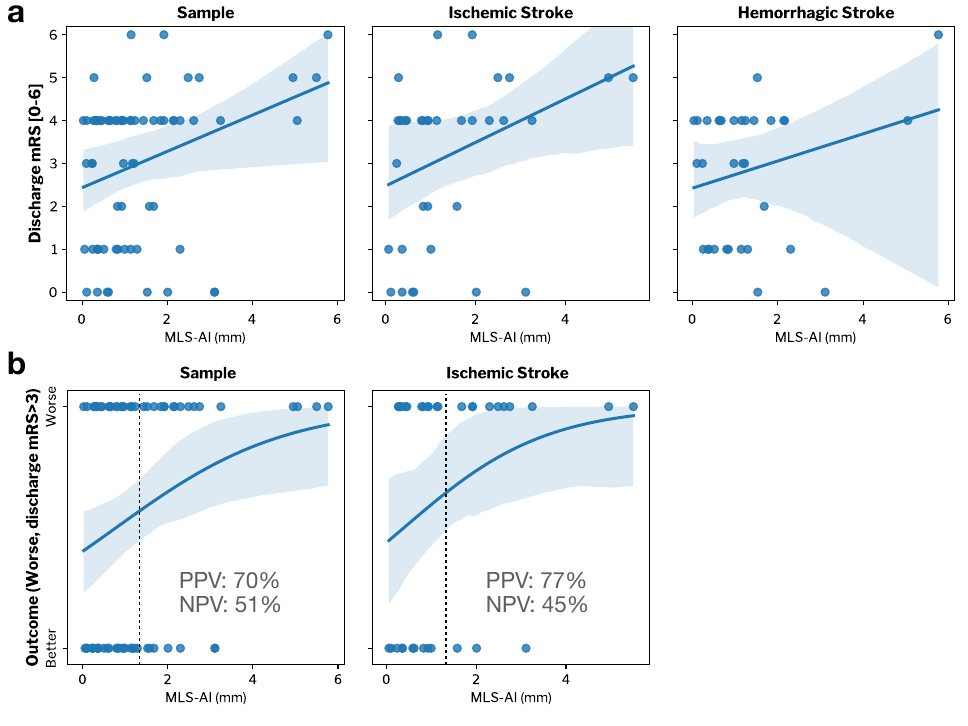
The relationship between MLS-AI in T2w POC-MRI and stroke severity (NIHSS) was evaluated for each subgroup and over the entire stroke sample (Figure 2), and with and without controlling for patient age (Table 1(a)). MLS-AI was associated with NIHSS at the sample level and in both IS and HS groups (p<<0.005). After controlling for patient age, NIHSS was associated with MLS-AI at the sample level and in IS (both p<0.05), and not in HS.Larger MLS-AI at the time of imaging was associated with significantly worse outcome (mRS>3) at the time of subsequent discharge, for the entire analyzed sample (OR=1.36 [1.01-1.84], Estimated Effect Size [EE]=2.0, p=0.041) and in the IS subgroup (OR=1.65 [1.01-2.68], EE=2.3, p=0.042), but not in the HS subgroup (EE=0.73, p=0.46). Dichotomizing MLS-AI at the level of image resolution (1.5 mm), the non-parametric Mann-Whitney U-test of the rank-difference in mRS [1-6] given MLS-AI greater than 1.5 mm was significant (p(U)<0.05). Positive predictive value (PPV) of worse discharge outcome (mRS>3) given MLS-AI greater than 1.5 mm was 70% for the entire sample and 77% in ischemic stroke. Negative predictive value (NPV) was marginal in both samples (51% and 46%; Figure 3).
Discussion and Conclusion
We demonstrated feasibility of using deep learning to automatically characterize MLS from POC-MRI in an inpatient stroke population. Larger MLS-AI was associated with poorer neurologic status (NIHSS) near the time of imaging and worse functional outcome (mRS) at subsequent discharge in the full sample and in the ischemic stroke group, reflecting brain changes due to progressive edema. Study limitations to be considered included patient imaging at a single center intensive care unit; replication at multiple centers and patient groups is needed to further generalize results. Further study may lead to integration of MLS-AI and other automated imaging measures based on POC-MRI in new stroke care workflows to improve patient outcomes.Acknowledgements
This study was funded by the American Heart Association. Additional research funding and the POC-MRI prototype was provided by Hyperfine Research, Inc.References
1. Sheth, K. N. et al. Assessment of brain injury using portable, low-field magnetic resonance imaging at the bedside of critically ill patients. JAMA Neurol. (2020).
2. Yoo, A. J. et al. Validating imaging biomarkers of cerebral edema in patients with severe ischemic stroke. J. Stroke Cerebrovasc. Dis. 22, 742–749 (2013).
3. Wijdicks, E. F. et al. Recommendations for the management of cerebral and cerebellar infarction with swelling: a statement for healthcare professionals from the American Heart Association/American Stroke Association. Stroke 45, 1222–1238 (2014).
4. Pullicino, P. et al. Mass effect and death from severe acute stroke. Neurology 49, 1090–1095 (1997).
5. Sheth, K. N. et al. Safety and efficacy of intravenous glyburide on brain swelling after large hemispheric infarction (GAMES-RP): a randomised, double-blind, placebo-controlled phase 2 trial. Lancet Neurol. 15, 1160–1169 (2016).
6. Sandoval, K. E. & Witt, K. A. Blood-brain barrier tight junction permeability and ischemic stroke. Neurobiol. Dis. 32, 200–219 (2008).
7. Qureshi, A. I., Mendelow, A. D. & Hanley, D. F. Intracerebral haemorrhage. The Lancet 373, 1632–1644 (2009).
8. Menon, B. K. et al. Optimal workflow and process-based performance measures for endovascular therapy in acute ischemic stroke: analysis of the Solitaire FR thrombectomy for acute revascularization study. Stroke 45, 2024–2029 (2014).
9. Van Essen, David C., et al. "The WU-Minn human connectome project: an overview." Neuroimage 80 (2013): 62-79.
10. Çiçek, Ö., Abdulkadir, A., Lienkamp, S. S., Brox, T. & Ronneberger, O. 3D U-Net: learning dense volumetric segmentation from sparse annotation. in International conference on medical image computing and computer-assisted intervention 424–432 (Springer, 2016).
Figures