4024
Improved therapy planning for eye tumours: a tumour geometry comparison between MRI and conventional ultrasound1Department of Ophthalmology, LUMC, Leiden, Netherlands, 2Department of Radiology, LUMC, Leiden, Netherlands, 3Department of Radiotherapy, LUMC, Leiden, Netherlands
Synopsis
Ocular magnetic resonance imaging, enabling 3D tumour imaging and providing better soft tissue contrast than conventional ultrasound, is increasingly used for uveal melanoma. The aim of this research was to determine the difference in geometrical tumour measurements between ultrasound and MRI. For this purpose, tumour prominence and largest basal diameter were calculated automatically based on MR imaging and compared to the US measurements. Differences >0.5mm were observed in 55% of prominence measurements and 80% of LBD measurements. Furthermore, automatically measuring tumour geometry based on 3D MR imaging lead to the discovery of inconsistencies in measurement definitions within and across disciplines.
Introduction
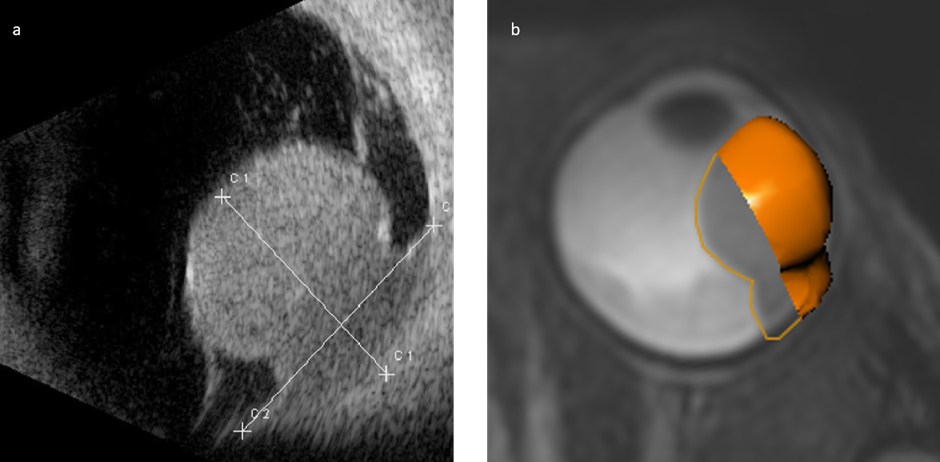
Uveal melanoma (UM) is the most frequently occurring primary malignant eye tumour 1. Clinical treatment decision making and radiotherapy planning for UM rely mostly on ultrasound (US) measurements (Figure 1a), such as tumour prominence (depth) and largest basal diameter (LBD) 1-3. A slight deviation in these measurements can result in a shift between an eye-preserving treatment, such as ruthenium plaque brachytherapy or proton beam therapy (PBT), and enucleation. However, the US measurement is limited, as it is a 2D imaging technique with a high inter-observer variation 4. Moreover, for accurate geometrical tumour measurements the US transducer needs to be placed perpendicularly to the tumour, which is not always possible.Recent advances have enabled high resolution ocular MRI in a clinical setting, providing 3D tumour images 5. Up to now, a complete overview of the difference in prominence and LBD between the conventionally used US measurements and the most recent MRI techniques is lacking.
The aim of this study, therefore, was to compare the geometrical tumour measurements between US and MRI.
Methods
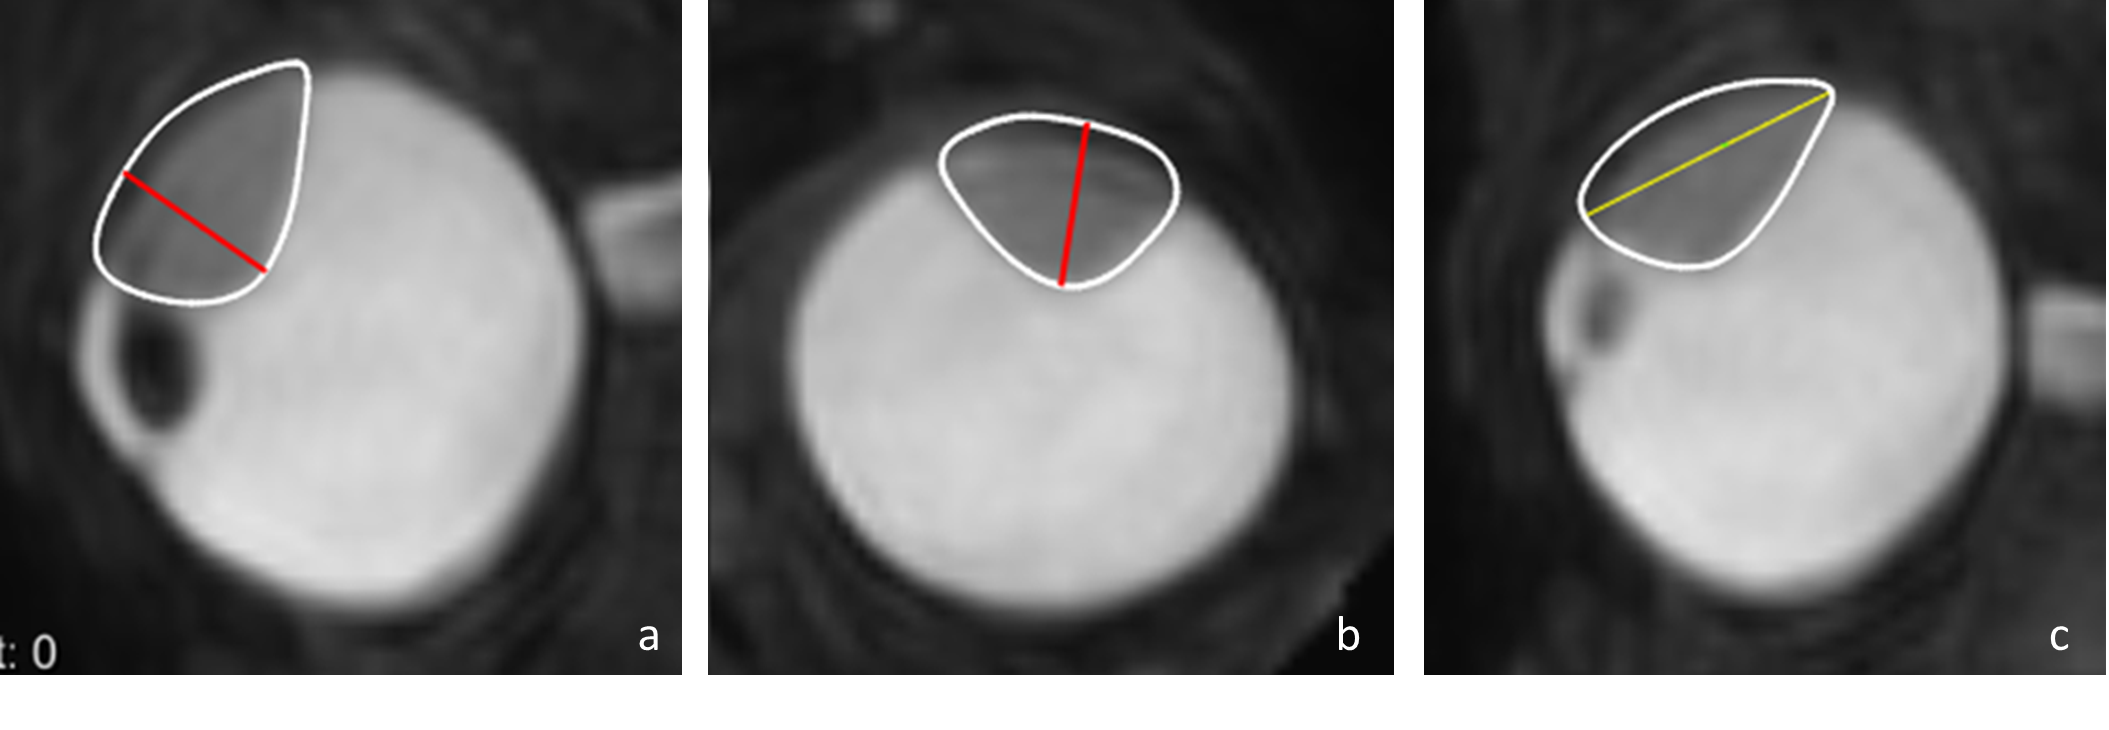
Data of 42 UM patients was analysed, after approval of the local ethics committee. Patients were scanned with a 4.7cm Rx-coil at 3T (Philips Healthcare, Best, The Netherlands), according to the protocol of Ferreira 5. For this study, the 3D fat-suppressed Turbo Spin-Echo T2-weighted scan (voxel size 0.8x0.8x0.8mm3, TE/TR: 293/2300ms, 3:35 min) was used to semi-automatically delineate the tumour. The 3D fat-suppressed contrast-enhanced Turbo Spin-Echo T1-weighted scan was used as a reference to differentiate between tumour and associated retinal detachment.Clinical US measurements were performed using a 10MHz probe. For US, no strict geometrical definitions of the prominence and LBD are used clinically. For the 3D MR-images, the prominence was defined as the maximum distance between the top and base of the tumour, perpendicular to the sclera. The LBD was defined as the largest distance between two points in the tumour base. An ocular oncologist scored if the proposed geometric definition matched the conventional clinical interpretation of tumour prominence or LBD.
In the comparison between MRI and US, we considered differences larger than 0.5mm as clinically relevant.
A first evaluation of the MR-derived measures was performed by simulating the treatment selection using only the US or MR tumour measurements: patients with a tumour prominence below 7 mm and an LBD below 16 mm were considered eligible for ruthenium plaque brachytherapy, while patients with larger tumour measurements would receive PBT or enucleation.
Results
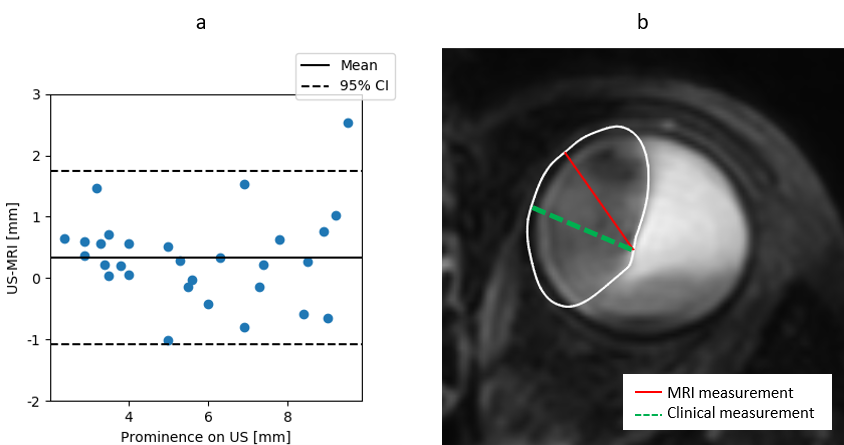
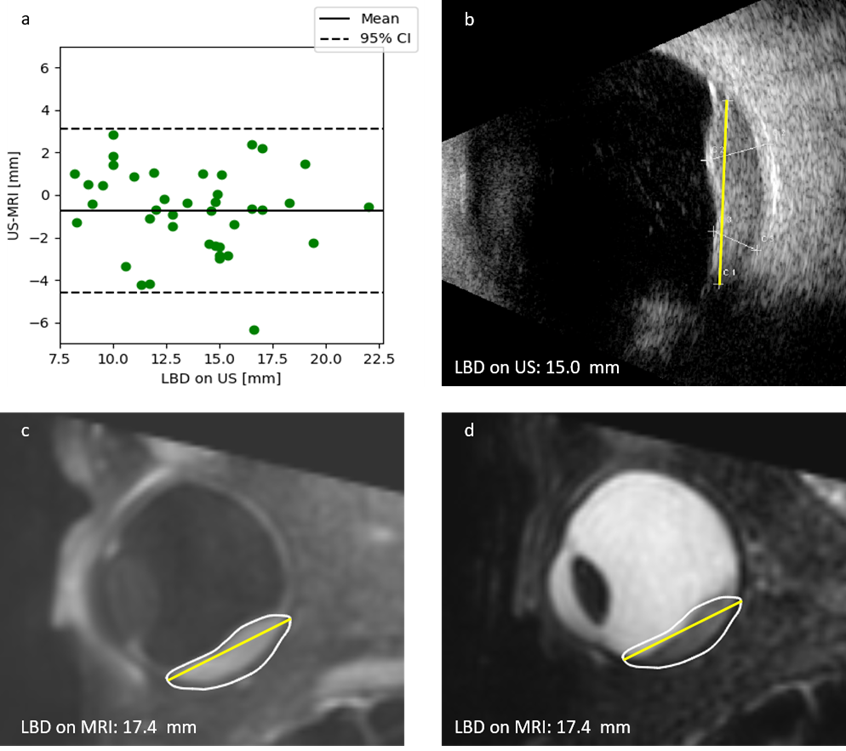
The 42 subjects had a mean age of 65 ± 12 years. 68% of tumours were melanotic, 13% were amelanotic and 19% were mixed. For the prominence, 29 out of 42 automatic MRI measurements matched the clinical US prominence definition (Figure 3). For the matching measurements, 55% of the prominence differences were larger than 0.5 mm, with the measurement being larger on US in 65% of cases (Figure 3).For the LBD, 40 out of 42 automatic MRI measurements were matched the clinical US definition.. 80% of the differences in LBD were larger than 0.5 mm, with the measurement being larger on MRI in 65% of cases (Figure 4). For 8 patients, a change between or within treatments was made, if only the MRI measurement would have been used instead of only the US measurement for treatment decision making.
Discussion
In 31% of the patients the proposed geometric definition of the tumour prominence did not match the ophthalmologists prominence definition. These inconsistencies were most apparent in large or irregularly shaped tumours. Moreover, inconsistencies were observed between different specialisms involved, such as radiation oncologists, ophthalmologists and radiologists, indicating a need for a standardised definition of tumour measurements, incorporating the 3D information that ocular MRI can supply.For other patients, whose measurements matched the clinical definition, differences of 0.5 mm and larger were observed in 55% of prominence measurements and 80% of LBD measurements. The observed differences are likely explained by oblique cuts through the tumour with 2D US and the difficulty imaging the entire tumour base in the limited field-of-view of the US. The addition of MRI made a difference in the virtual treatment selection in 19% of patients, indicating that the 3D tumour description with MRI can be of added value. For a more clinical evaluation, however, the tumour location and other imaging data, such as fundus photography, should be incorporated in the analysis.
Conclusion
Ocular MRI can contribute to a more accurate description of the tumour geometry, enabling more accurate therapy planning and selection for uveal melanoma patients.Acknowledgements
No acknowledgement found.References
1. Jager MJ, Shields CL, Cebulla CM, Abdel-Rahman MH, Grossniklaus HE, Stern MH, et al. Uveal melanoma. Nat Rev Dis Primers. 2020;6(1):24.
2. Kaliki S, Shields CL. Uveal melanoma: relatively rare but deadly cancer. Eye (Lond). 2017;31(2):241-57.
3. Yang J, Manson DK, Marr BP, Carvajal RD. Treatment of uveal melanoma: where are we now? Ther Adv Med Oncol. 2018;10:1758834018757175.
4. Haritoglou C, Neubauer AS, Herzum H, Freeman WR, Mueller AJ. Interobserver and intraobserver variability of measurements of uveal melanomas using standardised echography. Br J Ophthalmol. 2002;86(12):1390-4.
5. Ferreira TA, Grech Fonk L, Jaarsma-Coes MG, van Haren GGR, Marinkovic M, Beenakker JM. MRI of Uveal Melanoma. Cancers (Basel). 2019;11(3).
Figures