4021
UTE-MRI complements CT in bone characterization for improved proton therapy dose calculation1Siemens Medical Solutions USA Inc., Boston, MA, United States, 2Department of Radiation Oncology, Dana-Farber/Brigham and Women's Cancer Center, Boston, MA, United States, 3Siemens Healthcare GmbH, Erlangen, Germany
Synopsis
CT-based proton therapy dose calculation suffers from significant uncertainties that critically limit clinical efficacy. Previous works demonstrated improved proton range calculation by combining quantitative MRI with CT. This study extends those works into bone, a challenging region for tissue characterization. CT and a novel UTE MRI technique were used to investigate their complimentary information for bone characterization. Both phantom and in vivo experiments showed that combining UTE-MRI and CT measurements achieved accurate classification of bone types. Understanding of bone types can have significant implications on the determination of bone tissue composition and, ultimately, accuracy of radiation delivery in proton therapy.
Introduction
Proton therapy delivers most of the radiation dose at a distal target tumor while sparing healthy tissues along the radiation path. The clinical standard for proton treatment planning is based on CT Hounsfield units (HU). However, due to the differences of photon and proton interactions with matter, CT-based proton range calculations can have significant uncertainties that are generally considered the greatest clinical limitation for proton therapy treatments1. Previous works2 have demonstrated that combining quantitative MRI and CT can improve proton range determination accuracy. However, bone characterization still remains a challenge when CT or MR alone is used. While the mineralized component of bone has high CT contrast, the remaining molecule types (water, fat/marrow, protein) tend to be degenerate in terms of CT contrast due to similar atomic compositions. For MRI, the challenge is detecting short T2* signals within bone and simultaneously separate out the non-mineralized contents3. Standard4,5 or ultra-short echo time (UTE) techniques6 have demonstrated the capability of accurately measuring proton density (PD)4, transversal relaxation (R2*)5,6 and susceptibility5,6 of bone. Yet, research has been sparse on the complimentary information from MRI and CT for bone characterization. In this work, CT and a novel UTE MRI sequence, enabling simultaneous quantification of PD, R2* and fat fraction (FF), were used to provide a unique set of data that can potentially improve proton range calculation accuracy within bone.Methods
Ex-vivo tissue phantom experiment: A pork shoulder was scanned on a 3T scanner (MAGNETOM Vida, Siemens Healthcare, Erlangen, Germany). A prototype gradient echo sequence with UTE and stack-of-spirals sampling trajectory was used7,8. To densely sample the bone signal evolution, 22 consecutive scans were acquired, each with a TE from 30 us to 4 ms. Sequence parameters: resolution = 1x1x3 mm3, TR = 5 ms, flip angle = 15°, FoV = 480x480x120 mm3, scan time = 1.5 min. The phantom was also imaged with CT at 120 kVP and 0.35 pitch (SOMATOM Confidence, Siemens Healthcare, Erlangen, Germany).Image processing: PD was measured on the first echo image (TE = 30 us) after correction of N4 bias field (MIM Software, Cleveland, OH). Fat fraction (FF) and R2* were calculated from the 22-echo data using an open-source package, chemical species separation model with the VARPRO solver [9], assuming the following signal equation:
$$s(r,\ t)=(\rho_w(r)\ e^{-R_2^\ast(r)t}+\rho_f(r)\ \sum_n\alpha_n\ e^{-i2\pi f_n\ t}\ )*e^{-i2\pi\Delta f_0 (r)t}$$
Here, $$$s(r,\ t)$$$ is multi-echo signal, $$$\rho_w$$$ and $$$\rho_f$$$ are water and fat complex amplitudes at t=0, respectively, $$$\alpha_n$$$ is relative amplitude of the nth spectral fat peak, and $$$\Delta f_0$$$ is B0 field inhomogeneity. A nine-peak fat model was used. The R2* decay term was only applied to the water component, assuming fat components do not significantly decay within the time frame of investigation (< 4ms)6.This calculation was performed off-line in MATLAB (MathWorks Inc., Natick, MA).
CT images were registered to MR images (MIM). A binary bone mask was generated by manual segmentation. Pixels within the bone mask were automatically classified into four groups by applying a k-means clustering algorithm to the combined data of CT HU, MR PD, and FF.
In-vivo experiment: This study was approved by the institutional review board. One patient who underwent CT and MR simulation for prostate radiotherapy planning participated in this study after informed written consent. The patient was scanned using the prototype UTE-MRI sequence with four echoes (TE = 0.03, 0.83, 1.70, 2.50 ms, resolution = 2x2x3 mm3, FOV = 480x480x288 mm3, total scan time = 10 min). All other scan parameters and image processing were the same as the ex-vivo tissue phantom experiment.
Results
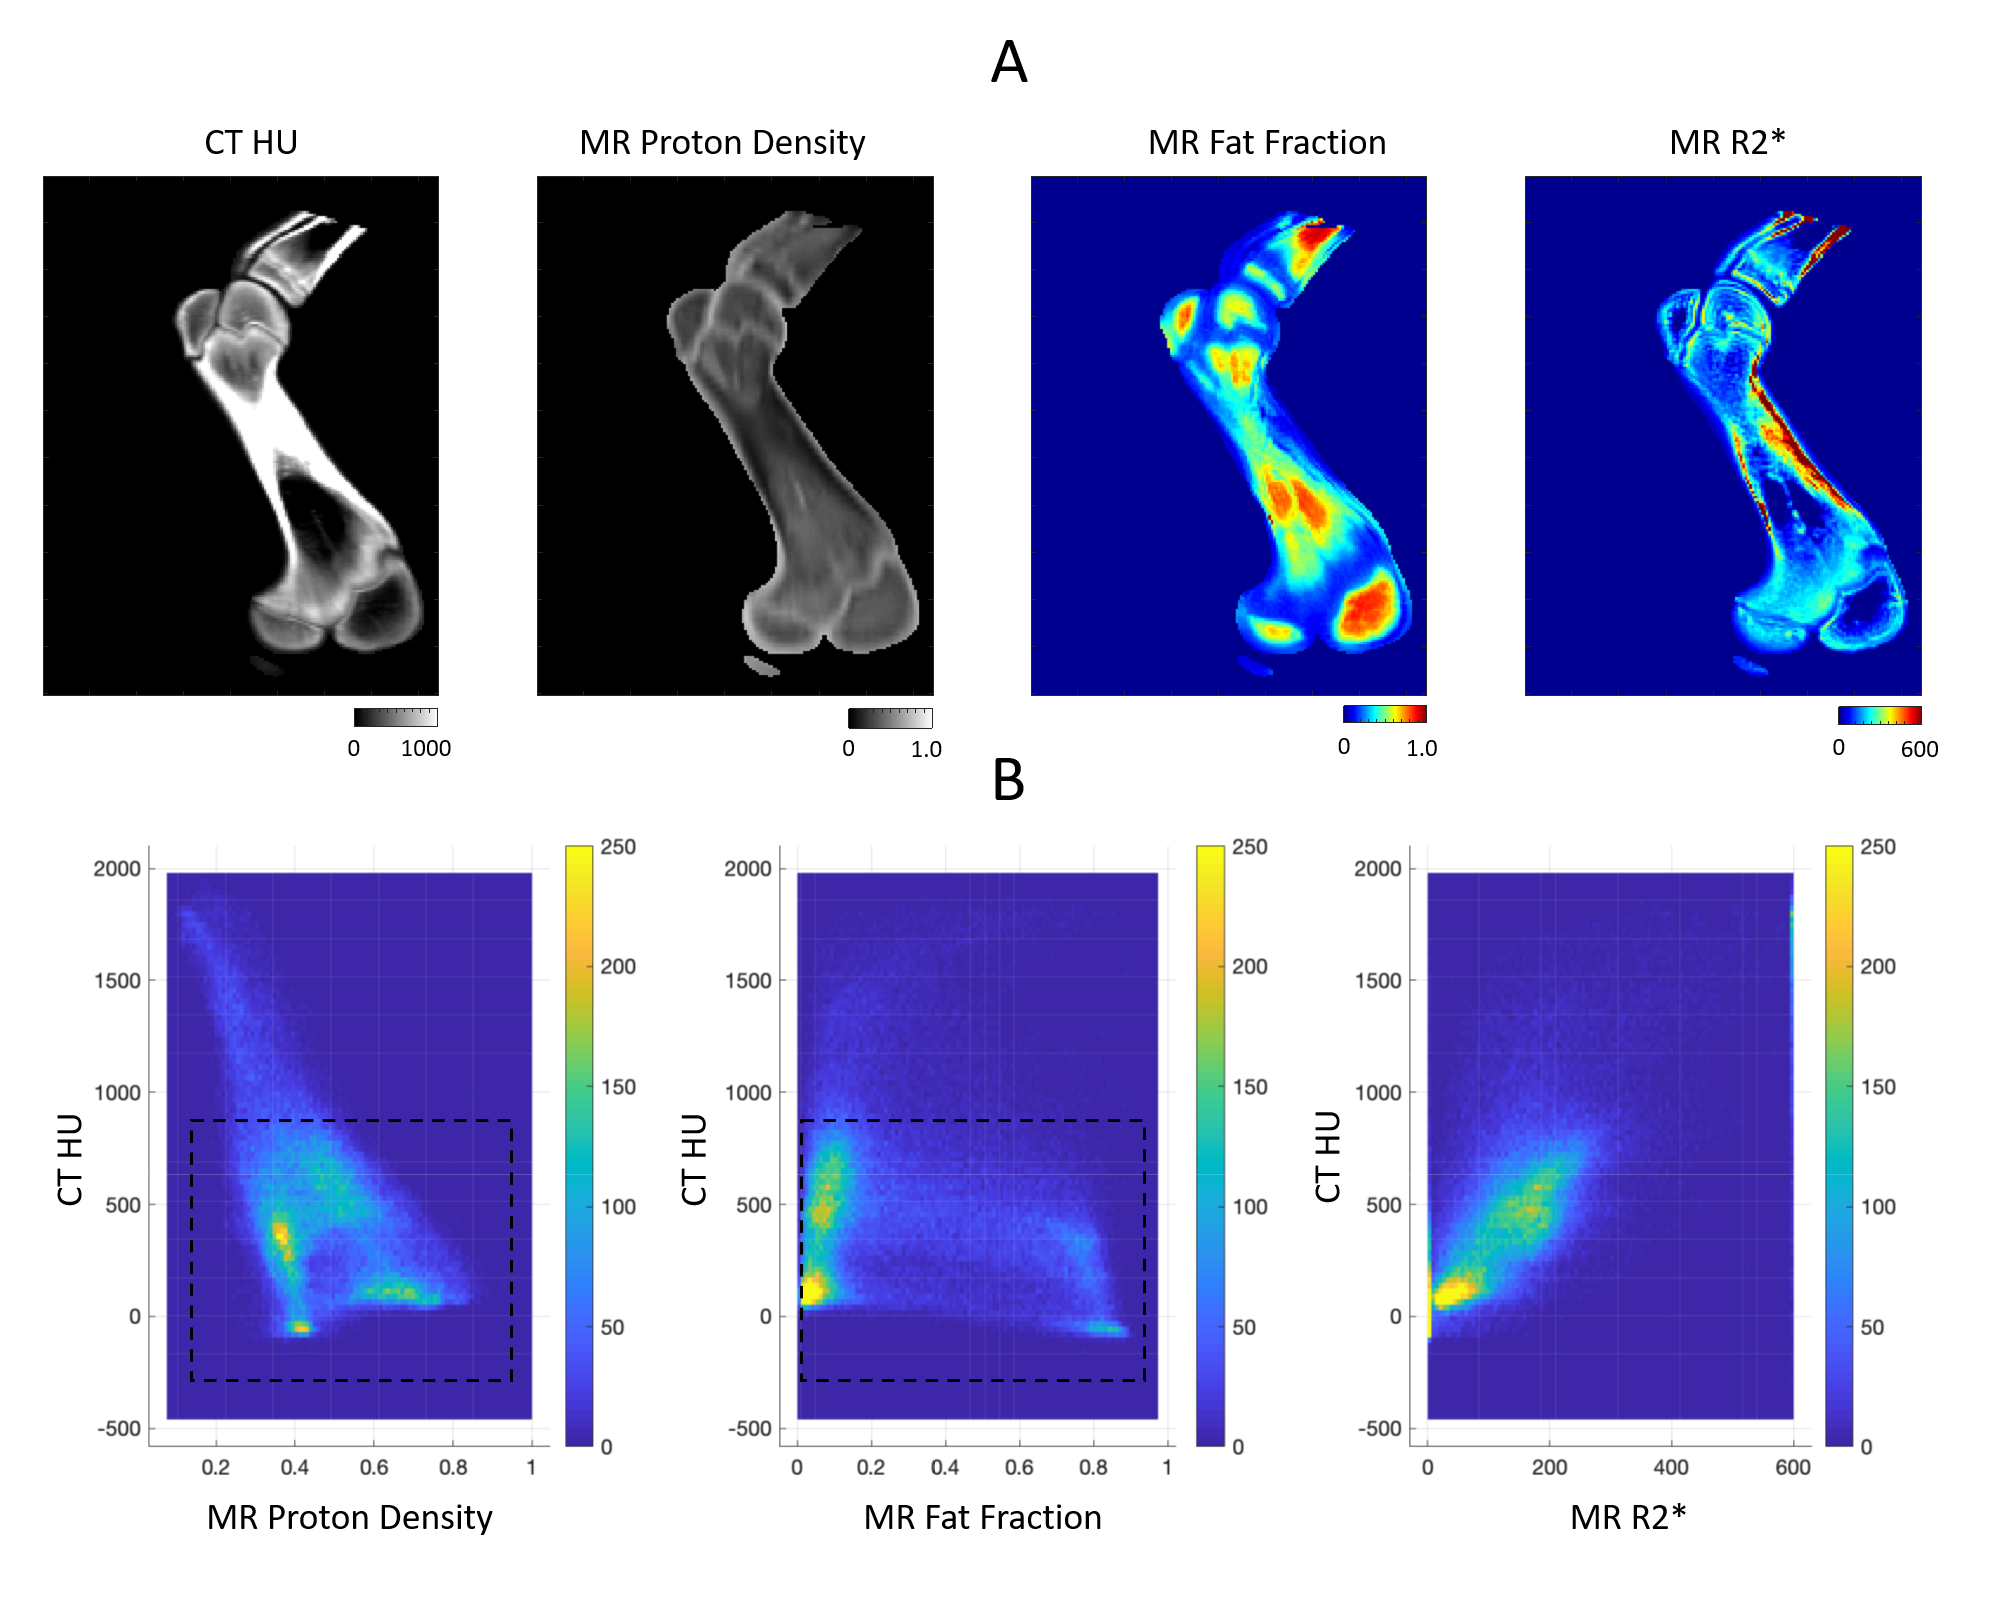
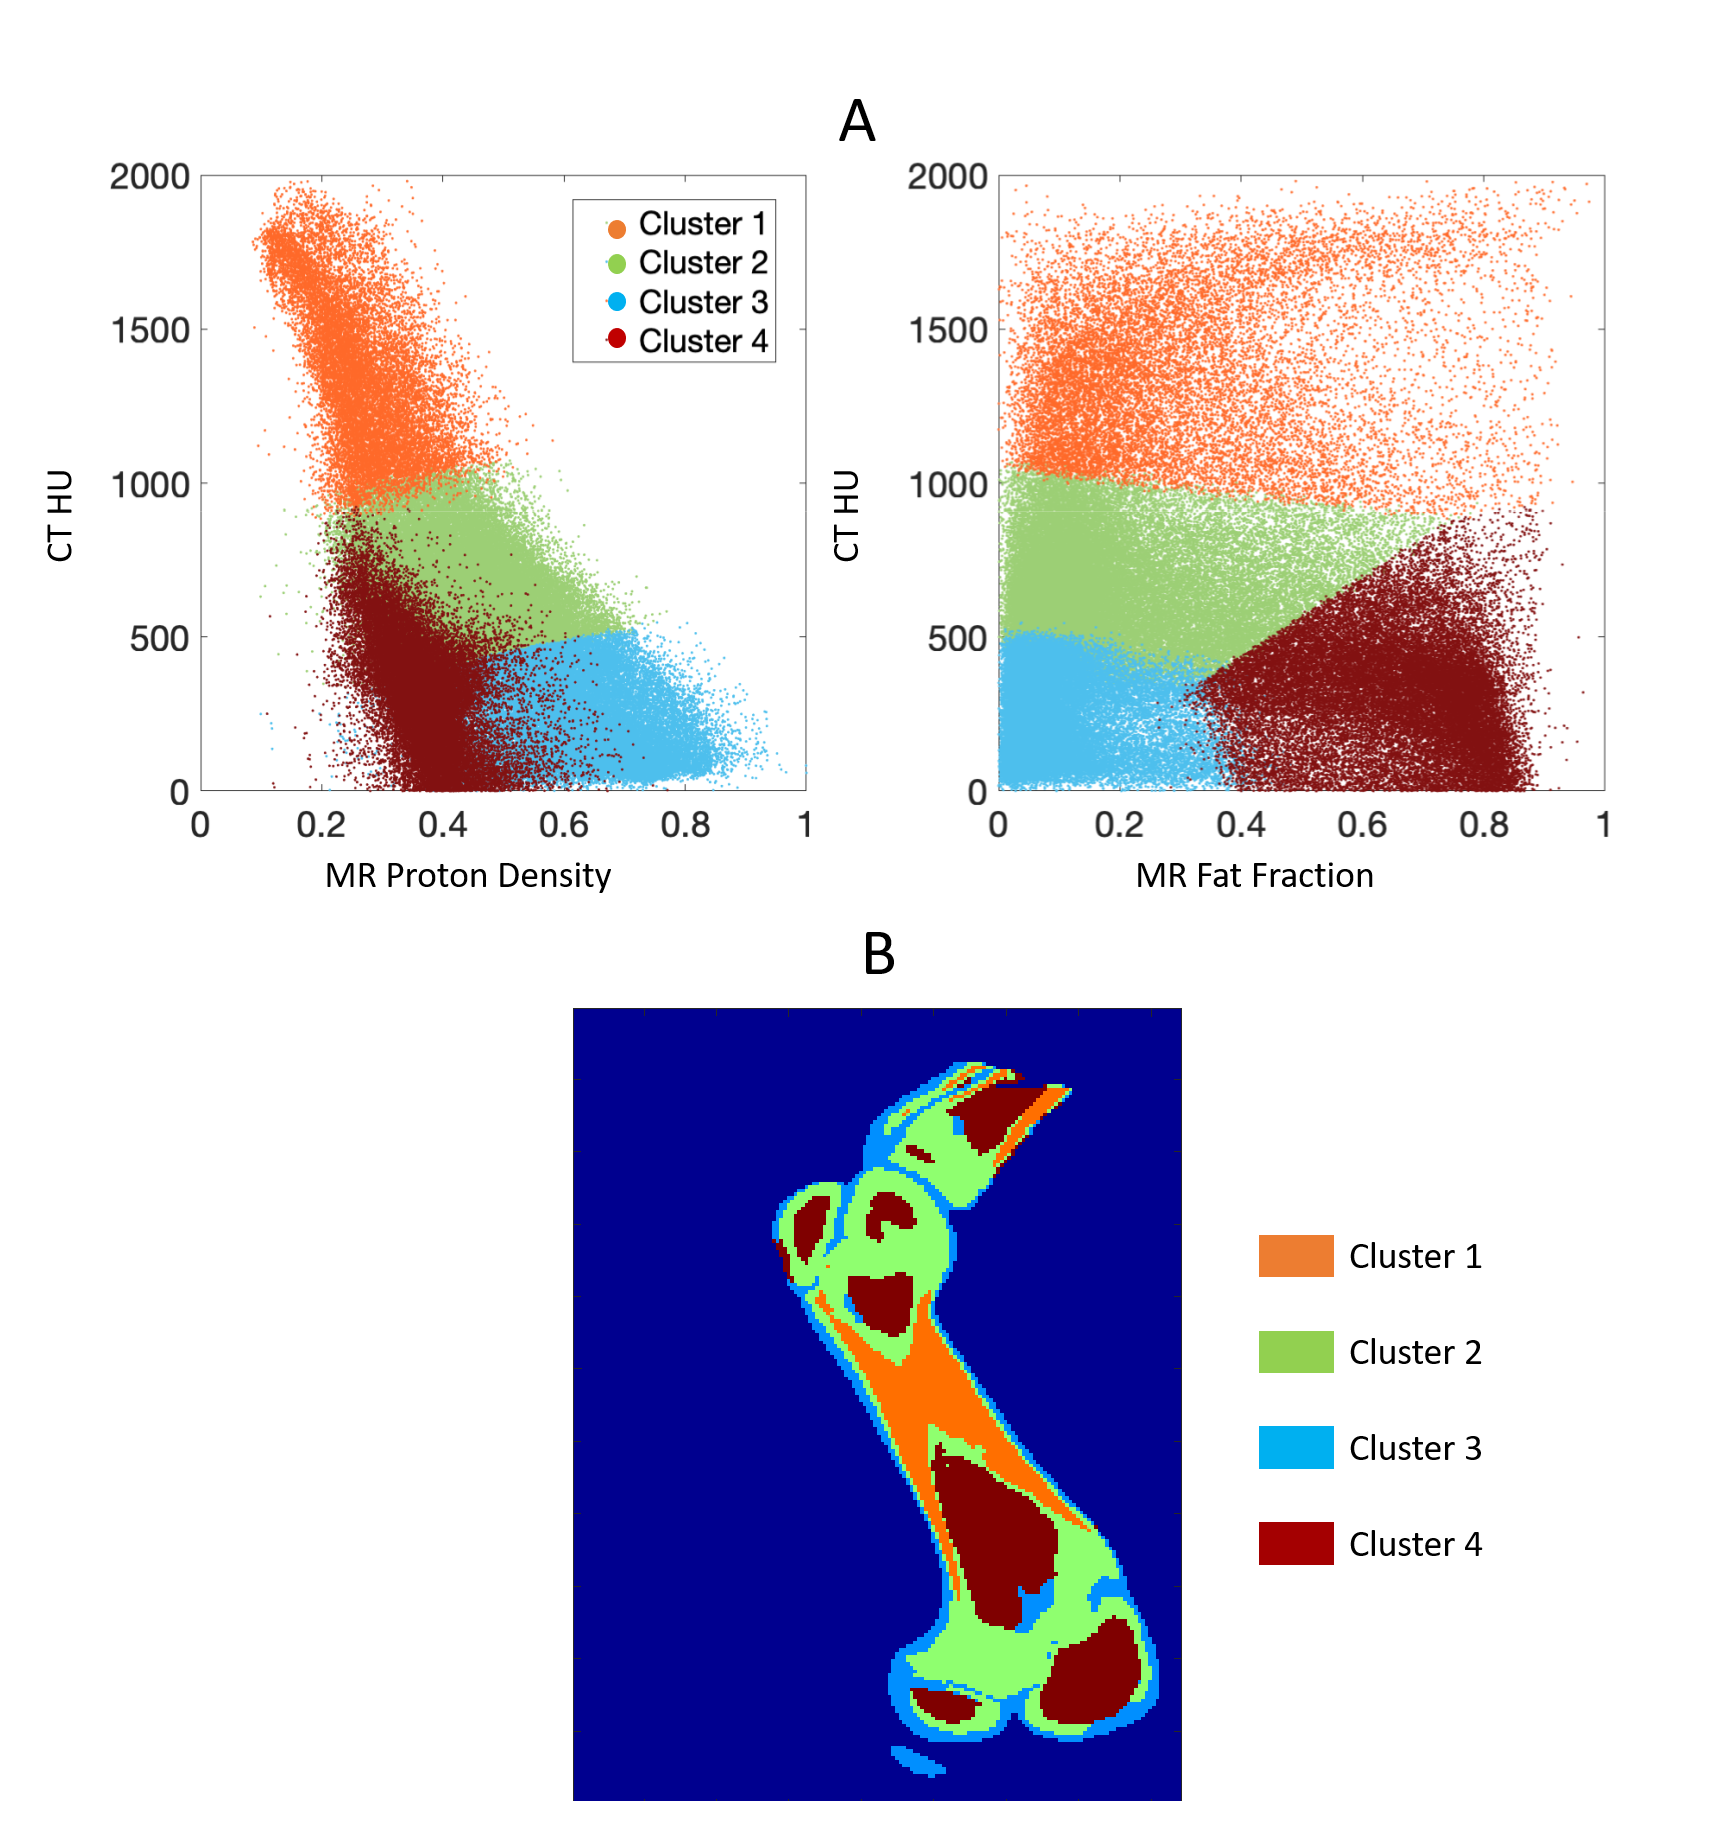
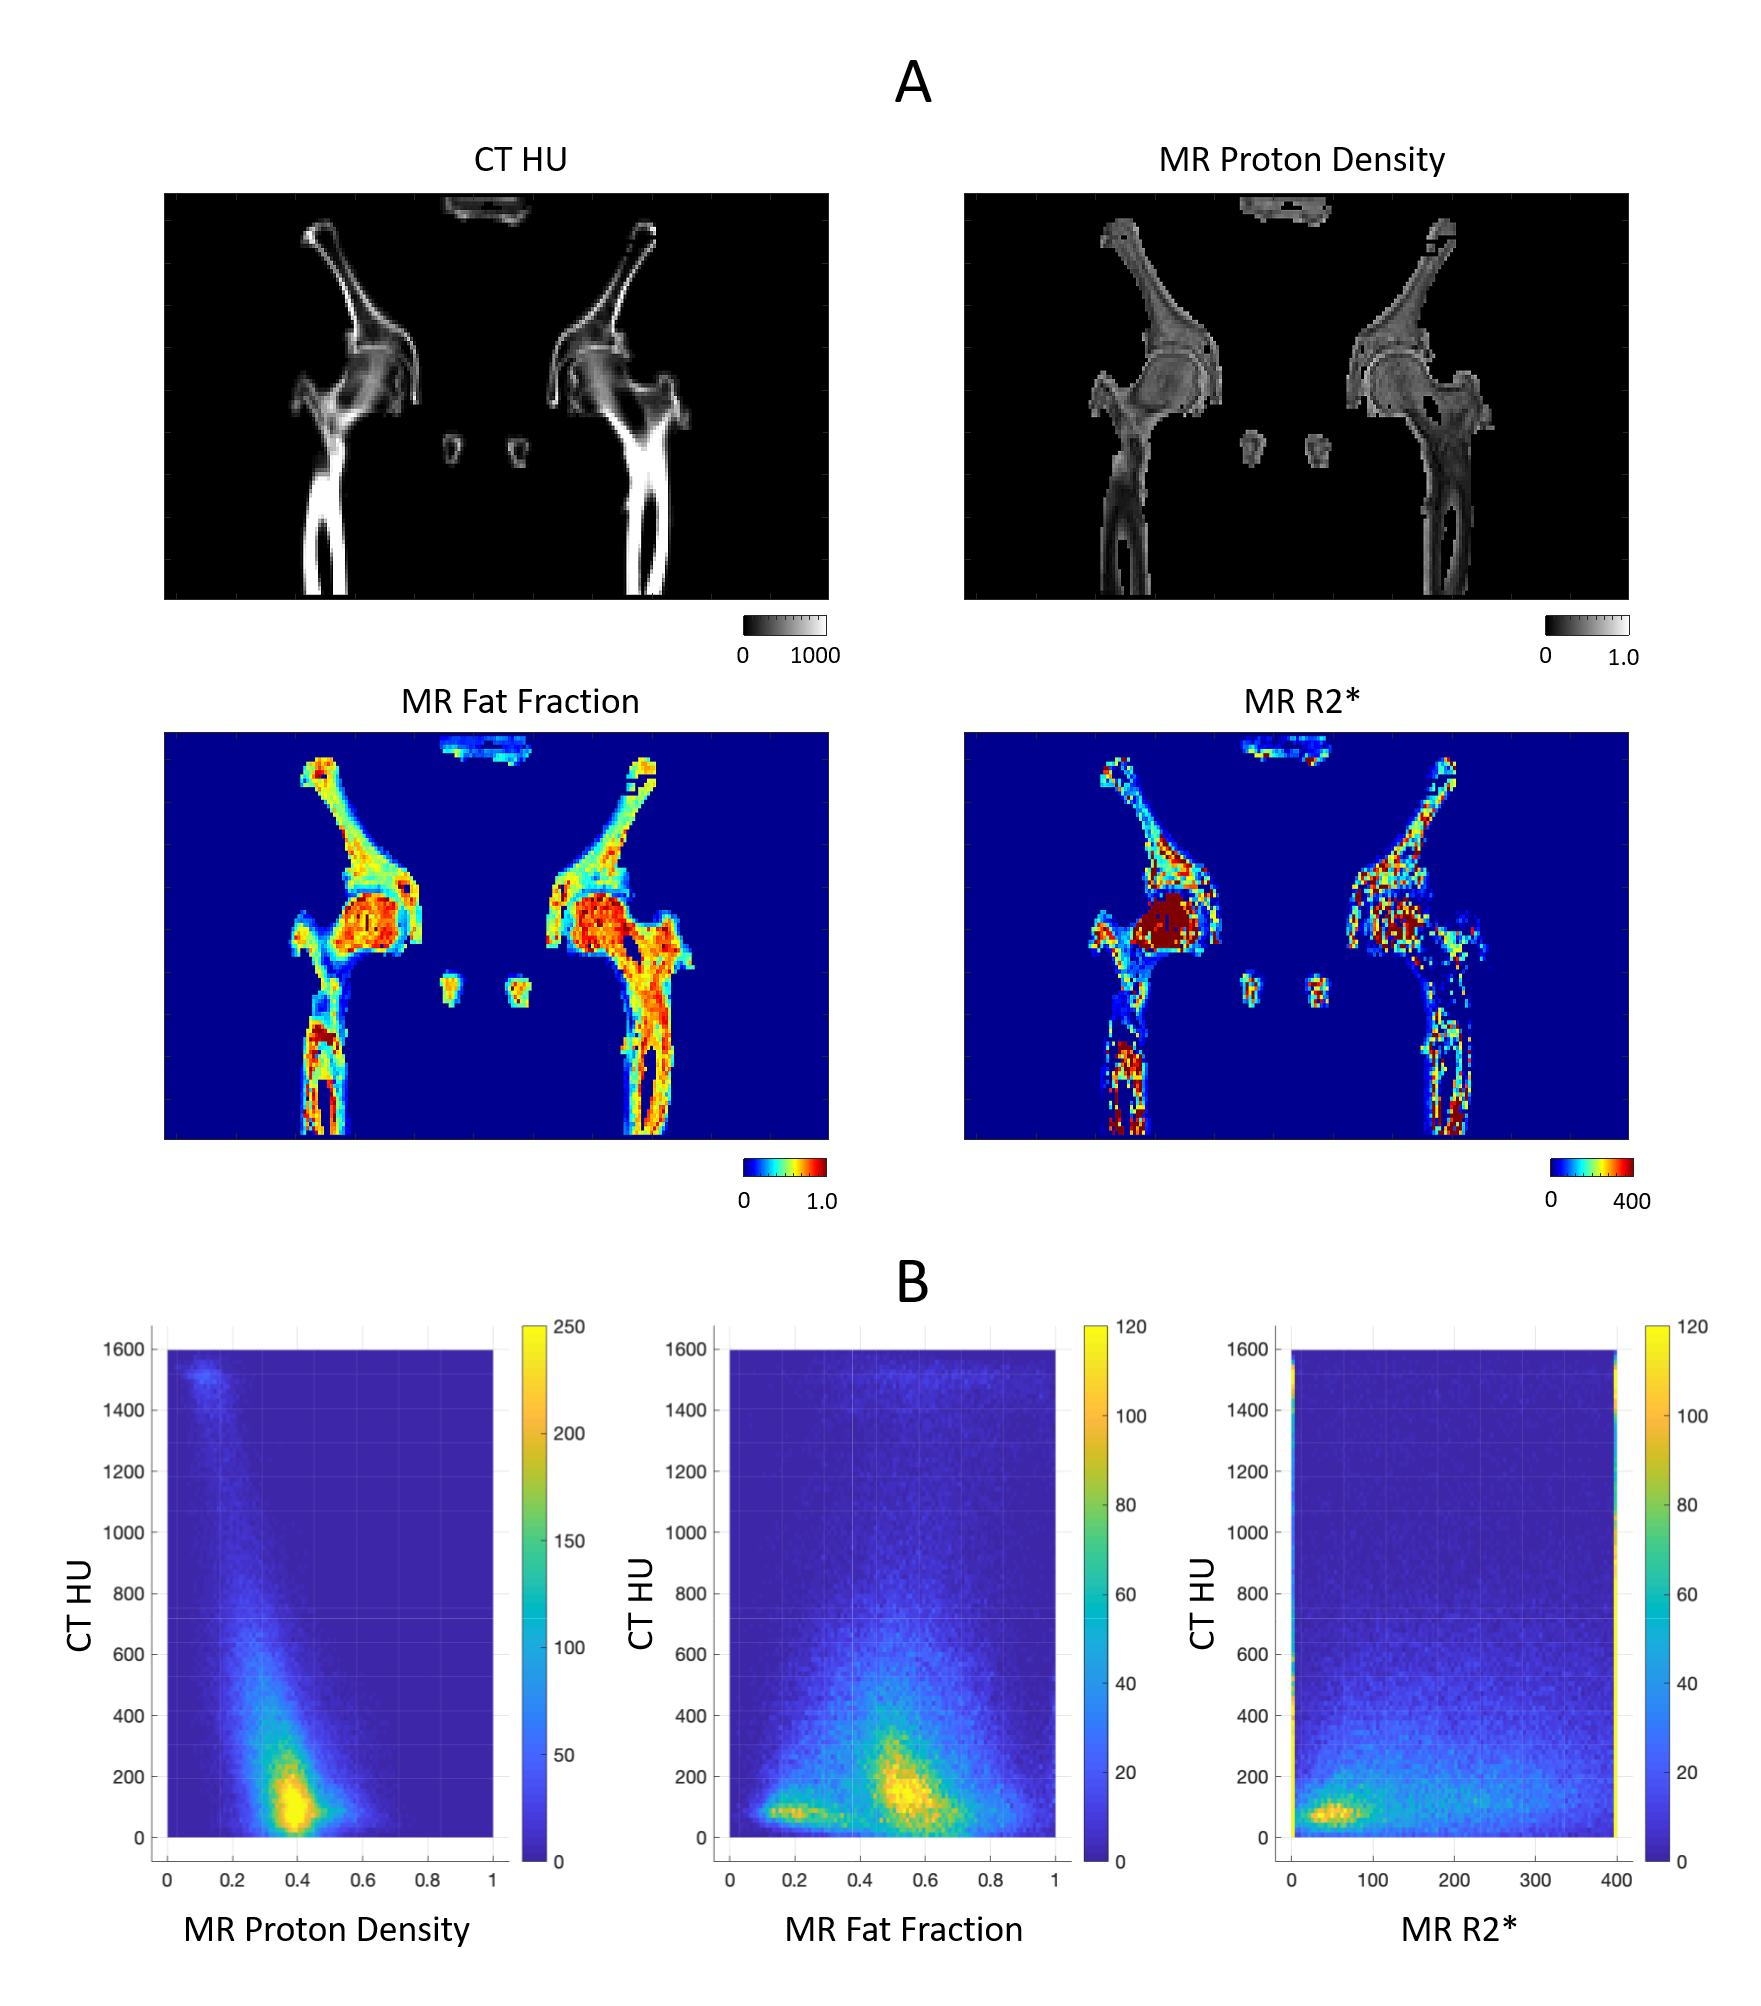
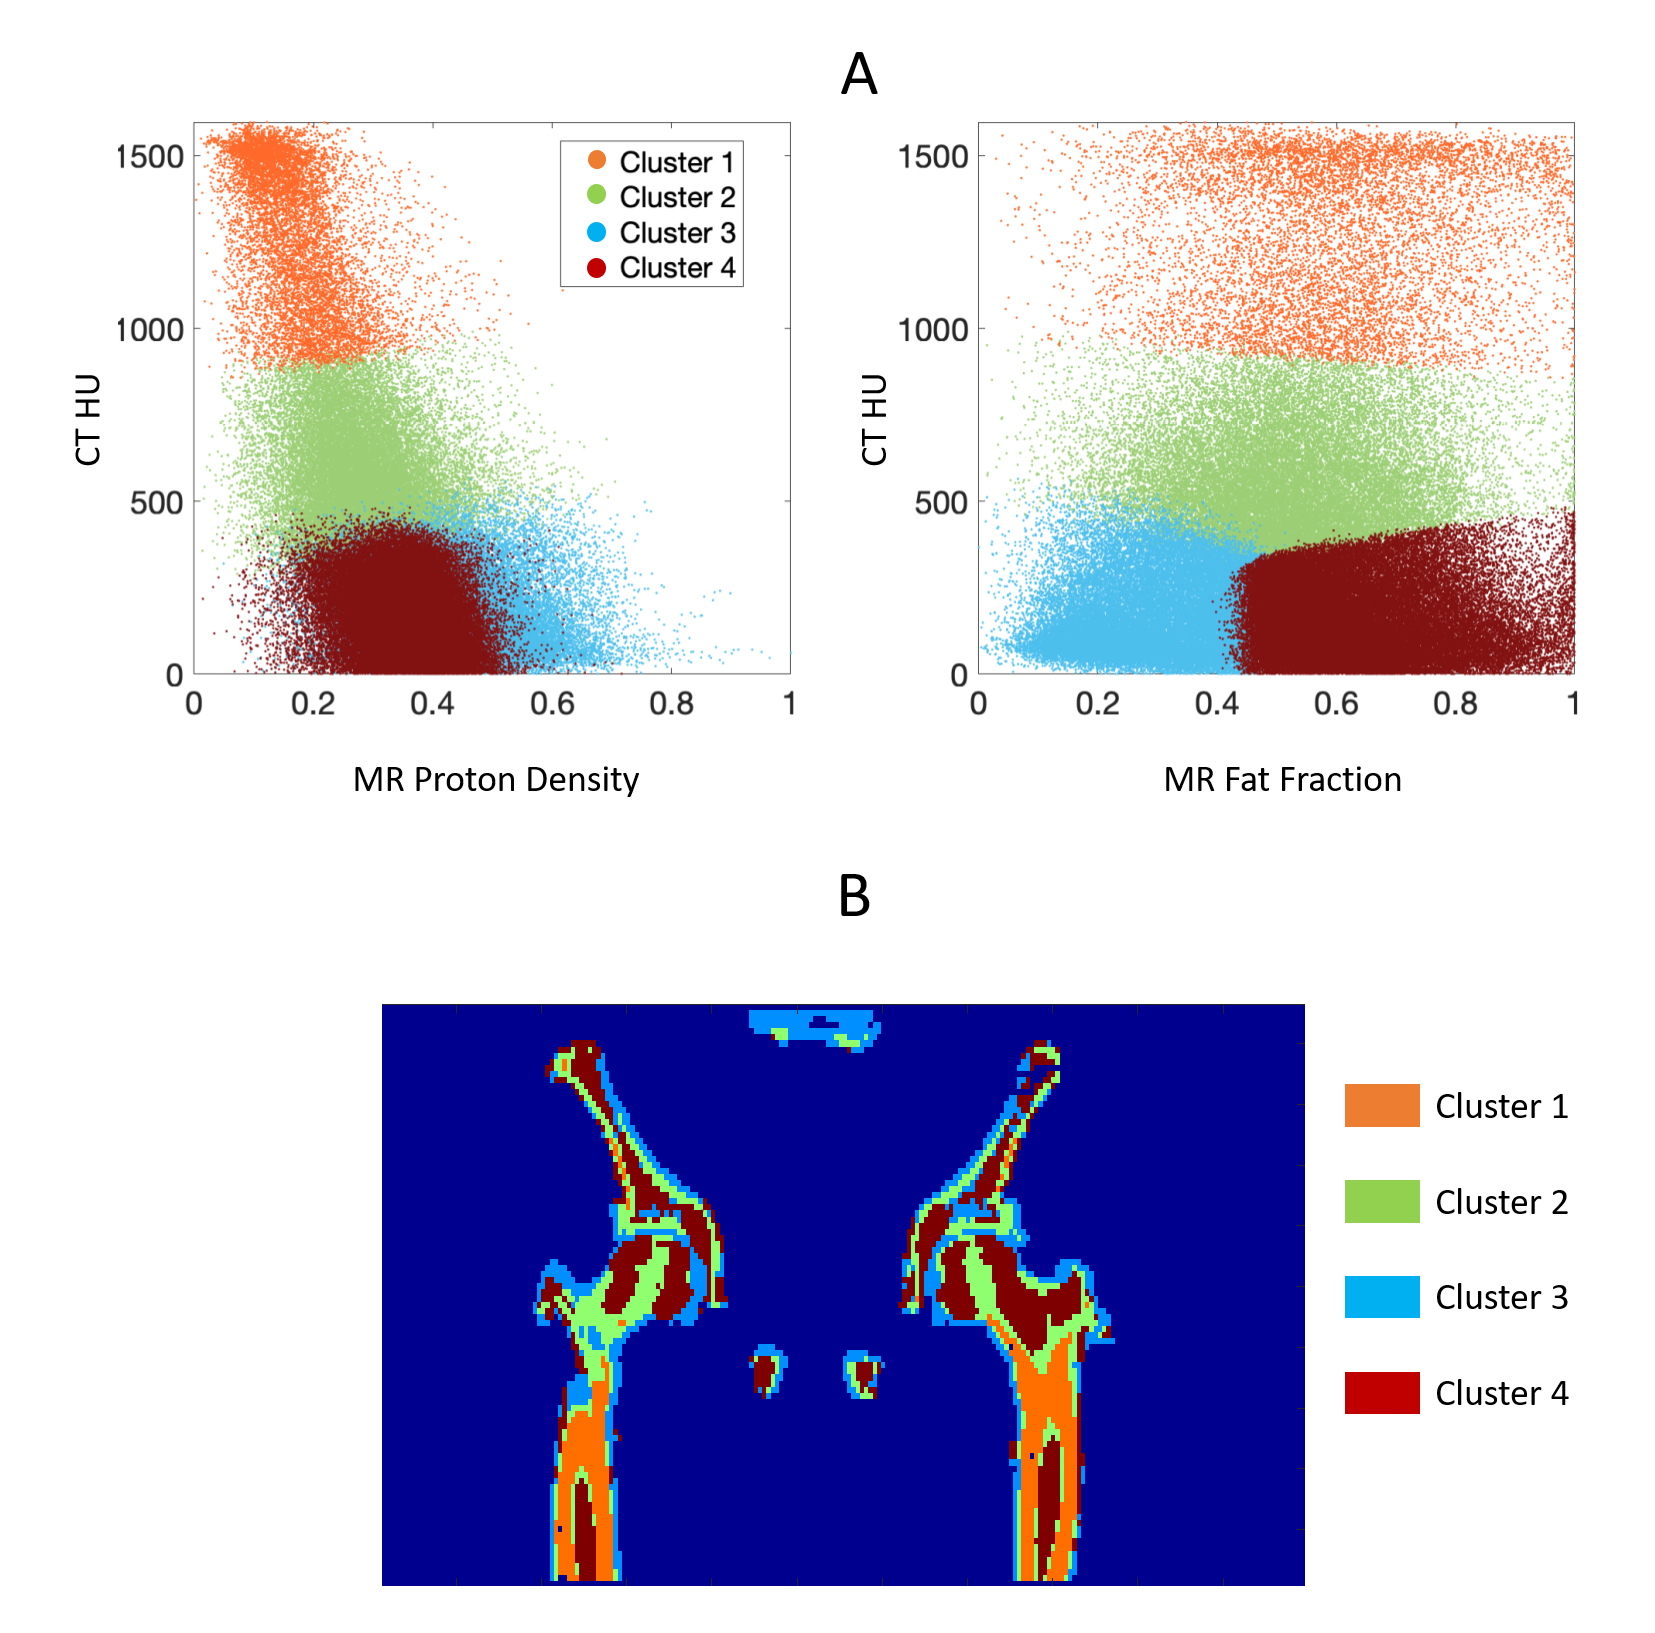
Figure 1 shows the measured and fitted signal evolution at 22 echo times in selected ROIs. Figure 2 presents the distribution of HU numbers and MRI quantifications. Cortical bone with high CT values had low proton density and high R2* measurements, whereas trabecular bone showed a higher fat fraction, higher proton density and lower R2*. Although HU values correlated with MR proton density (R2 = 0.32) and with R2* (R2 = 0.44), ambiguity of CT in non-mineral tissue composition started to show for HU < 900 (Figure 2B). In Figure 3, k-means clustering applied to the combined data of CT HU, MR PD and FF produced reasonable classification and presented spatial correspondence to four tissue types in the bone region: cortical bone (cluster 1), trabecular bone (cluster 2), bone marrow (cluster 4), and soft tissue (cluster 3). Similar results were observed in vivo (Figure 4 and 5). K-means clustering produced segmentation with lower accuracy compared to the ex-vivo phantom experiment. Potential patient position changes and MR-CT registration errors may have reduced the accuracy of the results.Discussion
K-means clustering provided semi-quantitative evidence that, compared to either CT or UTE-MR alone, the two modalities compliment each other to enable a more detailed classification of bone types. Understanding of bone type has significant implications on determination of bone tissue composition and, ultimately, the accuracy of radiation delivery in proton therapy10,11. Moving forward, quantitative validation could be performed with electron density measurement such as MVCT. Future measurements in larger patient populations need to consider the optimal choice of UTE-MRI echo time and total scan time.Acknowledgements
Research reported in this abstract was partially supported by the NIBIB of the National Institutes of Health under award number R21EB026086. The content is solely the responsibility of the authors and does not necessarily represent the official views of the National Institutes of Health.References
[1] Knopf AC, Lomax A. In vivo proton range verification: a review. Physics in Medicine & Biology. 2013 Jul 17;58(15):R131.
[2] Scholey JE, Chandramohan D, Naren T, Liu W, Larson PE, Sudhyadhom A. A methodology for improved accuracy in stopping power estimation using MRI and CT. Medical Physics. 2020 Oct 27.
[3] Wehrli FW. Magnetic resonance of calcified tissues. J Magn Reson 2013;229:35–48.
[4] Ho KY, Hu HH, Keyak JH, Colletti PM, Powers CM. Measuring bone mineral density with fat-water MRI: comparison with computed tomography. J Magn Reson Imaging. 2013 Jan;37(1):237-42.
[5] Diefenbach MN, Meineke J, Ruschke S, Baum T, Gersing A, Karampinos DC. On the sensitivity of quantitative susceptibility mapping for measuring trabecular bone density. Magn Reson Med. 2019 Mar;81(3):1739-1754.
[6] Dimov AV, Liu Z, Spincemaille P, Prince MR, Du J, Wang Y. Bone quantitative susceptibility mapping using a chemical species-specific R2* signal model with ultrashort and conventional echo data. Magn Reson Med. 2018 Jan;79(1):121-128.
[7] Qian Y, Boada FE. Acquisition-weighted stack of spirals for fast high-resolution three-dimensional ultra-short echo time MR imaging. Magn Reson Med. 2008 Jul;60(1):135-45.
[8] John P. Mugler, III, Samuel W. Fielden, Craig H. Meyer, et al. Breath-hold UTE Lung Imaging using a Stack-of-Spirals Acquisition. Proc. Intl. Soc. Mag. Reson. Med. 23 (2015); 1476.
[9] Diefenbach MN, Ruschke S, Karampinos DC. A generalized formulation for parameter estimation in mr signals of multiple chemical species. Proc. Intl. Soc. Mag. Reson. Med. 25 (2017); 5181.
[10] Zhou H, Keall PJ, Graves EE. A bone composition model for Monte Carlo x‐ray transport simulations. Medical physics. 2009 Mar;36(3):1008-18.
[11] White DR, Woodard HQ, Hammond SM. Average soft-tissue and bone models for use in radiation dosimetry. The British journal of radiology. 1987 Sep;60(717):907-13.
Figures