4005
Development and Evaluation of an MR-safe Interventional Catheter with Tunable MR Visibility and Radiopacity
Bridget F Kilbride1, Caroline D Jordan2, Andrew Chu3, Dave Barry3, Kerstin Mueller4, Sinyeob Ahn4, Teri Moore5, Mark W Wilson5, and Steven W Hetts5
1Radiology and Biomedical Imaging, University of California San Francisco, San Francisco, CA, United States, 2Texas A&M University, Houston, TX, United States, 3Penumbra, Inc., Alameda, CA, United States, 4Siemens Medical Solutions, Malvern, PA, United States, 5University of California San Francisco, San Francisco, CA, United States
1Radiology and Biomedical Imaging, University of California San Francisco, San Francisco, CA, United States, 2Texas A&M University, Houston, TX, United States, 3Penumbra, Inc., Alameda, CA, United States, 4Siemens Medical Solutions, Malvern, PA, United States, 5University of California San Francisco, San Francisco, CA, United States
Synopsis
Interventional MRI catheter-based procedures are greatly limited by current devices and their safety profiles, and next-generation MR-safe devices are still in development. We designed and evaluated a polymeric catheter concept that is both safe and visible in MRI and X-ray environments. All imaging was done in a two-room hybrid angio-MR suite to demonstrate compatibility with next-generation image-guided procedures. In a phantom, we acquired GRE and TSE sequences at 3T and imaged on a clinical biplane angiographic system to quantitate MRI visibility and radiopacity, respectively. The catheters exhibited promising tracking characteristics under MRI and X-ray on a polymer-based catheter.
Introduction
Acute ischemic stroke can be treated effectively under X-ray guidance, but such treatment is limited by time windows following symptom onset. As a result, fewer than 10% of patients may receive such treatment1. These narrow windows could be extended with MRI information since diffusion weighted imaging (DWI), in combination with perfusion imaging, is the gold standard in determining if brain tissue is still salvageable by reperfusion therapy2. Recently, it has been demonstrated that two-room hybrid angio-MR suites enable intraprocedural definition of core infarct and penumbra in cases of stroke3. Unfortunately, interventional MRI for decision making in emergency situations, e.g. mechanical thrombectomy is limited, in part, due to lack of adequate devices designed to meet the safety constraints presented by the MRI environment. Catheter tip visualization is paramount to safe vascular navigation. The distal tip of an endovascular device should not only be easily visible under fluoroscopy, but also must produce an artifact no larger than the vessel dimensions under MRI. Recent work created a polymeric catheter with comparable kink resistance to commercial guide catheters, featuring radiopaque markers doped with iron oxide nanoparticles (IONPs) yielding low-profile, MR-visible passive markers with radiopacity4. In this study, we evaluated the tunability of these markers in vitro.Methods
Catheter constructionPolymeric 6.6 Fr segments were built in a catheter fabrication facility (Penumbra, Inc., Alameda, CA). Polymer filament was coiled atop a lubricious liner. A thermoplastic jacket was laminated onto the resulting subassembly (FIG. 1A). Segmented samples were used for marker optimization, while a full-length catheter was built as a representative device (FIG. 1B).
Passive marker optimization
Passive markers were made of an epoxy-based radiopaque ink (Creative Materials, Ayer, MA) doped with iron(III) oxide (Fe2O3) nanoparticles of 20-40 nm diameter (Alfa Aesar, Tewksbury, MA). Ink was comprised of tungsten or tantalum at 80% or higher (by weight)4. Markers containing 0.6, 9.1, and 27.3 wt% (w/w) nanoparticles were made. Additional control segments were left blank or had ink applied without nanoparticles. Four marker bands ~0.5 cm apart were painted in series starting ~2 cm from the distal tip and cured at 20ºC.
Passive marker visualization
Local areas around the passive marker bands appear as negative contrast under MRI, due to B0 field inhomogeneities resulting in dephasing of adjacent proton spins and a local signal void or susceptibility artifact5,6. Artifacts were measured per ASTM F2119-07. Segments were submerged in a rectangular phantom filled with an aqueous copper sulfate (Cu2SO4, 1.5 g/L) solution and oriented parallel to B0 (FIG. 2). Images were acquired in coronal and sagittal slice orientations on a 3T MRI scanner (MAGNETOM Skyra, Siemens Healthcare, Erlangen, Germany) using a spine array coil. A gradient echo (GRE) and T2-weighted turbo spin echo (TSE) were acquired (Table 1). For each image slice orientation, maximum artifact width was evaluated from all slices7.
Radiopacity
Radiographic analysis was performed using the A-plane of an Artis Q Biplane angiographic system (Siemens Healthineers, Forchheim, Germany). The 2D fluoroscopic imaging were acquired AP using a clinical neurovascular protocol with 81kV, small focal spot size of 0.3 mm, SID of 110 cm, and pixel resolution of 0.3mm2. The exposure parameters might be adjusted by the automatic exposure control of the system. Catheter segments were imaged beside a commercial guide catheter while submerged in the same rectangular phantom filled with water (FIG. 2). An ROI was drawn around each marker using ImageJ (NIH, Bethesda, Maryland) to obtain average pixel values for each marker.
Results
Passive marker visualizationNegative contrast signal induced by the IONP-doped ink was demonstrated by the passive markers (FIGS 3A and 3B). Artifact width increased with concentration of IONPs, showing a direct relationship between the two (FIG 3C). Individual markers became difficult to quantitate when IONP concentration exceeded 9.1 wt%. Some contrast signal was observed in the ink.
Radiopacity
Radiopaque markers were visualized under X-ray (FIG. 4). Pixel values of markers decrease as more IONPs were added, which can be attributed to the fact that the ink was not scaled up in the same fashion. 0.6 wt% IONPs markers were similar in pixel value to the commercial catheter, indicating comparable radiopacity characteristics.
Discussion and Conclusions
Imaging under MRI and X-ray demonstrated that the markers presented in this study possess tunable negative contrast at 3T and X-ray in vitro. Interestingly, the ink without any IONPs yielded some contrast under MRI, potentially due to presence of tungsten. To achieve sufficient MRI visibility and radiopacity under X-ray, markers of 0.6 wt% IONPs may be an option. More detailed data should be acquired in phantoms mimicking native tissue and additional IONP concentrations must be assessed between 0.6 and 9.1 wt%. While MR safety is not anticipated to be an issue, formal evaluation of RF-induced heating and magnetically induced torque in the MRI environment, per ASTM F2181 and F2213-17, respectively. It is possible to customize marker composition for different neurointerventional devices such as guide, intermediate, or microcatheters. These polymeric devices, in combination with their tunable multi-modality tracking characteristics, could find use in interventional MRI as they allow safe transfer between imaging modalities for intraprocedural MRI without the need to remove or re-navigate unsafe metallic devices and they permit navigation under real-time MRI.Acknowledgements
This project was supported by National Institute of Biomedical Imaging and Bioengineering (NIBIB), National Institutes of Health, through S. Hetts Grant Numbers R01 EB012031 and R21 EB020283. Its contents are solely the responsibility of the authors and do not necessarily represent the official policies of the NIH.References
- Wintermark, M. et al. Imaging recommendations for acute stroke and transient ischemic attack patients: A joint statement by the American Society of Neuroradiology, the American College of Radiology and the Society of NeuroInterventional Surgery. J. Am. Coll. Radiol. (2013). doi:10.1016/j.jacr.2013.06.0192.
- Kim, B. J. et al. Magnetic Resonance Imaging in Acute Ischemic Stroke Treatment. J. Stroke (2014). doi:10.5853/jos.2014.16.3.1313.
- Narsinh, K. H. et al. (in press). Combined use of x-ray angiography and intraprocedural MRI enables tissue-based decision-making regarding revascularization during acute ischemic stroke intervention. Radiology (2020). doi:https://doi.org/10.1148/radiol.20202027504.
- Kilbride, B. et al. E-103 Design and evaluation of an XMR-visible catheter for stroke applications. in (2020). doi:10.1136/neurintsurg-2020-snis.1365.
- Medical Coatings and Deposition Technologies. Medical Coatings and Deposition Technologies (2016). doi:10.1002/97811193087136.
- Glowinski, A. et al. Device visualization for interventional MRI using local magnetic fields: Basic theory and its application to catheter visualization. IEEE Trans. Med. Imaging (1998). doi:10.1109/42.7360377.
- Omary, R. A. et al. Real-time MR imaging-guided passive catheter tracking with use of gadolinium-filled catheters. J. Vasc. Interv. Radiol. (2000). doi:10.1016/S1051-0443(07)61343-88.
- Jiang, Y. Y. et al. In Vitro Quantification of the Radiopacity of Onyx during Embolization. Neurointervention (2017). doi:10.5469/neuroint.2017.12.1.3
Figures
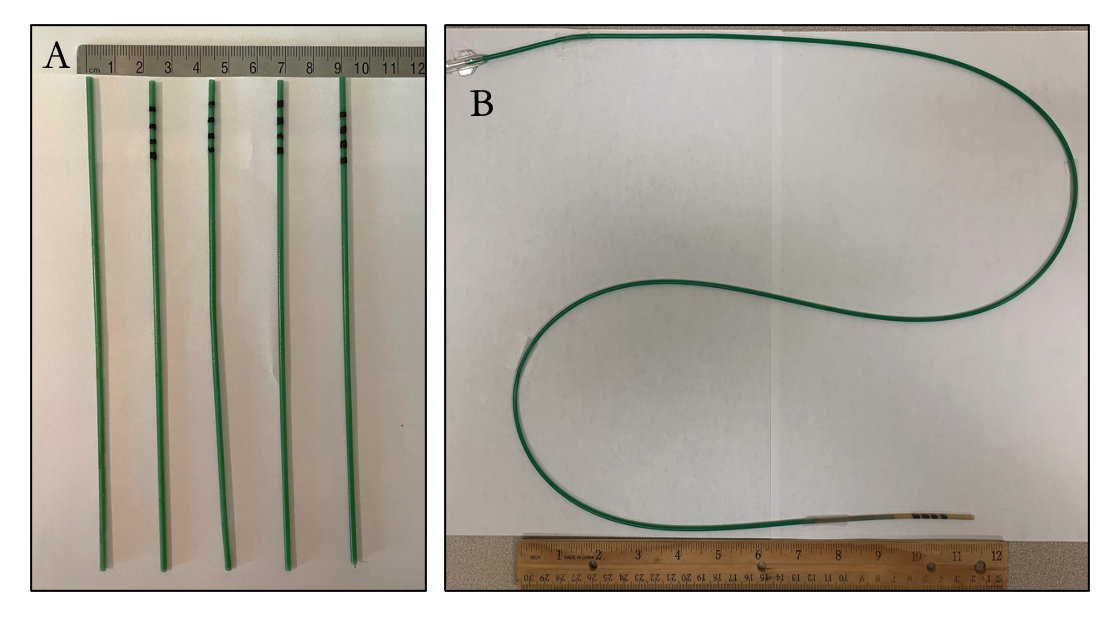
FIG. 1. Realization of catheter segment prototypes. A) Catheter segments in the following order from left to right: blank (no markers), radiopaque ink (without IONPs), ink with 0.6 wt% IONPs, ink with 9.1 wt% IONPs, and 27.3 wt% IONPs. B) Representative device in which these markers will be incorporated. In this case, the resultant device is approximately a 6.6 Fr guide catheter.
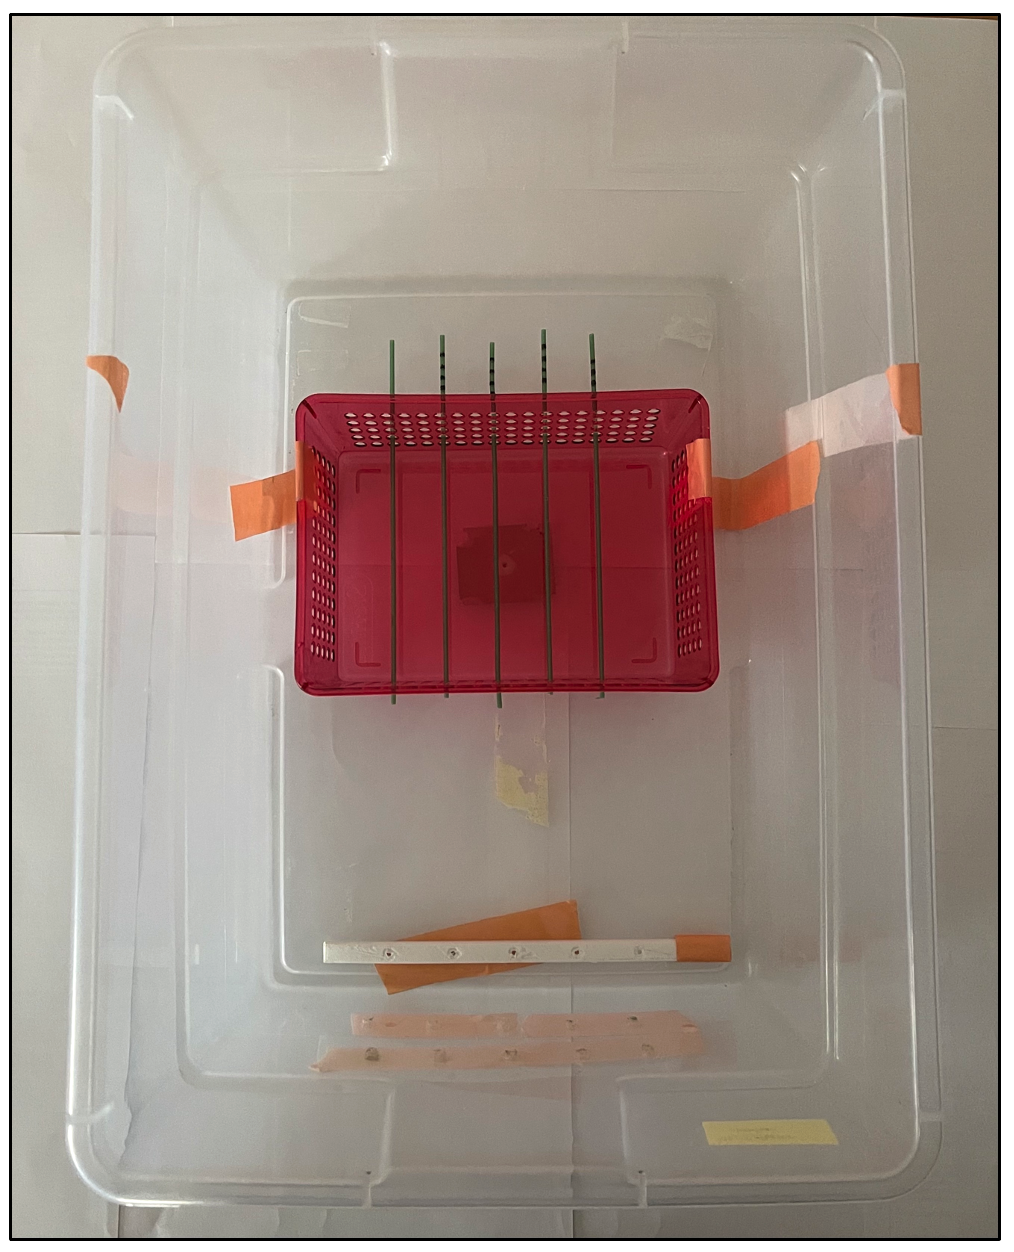
FIG 2. MRI visibility and radiopacity were evaluated in a copper sulfate and water phantom, respectively. MRI scanning and radiopacity tests were performed in the same rectangular phantom. Segmented catheters were flushed prior to imaging to eliminate air bubbles.
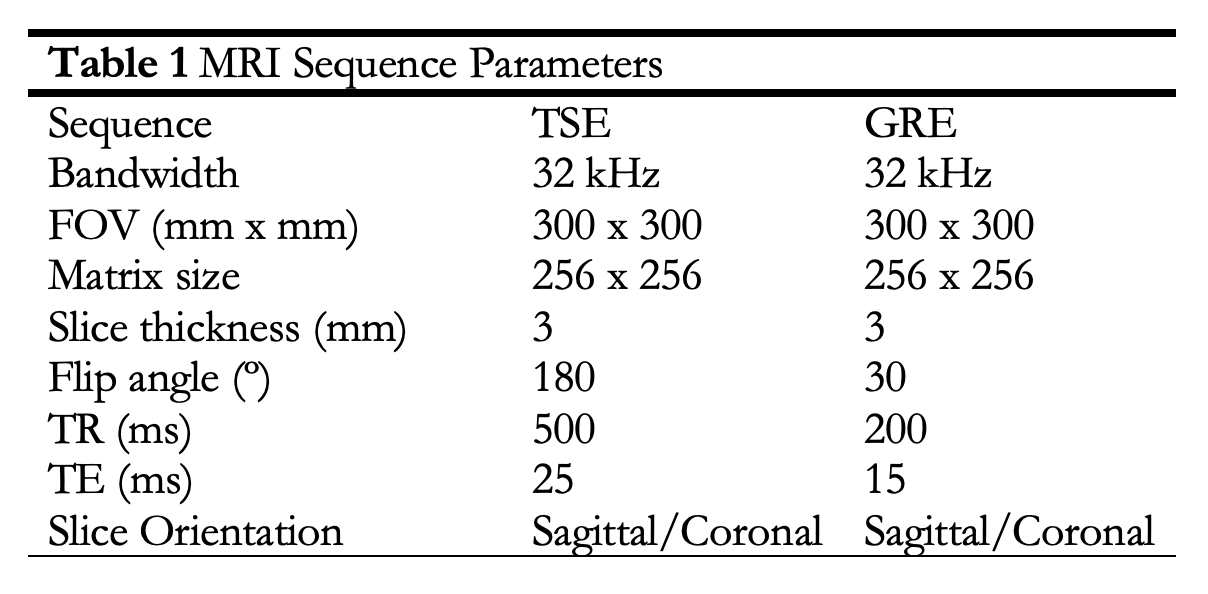
Table 1. MRI Sequence Parameters.
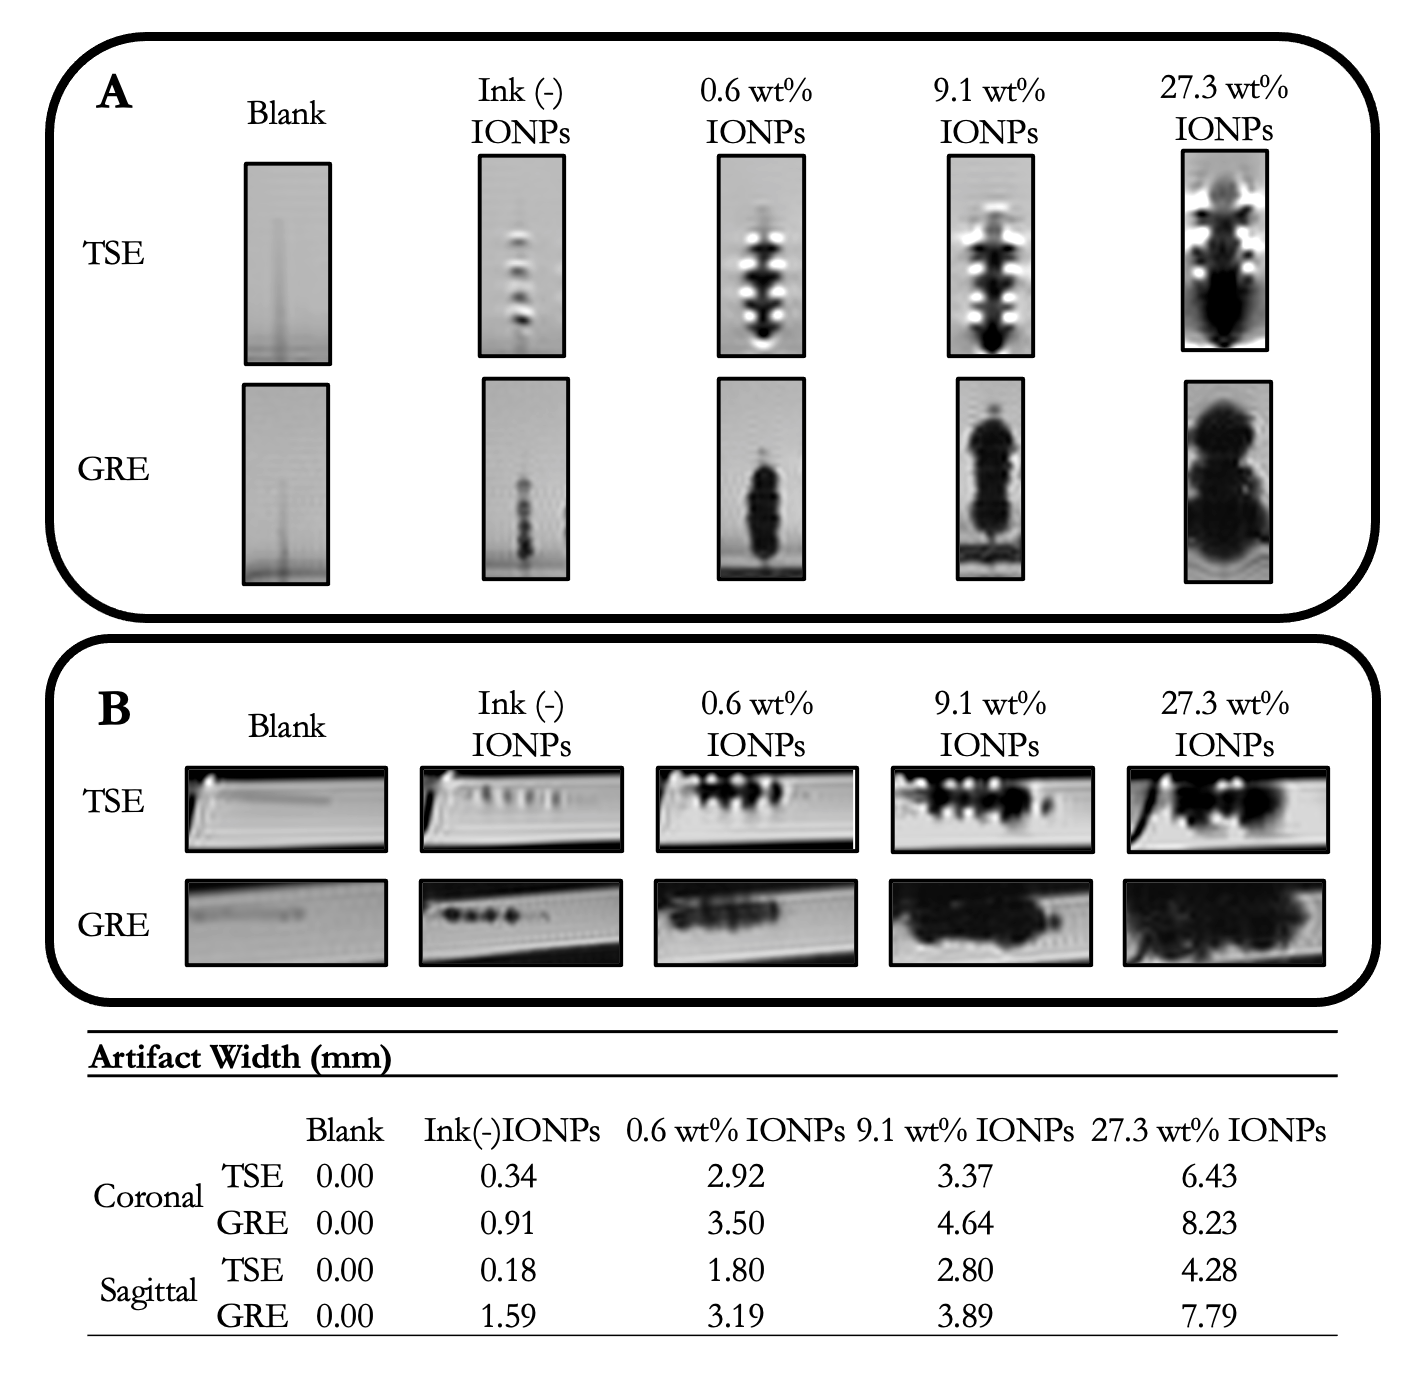
FIG. 3. Passive marker visualization under MRI. Passive artifacts were measured per ASTM F2119-07. TSE and GRE image pairs were acquired in both A) coronal and B) sagittal orientations. C) Maximal artifact width was measured from the edge of the catheter to the edge of the artifact in both orientations and sequences.
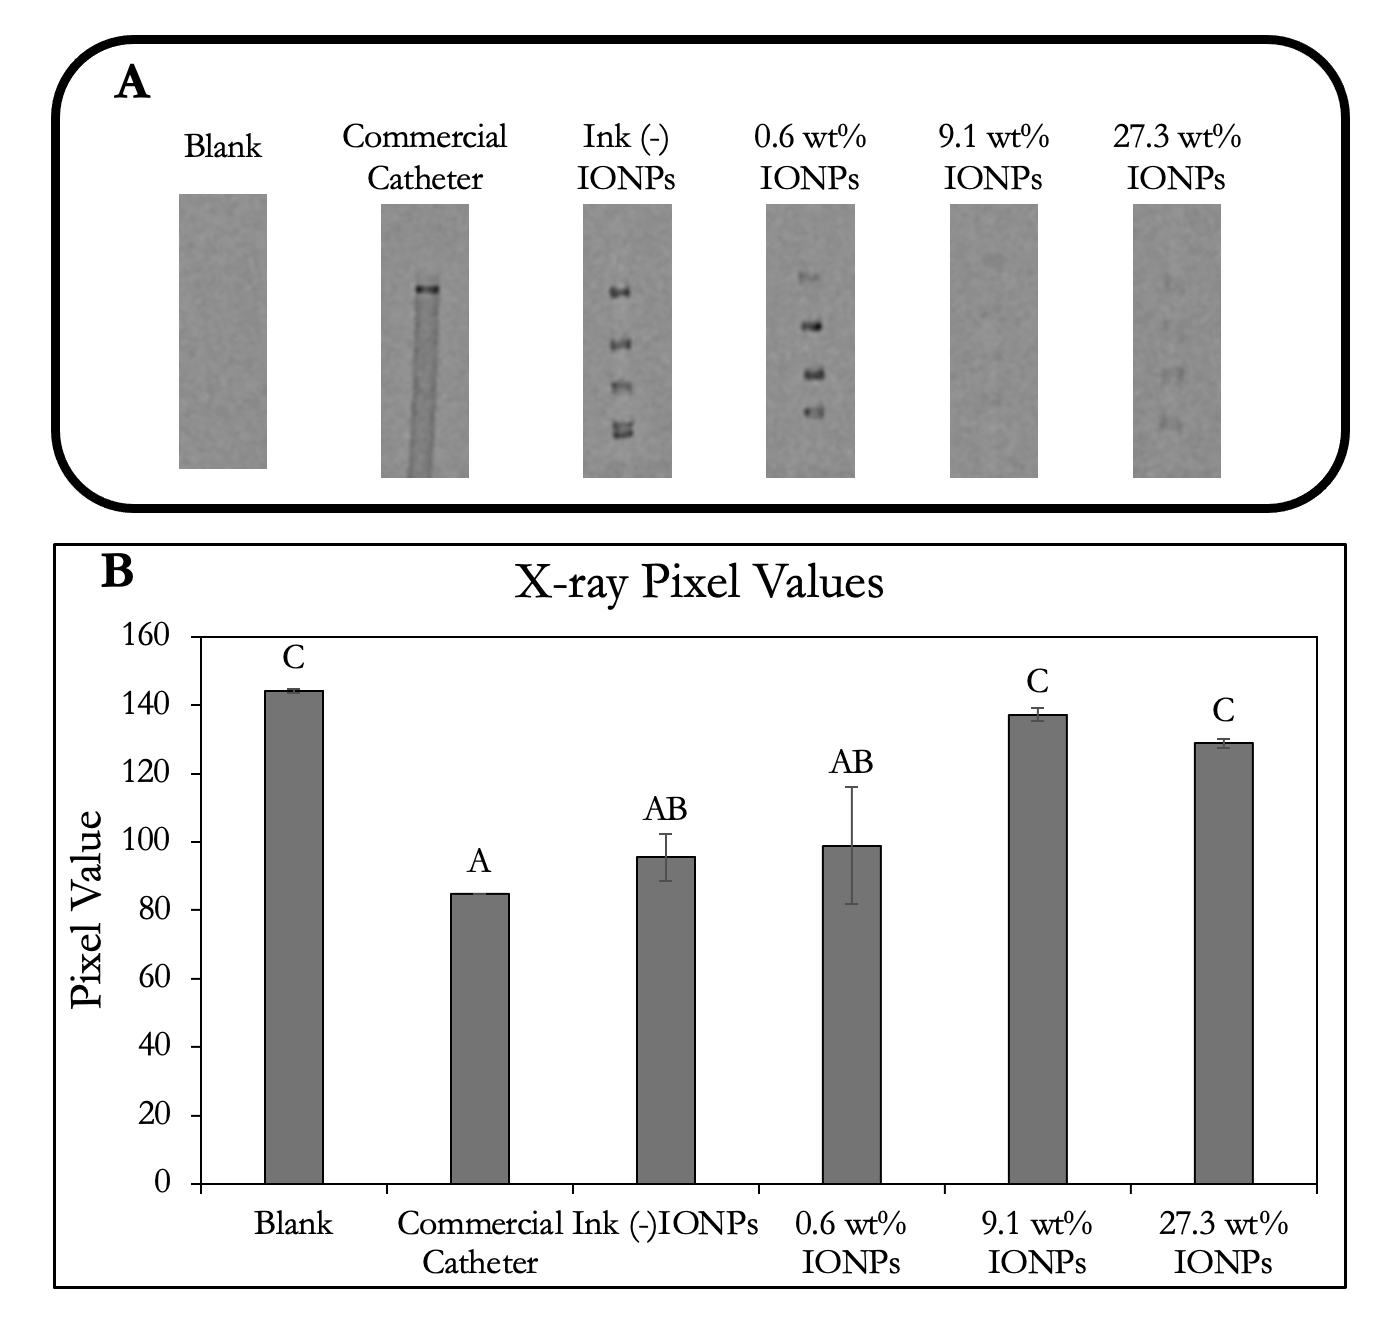
FIG. 4. Radiopaque marker visualization and comparison. A) X-ray images of all markers as well as a commercial catheter with a platinum-based distal marker band. ROIs were drawn around each marker and associated pixel values were tabulated. B) Average pixel values were compared using Tukey’s HSD mean comparison test.