4004
Quantitative Susceptibility Mapping in Preoperative Assessment of Microvascular Invasion of Hepatocellular Carcinoma: a Preliminary Study1Northern Jiangsu People’s Hospital, Yang zhou, China, 2GE Healthcare,MR Research China, Bei jing, China
Synopsis
In this study, we aimed to investigate susceptibility changes related to microvascular invasion (MVI) of hepatocellular carcinoma. We applied liver quantitative susceptibility mapping to measure lesions’ susceptibility. Significant differences in both tumorous and peritumoral susceptibility values were observed for MVI positive and negative lesions. With these findings, QSM imaging can be considered a potential technique for noninvasive preoperational assessment of MVI in hepatocellular carcinoma.
Introduction
Hepatocellular carcinoma (HCC) represents the most frequent primary liver tumor being about 90% of all cases of liver cancer. It is the fifth most common cancer and the second leading cause of cancer-related deaths worldwide. The most effective curative treatments for HCC patients are hepatectomy and liver transplantation, but with 5-year tumor recurrence rates of 70% and 35%, respectively. Microvascular invasion (MVI) is one of the most important prognostic factors with aggressive biological features but can be confirmed only in surgical specimen [1]. In the presence of MVI, tumor cells can spread and metastasize in the liver to form a portal vein tumor thrombus or multiple lesions or distant metastasis [2]. Thus, the accurate preoperative assessment of MVI is vital to predict the prognoses and improve therapeutic effects. Extensive studies have tried to identify clinical, imaging or serum parameters to predict MVI [3-4]. And recent studies have applied radiomics signatures and nomogram to evaluate the quantitative image features as surrogate biomarkers for MVI [5]. Quantitative susceptibility mapping (QSM) could quantify local tissue susceptibility by computing a dipole de-convolution [6]. Recently, QSM has been applied in brain to quantify cerebral microbleed burden, hematoma volume and to differentiate hemorrhages from calcifications, etc. Additionally, QSM value reflected heterogeneous of malignant tumor[7]. With these applications, here we hypothesized that MVI+ lesion’s susceptibility might show difference than MVI− lesions in HCC patients. The study thus aimed to measure the lesions’ susceptibility from HCC and assess the MVI using QSM.Materials and Methods
Subjects35 patients histologically confirmed HCC were enrolled in the study. Local ethical approval and consent forms are obtained from all patients. MVI was pathologically confirmed from tumor resection including 16 cases with MVI (MVI+) and 19 without MVI (MVI−). All patients underwent MRI scans before tumor resection.
MRI experiment
MR examinations were performed on a clinical 3T scanner (MR750W, GE Healthcare, USA) using a 32-channel phased array body coil. Up abdomen liver imaging include routine liver tumor sequences (pre-contrast T1 and T2 imaging, post-contrast three-phase dynamic imaging). Liver QSM measurement was performed before contrast injection. A 3D six-echo gradient-echo based sequence was used with the following parameters: TR=6.5ms, TE=0.8 ms-4.8ms, ΔTE=0.8, number of echoes = 6, FA=25°, bandwidth= 83.3 kHz, matrix size= 160×124, FOV= 39 × 39cm2. Each scan took 18 seconds during a single breath-hold.
Data analysis
QSM images were processed using an in-house software implemented in Matlab (Mathworks, Natick, MA, USA). Two radiologists specializing in liver imaging traced regions of interest (ROIs) using ITK-SNAP. ROIs were draw on the water map and copied to susceptibility map. Three ROIs were drawn slice-by-slice for each patient. In case of blurred edges occurred, the maximum range of the lesion was drawed. Meanwhile, ROIs at 5 mm distance away from the tumor surface were delineated, which is regarded as peritumoral zone. The susceptibilities were measured and expressed as mean and standard deviation.
Statistical analysis
Intraclass correlation coefficients (ICCs) were performed to test the inter-rater reliability for susceptibility measurement between two radiologists. If excellent agreement was obtained, the datasets were averaged for further analyses. Wilcoxon test or paired-sample t-test was used to compare the susceptibility values between MVI+ and MVI−. All statistical analyses were performed using SPSS software (SPSS version 19.0). P<0.05 was considered significant.
Results
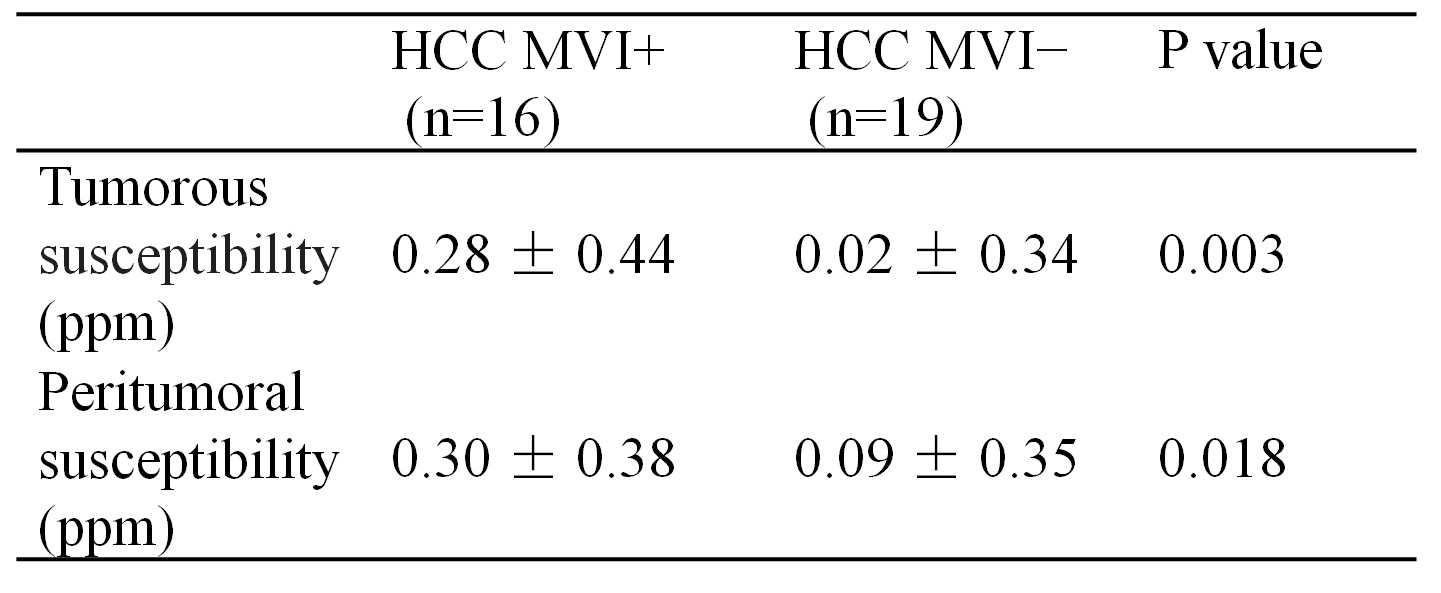
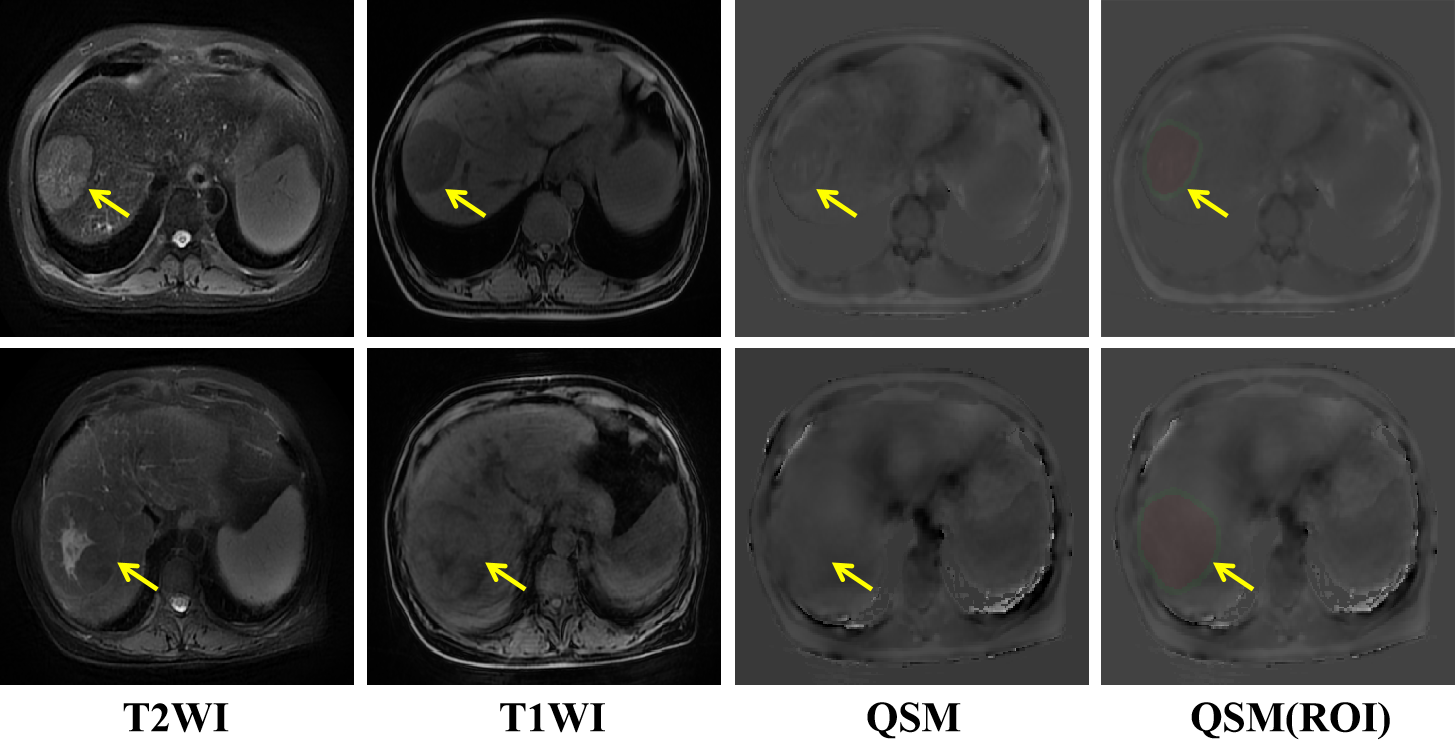
High ICCs of 0.976 and 0.972 were obtained for tumorous and peritumoral susceptibility measurement between two radiologists, respectively. Mean values for tumorous susceptibility of MVI− and MVI+ were 0.02 ± 0.34 ppm (range, -0.29–1.12 ppm) and 0.28 ± 0.44 ppm (range, -0.20–1.60 ppm), respectively. Peritumoral susceptibility of MVI− and MVI+ were 0.09 ± 0.35 ppm (range, -0.27–1.27 ppm) and 0.30 ± 0.38 ppm (range, -0.08–1.27 ppm), respectively. Two cases of HCC MVI- and MVI+ were showed in Figure 1. The Shapiro-Wilk test showed a nonnormal distribution for all datasets. The tumorous and peritumoral susceptibility values of MVI+ and MVI− were thus compared by the Wilcoxon test. Significant susceptibility differences were revealed between MVI+ and MVI− in the tumorous and peritumoral area (Table 1).Discussion and Conclusion
The study explored the feasibility of QSM in differentiating HCC MVI+ from MVI−. Significant differences in the tumorous and peritumoral susceptibility values were observed for MVI+ and MVI− . In the current results, the susceptibility of MVI+ lesions from tumor and peritumor were both higher than that of MVI- lesions. When HCC has microvascular invasion, there might be local micro hemorrhage and hemosiderin deposition. It has been reported that QSM can accurately find micro hemorrhage. Quantitative analysis of hemosiderin and micro hemorrhage can thus be conducted. Moreover, QSM might be sensitive to display small blood vessels, and could clearly show the angiogenesis within the tumor.In conclusion, this preliminary study found that quantitative susceptibility mapping (QSM) is helpful for distinguishing MVI+ and MVI− HCC. Follow-up studies with larger patient cohort are needed to further validate its diagnostic performance.
Acknowledgements
Funded by the Youth Project from Department of Science and Technology of Jiangsu (BKM20160450);Top Six Talent SummitProject of Jiangsu Province Human Resources and Social Security Department (2016-WSN-277).
References
1.Xu, X., Zhang, H.-L., Liu, Q.-P., et al. Journal of Hepatology 2019,70(6), 1133-1144.
2.Chang, S., Zhang, J., Liu, T., et al. Journal of Magnetic Resonance Imaging 2016, 44(2), 420-425.
3.Vincenza Granata, Roberta Fusco, Sergio Venanzio Setola, et al. Abdominal Radiology 2019,44(8), 2788-2800.
4.Sunyoung Lee, Seong Hyun Kim, Ji Eun Lee, et al. Journal of hepatology 2017, 67(3), 526-534.
5.Feng S.-T., Jia, Y., Liao, B., Huang, B., et al. European Radiology 2019, 29(9), 4648-4659.
6.Ramin J,Sujit,S.,Pascal,S.,et al. J Magn Reson Imaging 2019.50(3),725-732.
7.Zhang, S.,Chiang, GC., Knapp, JM., et al. J Neuroradiol. 2019, 272-277.
Figures