4002
Artifact Evaluation of Quantitative Susceptibility Mapping Reconstructions Using Mask Parameter Perturbation1Cornell University, New York City, NY, United States, 2Weill Cornell Medical College, New York City, NY, United States
Synopsis
QSM uses a mask to separate tissue of interest from background to avoid the strong susceptibility sources and poor signals that are known to cause artifacts in QSM. In brain QSM, the strongly paramagnetic superior sagittal sinus (SSS) lies at the border of brain mask. Perturbing the brain mask by reducing the SSS inclusion in QSM reconstruction also affects the convergence of strong susceptibility sources inside the brain. This mask perturbation propagates into QSM perturbation, which may be used as a measure of artifacts associated with strong susceptibility sources as validated in numerical phantom and COSMOS data.
Summary
A method of perturbing tissue mask is proposed to map artifacts associated with strong susceptibility sources recognized as a major cause of errors in QSM algorithms and is validated in ground truth models. Authors PSB and AGR are equal contributors to this study.Synopsis
QSM uses a mask to separate tissue of interest from background to avoid the strong susceptibility sources and poor signals that are known to cause artifacts in QSM. In brain QSM, the strongly paramagnetic superior sagittal sinus (SSS) lies at the border of brain mask. Perturbing the brain mask by reducing the SSS inclusion in QSM reconstruction also affects the convergence of strong susceptibility sources inside the brain. This mask perturbation propagates into QSM perturbation, which may be used as a measure of artifacts associated with strong susceptibility sources as validated in numerical phantom and COSMOS data.Introduction
The inverse problem from MRI data to susceptibility distribution in QSM is ill-posed and requires regularization or machine learning to obtain high quality and accurate reconstructions. A major error source is strong susceptibility sources, likely due to immature convergence in iterative reconstruction1. The strong sources from air-tissue interfaces, which also cause poor detection signal, are typically excluded in brain QSM as background using the brain mask2. Still, strong sources such as the highly paramagnetic superior sagittal sinus (SSS) near the brain boarder and intracerebral hemorrhages remain in the brain tissue of interest and may cause substantial error in QSM reconstruction. It would be desirable to estimate QSM errors caused by these strong magnetic sources. However, no ground truth is available in most situations, and thus evaluating the presence of artifacts remains challenging. QSM quality evaluation by a clinician is subjective. The variance of susceptibility across the brain has been used to quantify shadowing and streaking artifacts but is also affected by native tissue susceptibility contrasts such as hemorrhages3. In this abstract, we propose a method to measure the locality, extent, and severity of artifacts associated with strong susceptibility sources by perturbing the brain mask. This mask perturbation reduces inclusion of the strongly magnetic SSS and consequently the convergence of all strong sources in QSM. Therefore, QSM change by mask perturbation provides a measure of artifacts associated with strong magnetic sources. Here, we report on validation results of QSM mask perturbation error measure in numerical phantoms of known truth and in vivo imaging with COSMOS reference4.Methods
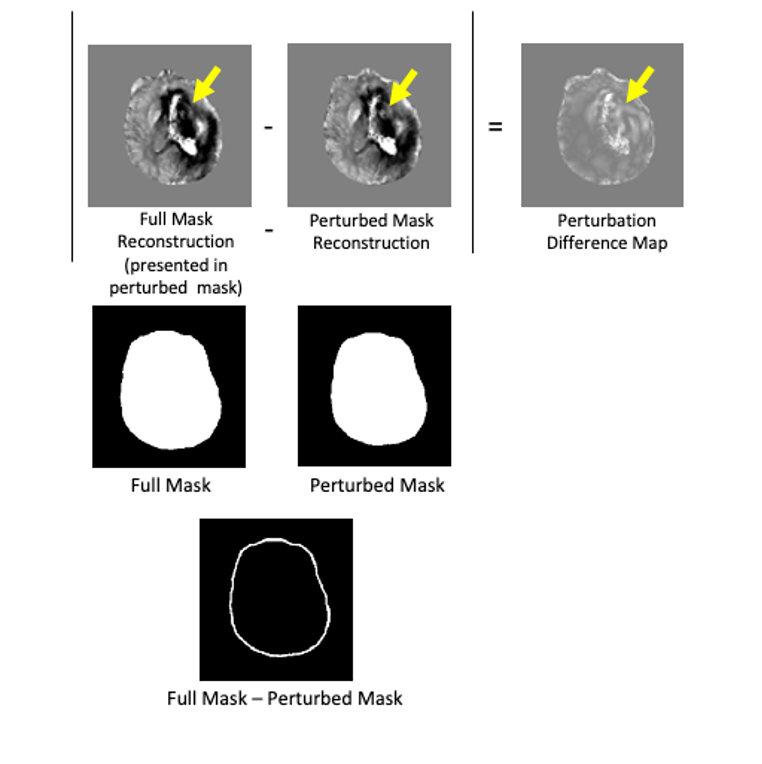
The parameter perturbed output will be compared to the original output by generating a Perturbation Difference Map (PDM) defined as:$$ PDM = |QSM_{Original} - QSM_{Perturbed}|$$
In this study, the chosen perturbation is the erosion of the brain mask by 5 mm. This perturbation is chosen as it leaves most the interior brain tissue in the perturbed reconstruction. An example is shown in Figure 1, for a cerebral hemorrhage dataset. First, the effectiveness of this method was evaluated by comparing PDM with the ground truth difference map for a numerical brain phantom and multiple orientation COSMOS dataset4. QSM was reconstructed using MEDI with λ= 0.01. The multiple orientation data QSM was reconstructed using MEDI2 ( λ= 0.001), pTFI1 (P = 30, λ= 0.001), MEDI-SMV (5mm SMV radius, λ = 0.001) and TFIR3 ( λ= 0.001, λ2= 0.1. τ = 0.05 s, and L radius 1 mm). For clinical evaluation, the PDM was computed for 8 patients without and 11 patients with cerebral hemorrhage datasets. The shadow score used previously was compared with the average of the PDM across the brain. QSM was reconstructed using MEDI ( λ= 0.001), pTFI (P = 30, λ= 0.001), MEDI-SMV (5 mm, λ= 0.001), and TFIR ( λ= 0.001, λ2= 0.1, τ = 0.05s, and L radius 1 mm).
Results
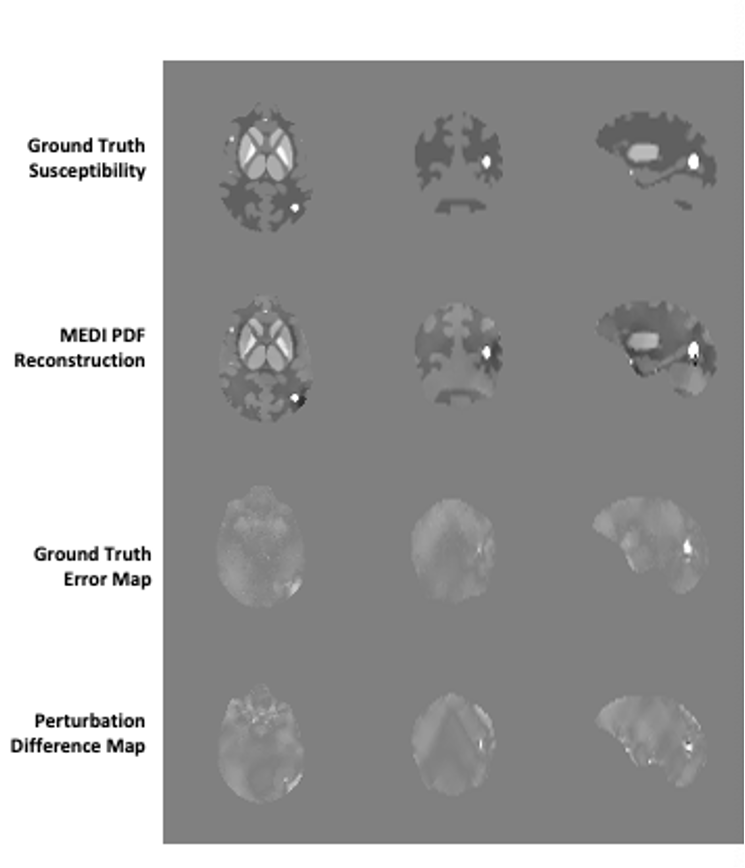
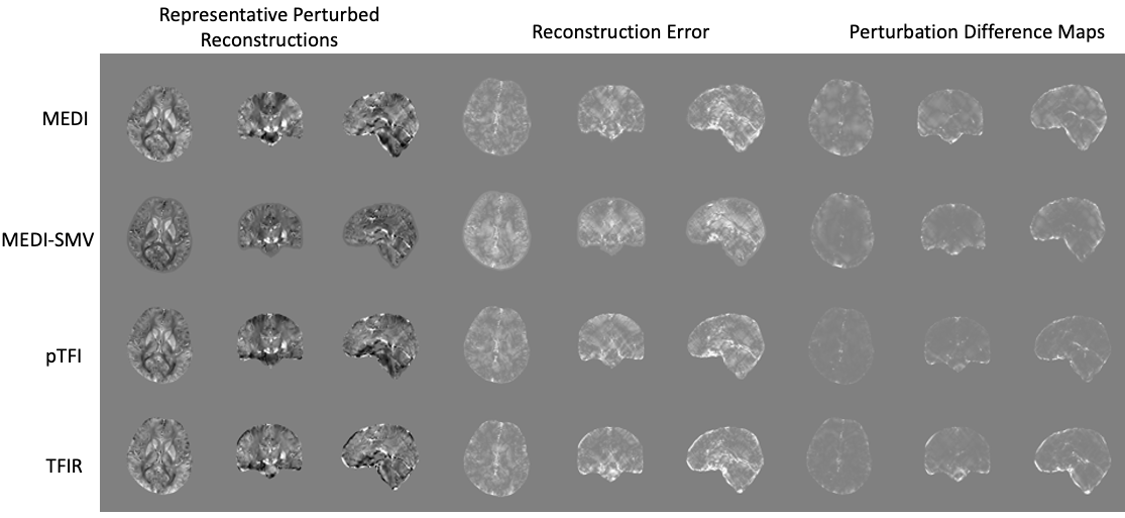
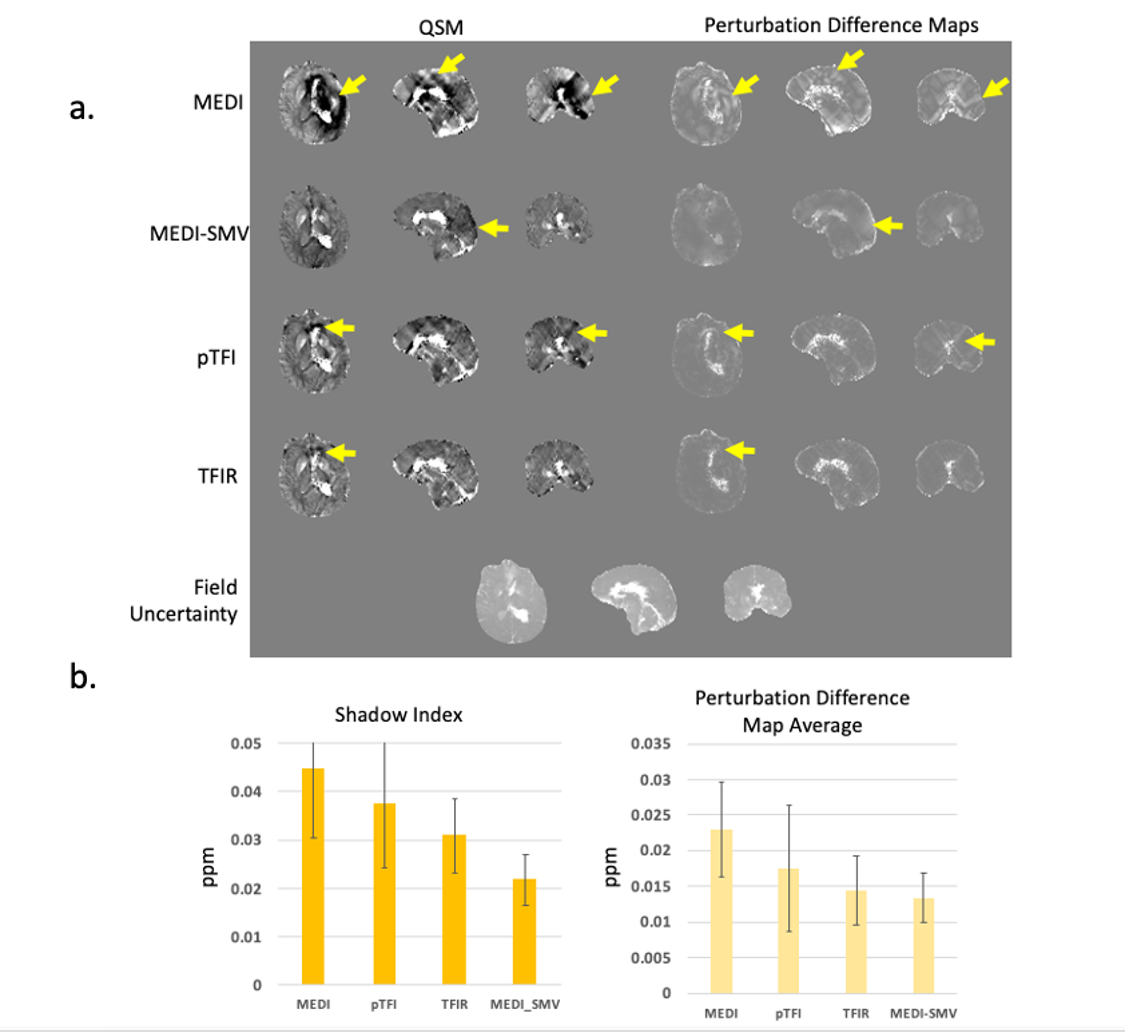
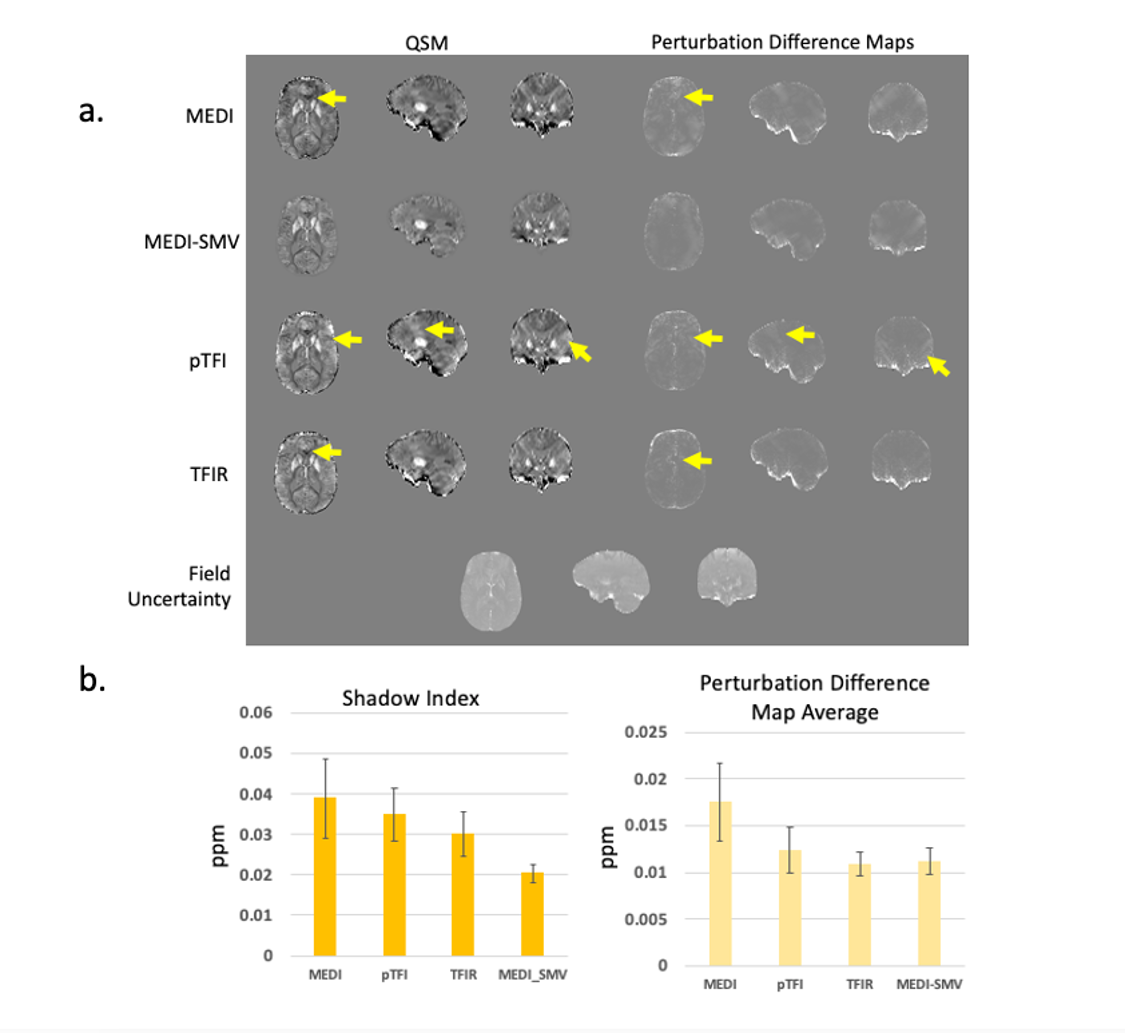
Figure 2 shows a comparison of the PDM and the ground truth error map in the numerical brain phantom. The voxel-wise correlation coefficient between PDM and the error map was 0.55 (p < 0.01), with 1.5% of outlier voxels filtered out, indicating that errors (inclusive of the streaking and shadowing artifacts) are detected by the PDM. Figure 3 illustrates that the COSMOS ground truth error map correlates with the PDM. Correlation coefficients are 0.64, 0.44, 0.81, 0.8 for MEDI, MEDI-SMV, pTFI, and TFIR, respectively, all with p < 0.01. Figure 4a shows a comparison for a cerebral hemorrhage obtained using various algorithms. Streaking and shadowing correlations between QSM and PDM can be observed. These artifacts are seen as originating from locations with high field uncertainty but extend spatially beyond it. Figure 4b shows the shadow scores and PDM averages for each method. Figure 5a shows a comparison for a non-hemorrhage case. Figure 5b shows the shadow index and PDM averages for each method.Shadow scores and PDM averages both decrease with increasing artifact incidence.Acknowledgements
No acknowledgement found.References
1. Liu Z, Kee Y, Zhou D, Wang Y, Spincemaille P. Preconditioned total field inversion (TFI) method for quantitative susceptibility mapping. Magn Reson Med. 2017;78(1):303-315.
2. de Rochefort L, Liu T, Kressler B, et al. Quantitative susceptibility map reconstruction from MR phase data using bayesian regularization: validation and application to brain imaging. Magn Reson Med. 2010;63(1):194-206.
3. Balasubramanian PS, Spincemaille P, Guo L, Huang W, Kovanlikaya I, Wang Y. Spatially Adaptive Regularization in Total Field Inversion for Quantitative Susceptibility Mapping. iScience. 2020;23(10):101553.
4. Liu T, Spincemaille P, de Rochefort L, Kressler B, Wang Y. Calculation of susceptibility through multiple orientation sampling (COSMOS): a method for conditioning the inverse problem from measured magnetic field map to susceptibility source image in MRI. Magn Reson Med. 2009;61(1):196-204.
Figures