3998
Radiomic Features on Quantitative Susceptibility Mapping Classify Amyotrophic Lateral Sclerosis Patients from Mimics1Electrical and Computer Engineering, Cornell University, Highlands, NJ, United States, 2Weill Cornell Medicine, New York City, NY, United States
Synopsis
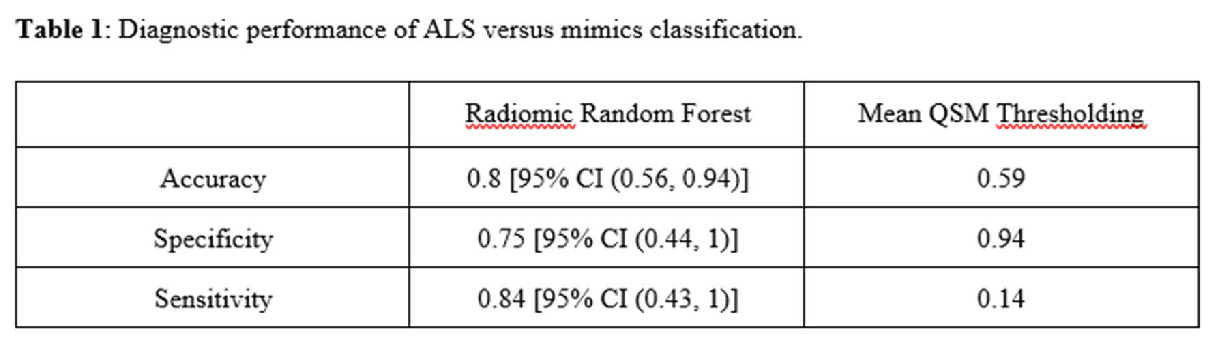
We trained a Random Forest classification model to classify amyotrophic lateral sclerosis (ALS) patients from those with mimicking clinical presentations based on QSM radiomic features extracted from the primary motor cortex. In a validation set, the model has 0.8 accuracy, 0.75 specificity of 0.75 and 0.84 sensitivity, which is superior to models using the mean QSM value as cutoff with 0.59 accuracy, 0.94 specificity and 0.14 sensitivity.
Introduction
Amyotrophic lateral sclerosis (ALS) is a progressive and often deadly neurodegenerative disease of the human motor system. The diagnosis of ALS remains challenging due to heterogeneous presentation patterns and clinical overlap with numerous other diseases including Parkinson’s disease and multiple sclerosis (1). Quantitative susceptibility mapping (QSM) provides in vivo quantification of susceptibility changes related to iron deposition in the motor cortex, a major pathological hallmark of ALS (2,3). The mean QSM value measured in the motor cortex has proved useful for differentiating ALS patients from healthy controls (4). The objective of this study was to develop a random forest classification algorithm to distinguish ALS patients from those with similar clinical presentations, referred to as ALS mimics, using the radiomic features within the motor cortex on QSM.Methods
For this analysis we have 25 ALS patients and 19 mimics patients. The 3T imaging protocol consisted of 1mm isotropic MPRAGE sequence for structural information and multi-echo GRE sequence (0.8x0.8x2 mm3 voxel, 10 echoes) for QSM. QSM maps were reconstructed from complex GRE data using the MEDI+0 algorithm with automatic CSF referencing. The primary motor cortex was automatically segmented using Freesurfer’s Brodmann area atlas and visually checked and edited if necessary to ensure proper alignment.Two-thirds of the patients from each group were randomized to a training set (16 ALS, 12 mimics) and the remaining one third to a validation set (9 ALS, 7 mimics). First-order radiomic features of QSM with a p-value of higher than 0.20 from a t-test were excluded to reduce the dimensionality of the data. A random forest classification model was fit in the training set and predictions were made in the validation set. Accuracy, specificity and sensitivity were calculated for the model’s performance on the validation set. Subjects were permuted in the training and validation set to calculate 95% confidence intervals on these measures. We compared this to an analysis that just used the mean QSM value over the motor cortex for classification. We thresholded the QSM mean values using Youden’s J index and reported the accuracy, specificity and sensitivity resulting from this optimal threshold.
Results
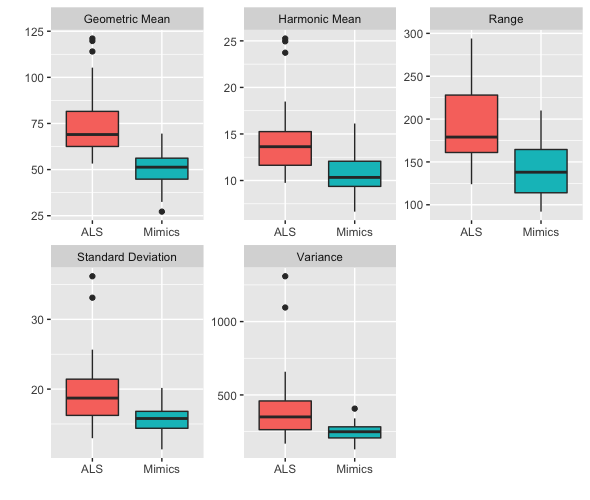
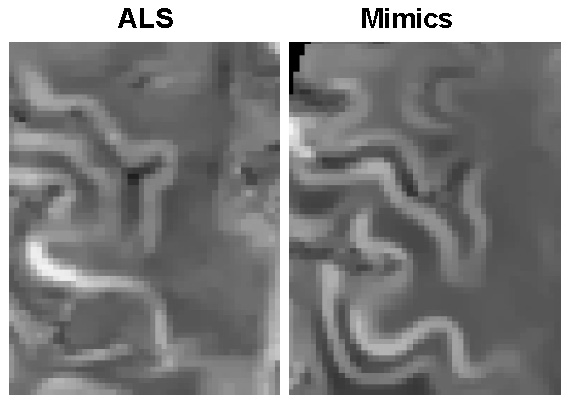
Table 1 summarizes the average accuracy, specificity, and sensitivity results across 1000 permutations with 95% confidence intervals obtained by the random forest model predictions in the validation set. In addition, we examined the most important features from the random forest model using the gini index. For each of the 1000 permutations, we selected the top 5 most important variables. The top occurring variables were the geometric mean over the region (top 5 for 1000 out of 1000 permutations), the harmonic mean (932 out of 1000), the range (781 out of 1000), the variance (514 out of 1000) and the standard deviation (493 out of 1000). The mean of all of the top radiomic features were larger in the ALS group than the mimics group, as seen in Figure 1. We compared the results from our model to an analysis that just used the mean over the region over the entire dataset. The sensitivity, specificity, and accuracy from these models can also be seen in Table 1. Figure 2 shows an example of QSM obtained from ALS and mimics patients.Discussion
We found that for classifying ALS versus mimic conditions, a random forest model utilizing first-order radiomic QSM features over the motor cortex outperforms classification methods using just the mean QSM over the region. This suggests that the radiomic features add additional information beyond that just captured by the mean. The most important radiomic features in the model over the permutations were found to be the geometric mean, harmonic mean, range, standard deviation and variance.Acknowledgements
No acknowledgement found.References
1. Zarei, Sara, et al. "A comprehensive review of amyotrophic lateral sclerosis." Surgical neurology international 6 (2015).
2. Wang, Yi, et al. "Clinical quantitative susceptibility mapping (QSM): Biometal imaging and its emerging roles in patient care." Journal of magnetic resonance imaging 46.4 (2017): 951-971.
3. Schweser, Ferdinand, et al. "Quantitative imaging of intrinsic magnetic tissue properties using MRI signal phase: an approach to in vivo brain iron metabolism?." Neuroimage 54.4 (2011): 2789-2807
4. Schweitzer, Andrew D., et al. "Quantitative susceptibility mapping of the motor cortex in amyotrophic lateral sclerosis and primary lateral sclerosis." American journal of roentgenology 204.5 (2015): 1086-1092.
Figures