3997
Comparison of True Susceptibility Weighted Imaging (tSWI) with SWI and QSM for Intracranial Hemorrhage1Department of Biomedical Engineering, University of Alberta, Edmonton, AB, Canada, 2Department of Radiology and Diagnostic Imaging, University of Alberta, Edmonton, AB, Canada, 3Division of Neurology, Department of Medicine, University of Alberta, Edmonton, AB, Canada
Synopsis
Quantitative Susceptibility Weighted Imaging or True SWI(tSWI) has been recently developed to overcome the shortcomings of SWI. SWI images are computed from filtered phase images, however, tSWI utilizes the susceptibility maps for its computation. Eight intracranial hemorrhage patients were scanned at 3T with 3D SWI sequence. Blooming effect and phase wrap artifacts that remain on SWI images of hemorrhage are removed in tSWI. tSWI provides better susceptibility weighting than magnitude within the hemorrhage and improved the texture visualization as compared Quantitative Susceptibility Mapping(QSM). Thus, tSWI can be a useful addition for hemorrhage visualization when SWI cannot provide a clear depiction.
Introduction
Intracranial hemorrhage is a type of stroke where blood vessels rupture and lead to blood leakage in the brain. The leaked hemoglobin is toxic to the tissue and can lead to further inflammation and increased injury1. Susceptibility Weighted Imaging (SWI) is used as a clinical sequence for stroke and hemorrhage2. Quantitative Susceptibility Mapping (QSM) also offers a means to study iron changes in hematoma quantitatively3,4. Quantitative Susceptibility Weighted Imaging or True SWI (tSWI) is a relatively recent method introduced to overcome the shortcomings of SWI images which incorporate filtered phase images5. Previous papers have looked at tSWI to compare veins, microbleeds5 and certain brain structures6.However, in the case of many hemorrhages, there is extremely rapid phase evolution causing wraps that cannot be easily removed in SWI images.Aim
The objective is to optimize parameters for tSWI for hemorrhage patients and compare tSWI to SWI and QSM in patients with intracranial hemorrhage.Methods
Data collection: 12 hemorrhages from 8 patients, diagnosed with hemorrhage by CT received a follow-up MRI scan from day 3 to day 39 after symptom onset. Patients were scanned at 3T with 3D SWI sequence with parameters TE/TR=20ms/27ms, flip angle=150, resolution= 0.85X0.85X1.5mm3. Two patients were scanned longitudinally at day 2, 7 and 30.Image Reconstruction: The QSM images were reconstructed using the superposed dipole inversion method7. The best path unwrapping technique was used to unwrap the phase and background removal was done with LBV (Laplacian Boundary Value), followed by total variation dipole inversion8. SWI images were generated by standard method9,10.
The tSWI images were reconstructed by multiplying the magnitude by n times of a thresholded susceptibility map obtained from the QSM5. tSWI was computed with upper susceptibility threshold(χ2)=0.45pmm,1ppm, 2ppm and 3 ppm and multiplication factor n=1,2 and 4. For hemorrhage, n=2 and χ2=3ppm provided optimum contrast. The upper threshold was chosen to be slightly higher than the maximum susceptibility value of hemorrhage which can be above 2ppm in certain regions of the hemorrhage. This choice was made to avoid losing any information, and in turn texture, from the hemorrhage with high susceptibility values. The lower susceptibility threshold was chosen as three times of standard deviation (3σ) above the white matter tissue region (splenium of corpus callosum) in the susceptibility map as in previous work5.
Results
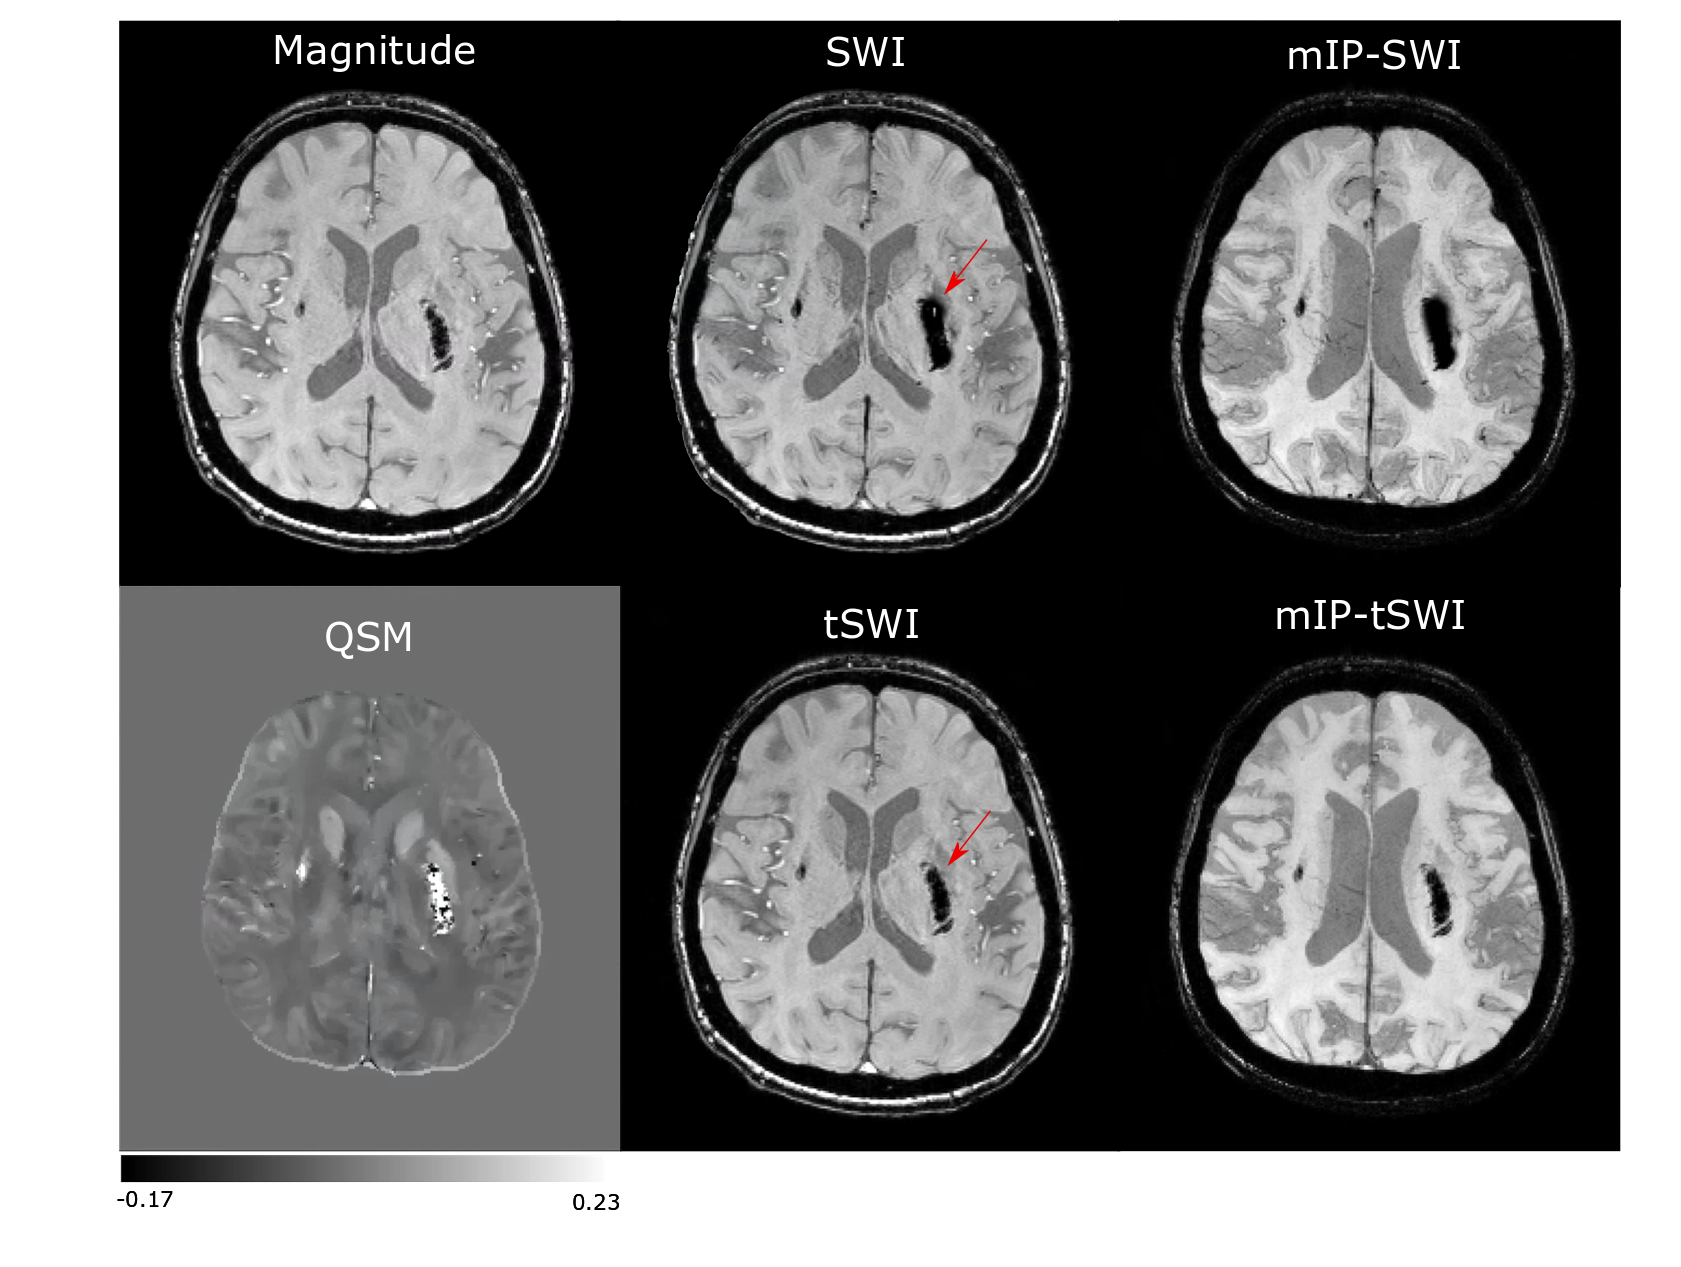
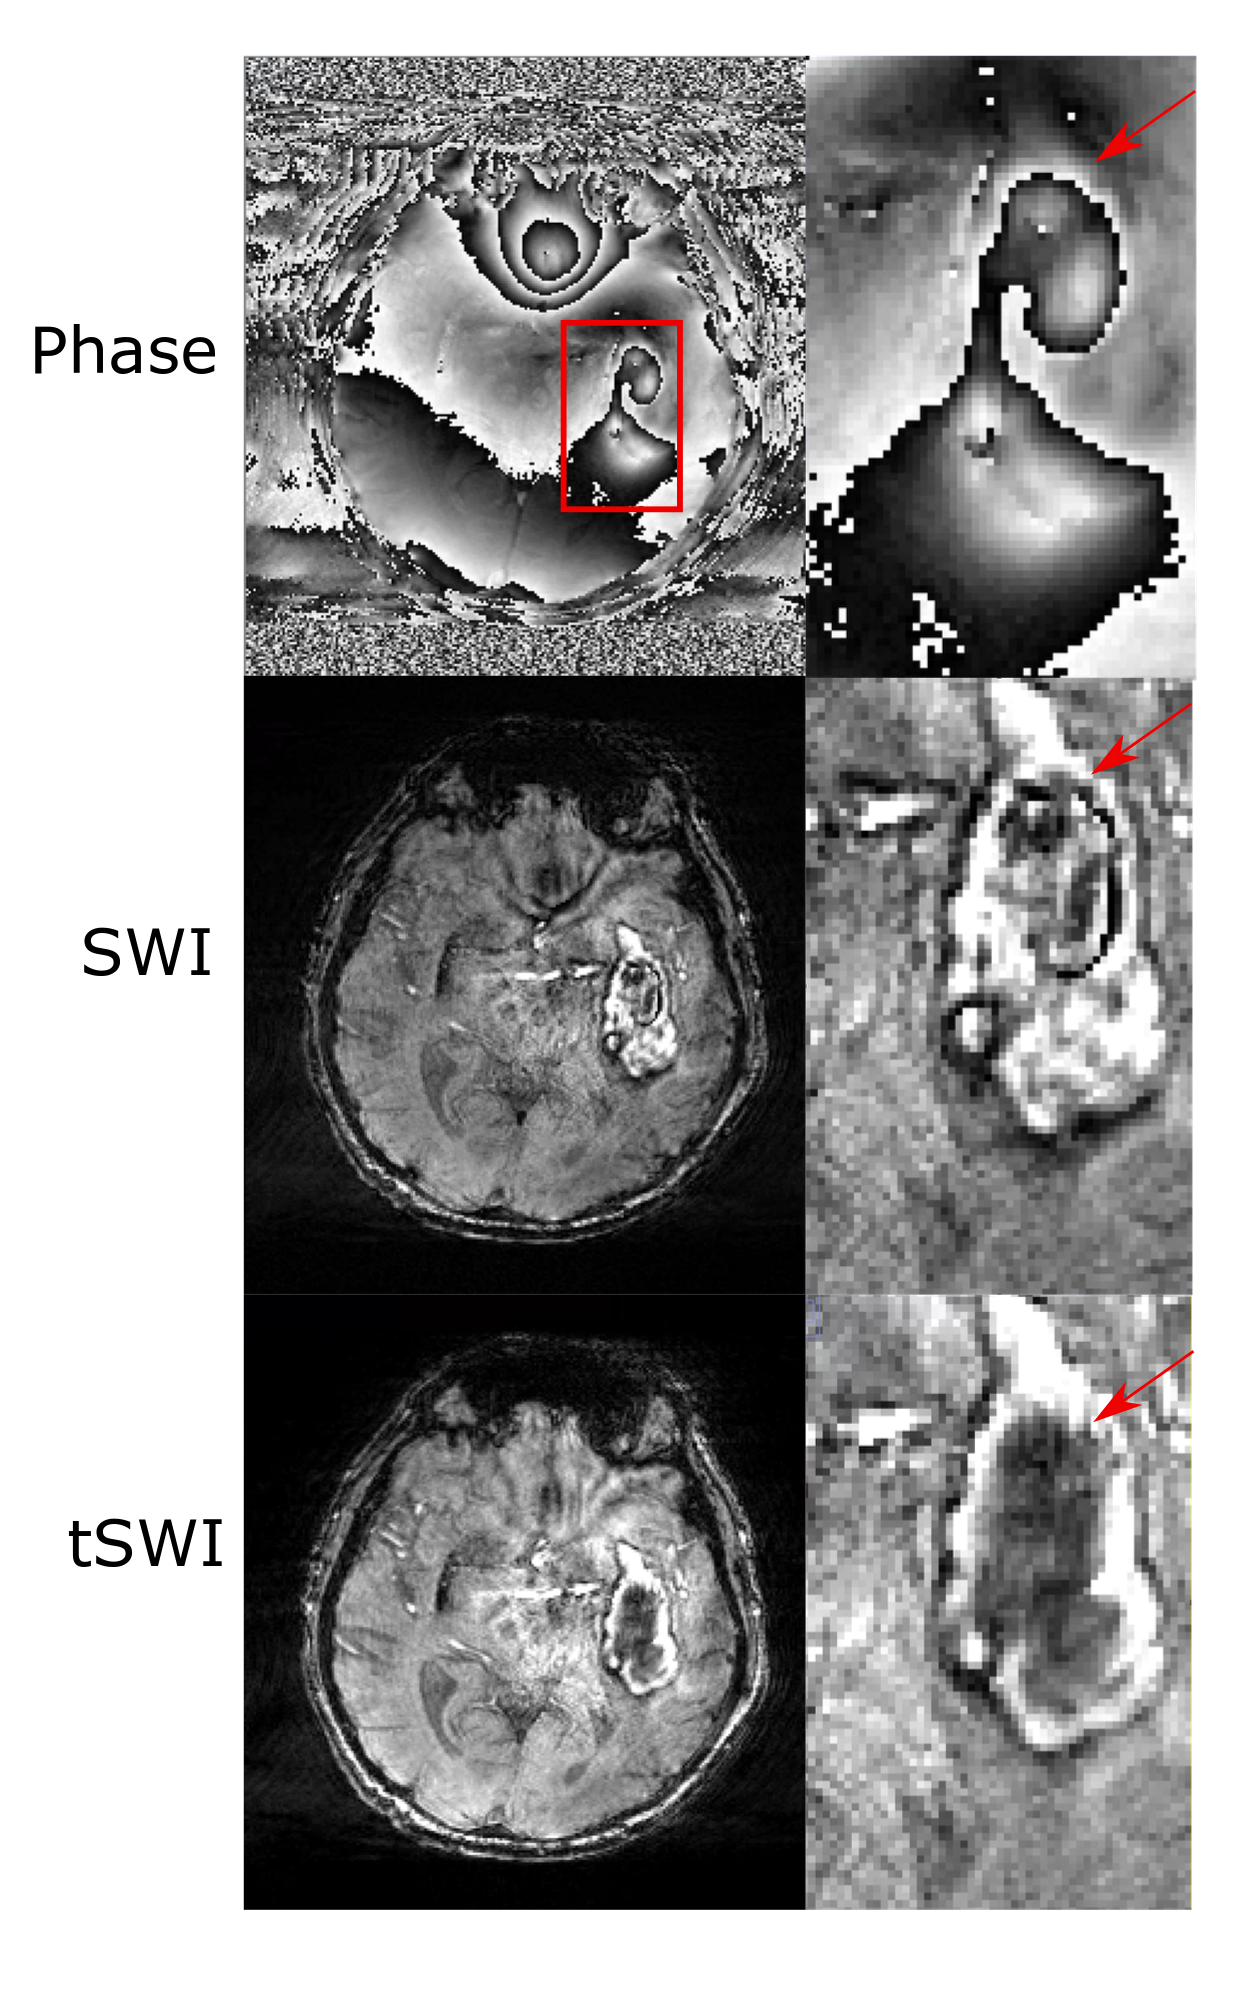
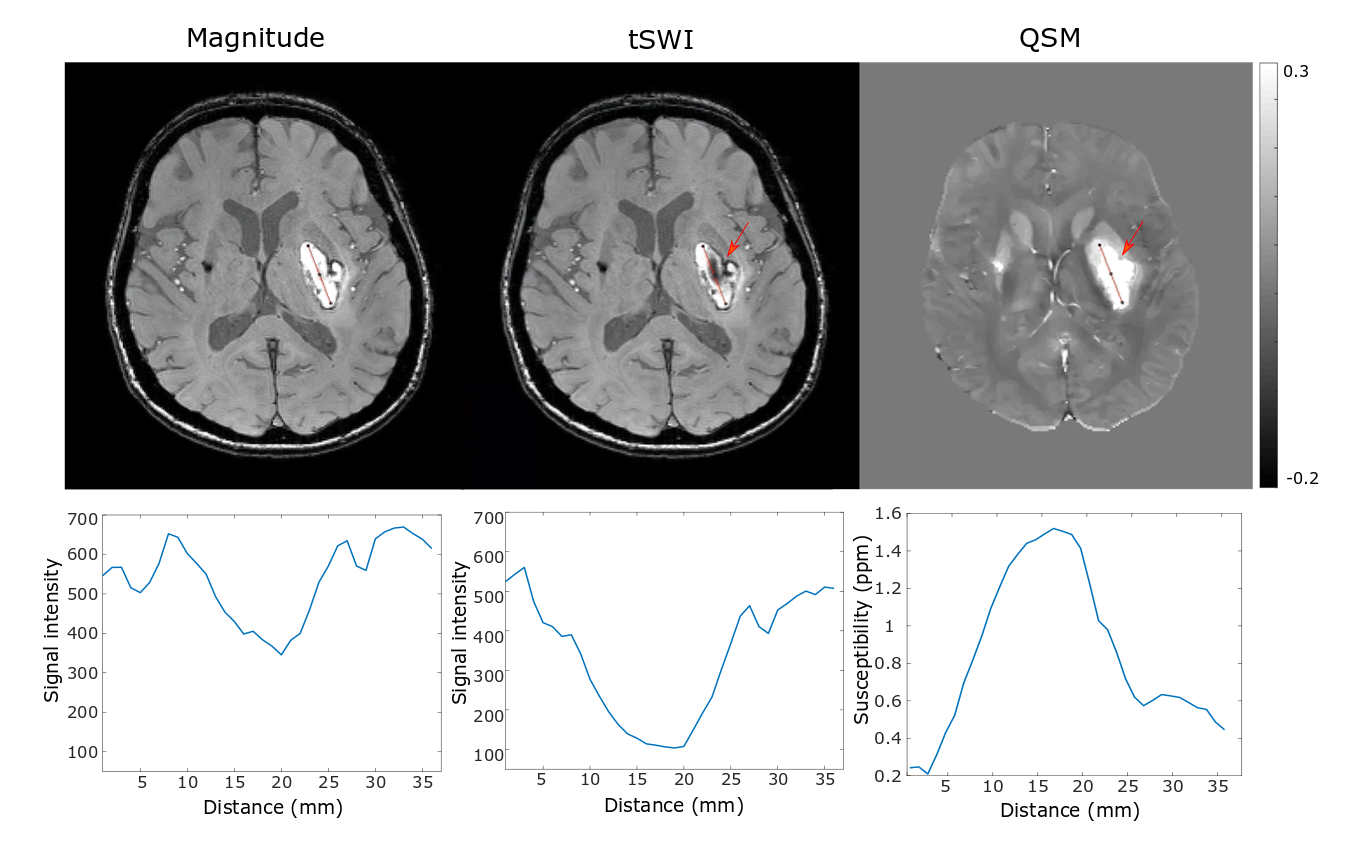
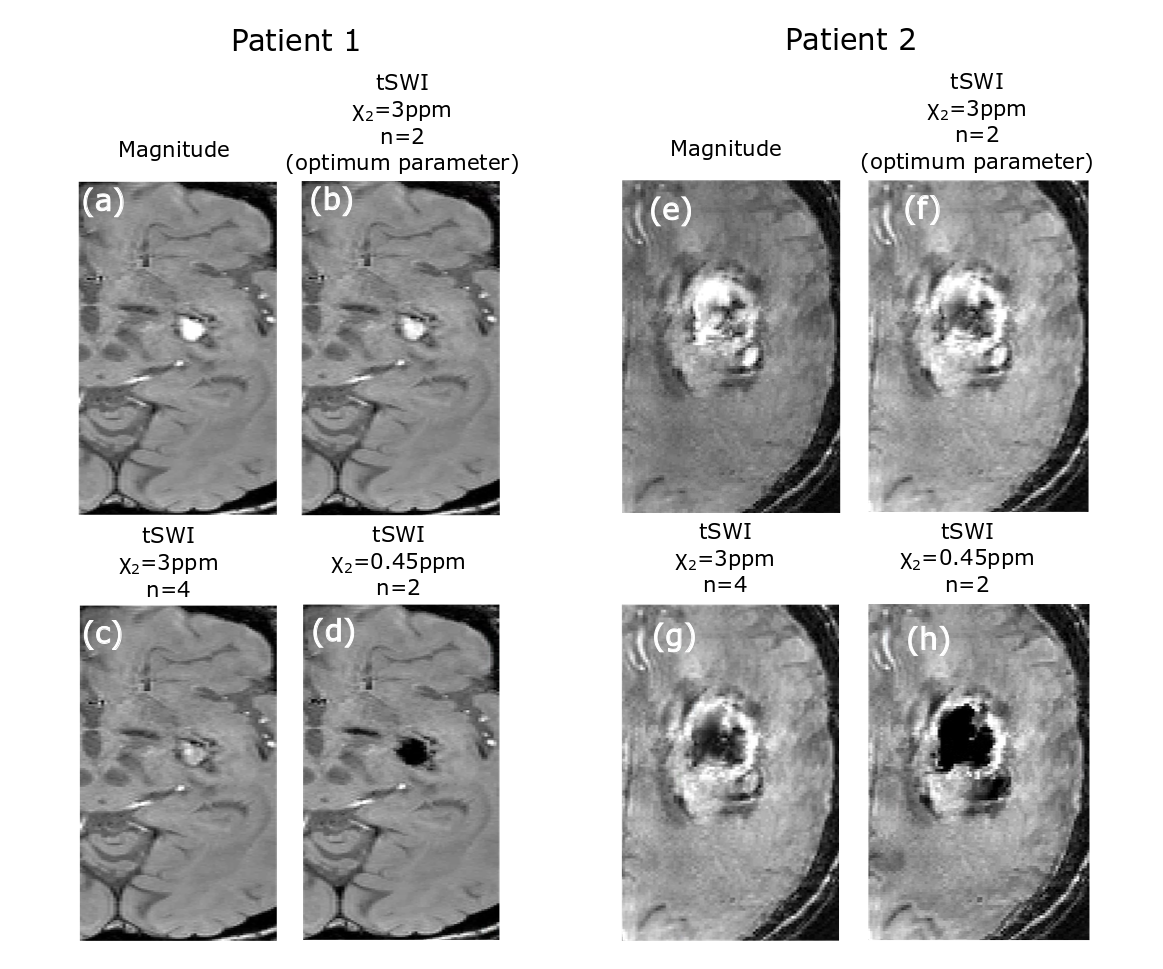
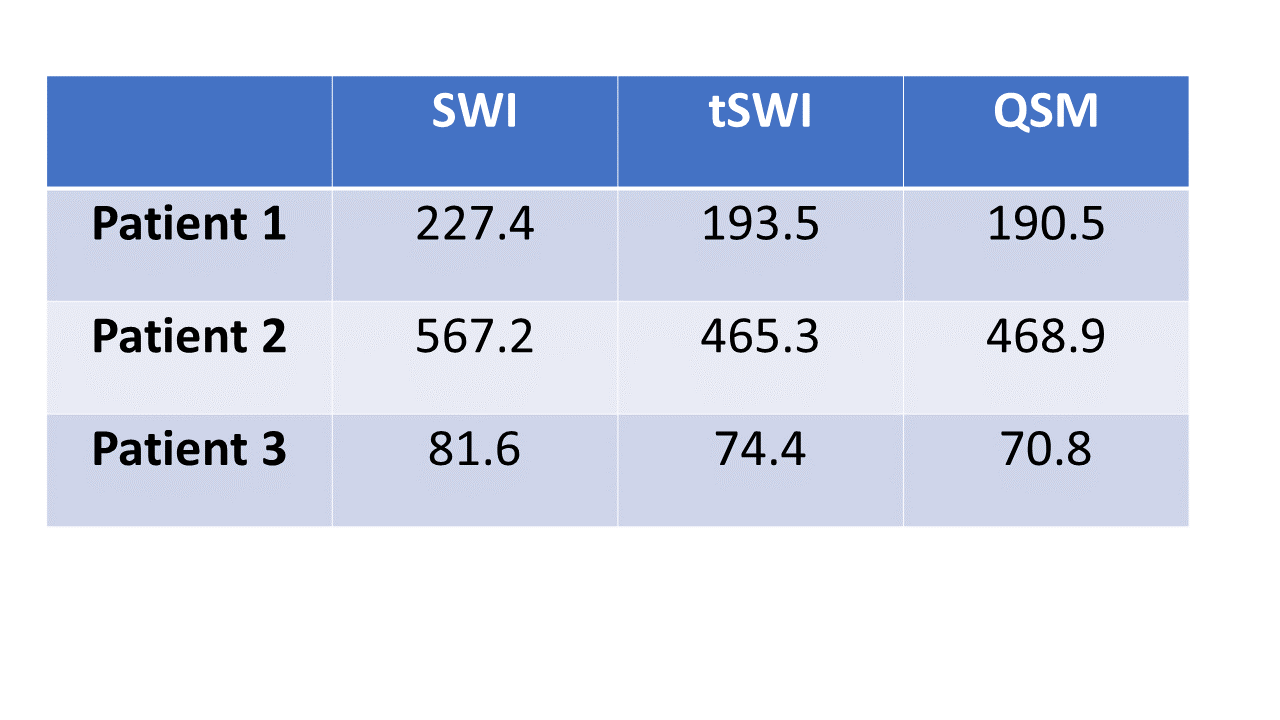
Fig 1 demonstrates the blooming effect observed in SWI images of hemorrhage (red arrow). Table 1 shows area comparison between SWI, tSWI and QSM to demonstrate this effect on the hemorrhage areas by tabulating cases where blooming effect was observed. Otherwise, tSWI and SWI have identical areas. The phase, SWI and tSWI of a hemorrhage patient in Fig 2 demonstrate the artifacts from phase wrap that are observed inside the hemorrhage in the SWI image. Fig 3 shows a comparison in the contrast and texture among magnitude, tSWI and QSM of a hemorrhage patient. Fig 4 compares the different tSWI parameters.Discussion
tSWI, which utilizes the susceptibility maps in its computation, has the potential to overcome some of the limitations faced in SWI, which is computed using filtered phase images. Since tSWI utilizes the susceptibility information from QSM, it does not have the excess blooming effect that is seen in SWI, thus enabling accurate shape assessment and area measurements of hemorrhages (Fig 1 and Table 1).While computing QSM, the phase images are first unwrapped. However, SWI filters the wrapped phase, which results in some wraps remaining within strong susceptibility sources like hemorrhages, as seen in the SWI result (Fig 2). Thus, these phase wrap artifacts can be reduced in tSWI.
tSWI provides better susceptibility weighting than magnitude and hence susceptibility variation within the hemorrhage is clearly depicted in tSWI as shown in Fig 3. QSM can also overcome the limitations of SWI and hence can be used to measure accurate area and to classify the age of hemorrhage depending on susceptibility values11. However, the contrast in QSM is not always favorable for visualization purposes. In Fig 3, the dark rim (red arrows) and the structural variations inside the hemorrhage are better depicted in tSWI than QSM.
The parameters for tSWI were chosen to obtain the optimum texture visualization for the hemorrhages which have higher mean susceptibility as compared to veins. If the upper threshold (χ2) is selected to be 0.45ppm, optimum χ2 for veins, anything above that value will have a weighting of zero and observing any texture in the hemorrhage will not be possible (Fig 4d, 4h). A larger n is optimal for veins when a higher χ2 is chosen5 but that would change the hemorrhage contrast (Fig 4c, 4g). χ2=3 and n=2 was chosen for optimum hemorrhage visualization (Fig 4b, 4f). As a result, some of the small veins with much lower susceptibility value may not receive optimum enhancement.
Conclusion
tSWI overcomes the limitations of blooming and phase wrap artifact as observed in SWI of hemorrhages. Good contrast and texture within the hemorrhage can be seen in tSWI images and hence it can be used for visualizing hemorrhages along with SWI when SWI fails to provide clear depiction of the hemorrhage.Acknowledgements
Contract grant sponsor: Canadian Institutes of Health Research (CIHR)References
1. Bradley WG Jr. MR appearance of hemorrhage in the brain. Radiology. 1993; 189(1):15-26.
2. Liu S, Buch S, Chen Y, Choi HS, Dai Y, Habib C, Hu J, Jung JY, Luo Y, Utriainen D, Wang M, Wu D, Xia S, Haacke EM. Susceptibility-weighted imaging: current status and future directions. NMR Biomed. 2017;30(4):10.
3. Wang S, Lou M, Liu T, Cui D, Chen X, Wang Y. Hematoma volume measurement in gradient echo MRI using quantitative susceptibility mapping. Stroke. 2013;44(8):2315-7
4. Chang S, Zhang J, Liu T, Tsiouris AJ, Shou J, Nguyen T, Leifer D, Wang Y, Kovanlikaya I. Quantitative Susceptibility Mapping of Intracerebral Hemorrhages at Various Stages. J Magn Reson Imaging. 2016;44(2):420-5.
5. Liu S, Mok K, Neelavalli J, Cheng YC, Tang J, Ye Y, Haacke EM. Improved MR venography using quantitative susceptibility-weighted imaging. J Magn Reson Imaging. 2014;40(3):698-708.
6. Cheng Z, He N, Huang P, Li Y, Tang R, Sethi SK, Ghassaban K, Yerramsetty KK, Palutla VK, Chen S, Yan F, Haacke EM. Imaging the Nigrosome 1 in the substantia nigra using susceptibility weighted imaging and quantitative susceptibility mapping: An application to Parkinson's disease. Neuroimage Clin. 2020; 25:102-103.
7. Sun H, Kate M, Gioia LC, Emery DJ, Butcher K, Wilman AH. Quantitative susceptibility mapping using a superposed dipole inversion method: Application to intracranial hemorrhage. Magn Reson Med. 2016; 76(3): 781-91.
8. De A, Sun H, Emery DJ, Butcher KS, Wilman AH. Rapid quantitative susceptibility mapping of intracerebral hemorrhage. J Magn Reson Imaging. 2020 Mar;51(3):712-718.
9. Haacke EM, Xu Y, Cheng YC, Reichenbach JR. Susceptibility weighted imaging (SWI). Magn Reson Med. 2004;52(3):612-8.
10. Rauscher A, Barth M, Herrmann KH, Witoszynskyj S, Deistung A, Reichenbach JR. Improved elimination of phase effects from background field inhomogeneities for susceptibility weighted imaging at high magnetic field strengths. Magn Reson Imaging. 2008;26(8):1145-51.
11. Sun H, Klahr AC, Kate M, Gioia LC, Emery DJ, Butcher KS, Wilman AH. Quantitative Susceptibility Mapping for Following Intracranial Hemorrhage. Radiology. 2018;288(3):830-839.
Figures