3996
Quantitative Susceptibility Mapping of Liver Iron Overload using Deep Learning1Radiology, University of Wisconsin-Madison, Madison, WI, United States, 2Medical Physics, University of Wisconsin-Madison, Madison, WI, United States, 3School of Information Technology and Electrical Engineering, University of Queensland, Brisbane, Australia, 4GE Global Research, Niskayuna, NY, United States, 5Biomedical Engineering, University of Wisconsin-Madison, Madison, WI, United States, 6Medicine, University of Wisconsin-Madison, Madison, WI, United States, 7Emergency Medicine, University of Wisconsin-Madison, Madison, WI, United States
Synopsis
A novel deep learning-based technique for quantitative susceptibility mapping (QSM) of liver iron overload was developed and validated. The proposed method relies on a 3D fully convolutional neural network, trained using synthetic dataset from a digital torso phantom that includes major organs. This study also included patients with iron overload who were imaged under 3T with using a single breath-hold multi-echo acquisition. Results showed promising performance and agreement with reference susceptibility measurements across a wide range of iron overload cases.
Introduction
Accurate measurement of liver iron concentration (LIC) is needed for the non-invasive assessment of iron overload1,2. MRI-based quantitative susceptibility mapping (QSM), primarily developed for brain applications, has potential for quantification of LIC3-5. A recently developed QSM technique for the abdomen demonstrated correlation between LIC and susceptibility3,4. However, this technique suffers from heavy computational requirements and susceptibility underestimation4.Deep learning (DL)-based QSM has the potential to overcome these challenges. In recent works, various DL-based QSM methods have been developed for brain applications. For instance, QSMnet, QSMGAN, and AutoQSM rely on a U-net trained using in vivo data6-8. In contrast, DeepQSM is trained using simulated data9. Despite these brain-focused developments, DL-based QSM for the abdomen remains largely unexplored.
In this study, we propose a COnvolution-Based Reconstruction Algorithm for χ (susceptibility), which will be referred to as CobraChi, a novel DL-QSM reconstruction method for quantifying liver iron overload.
Methods
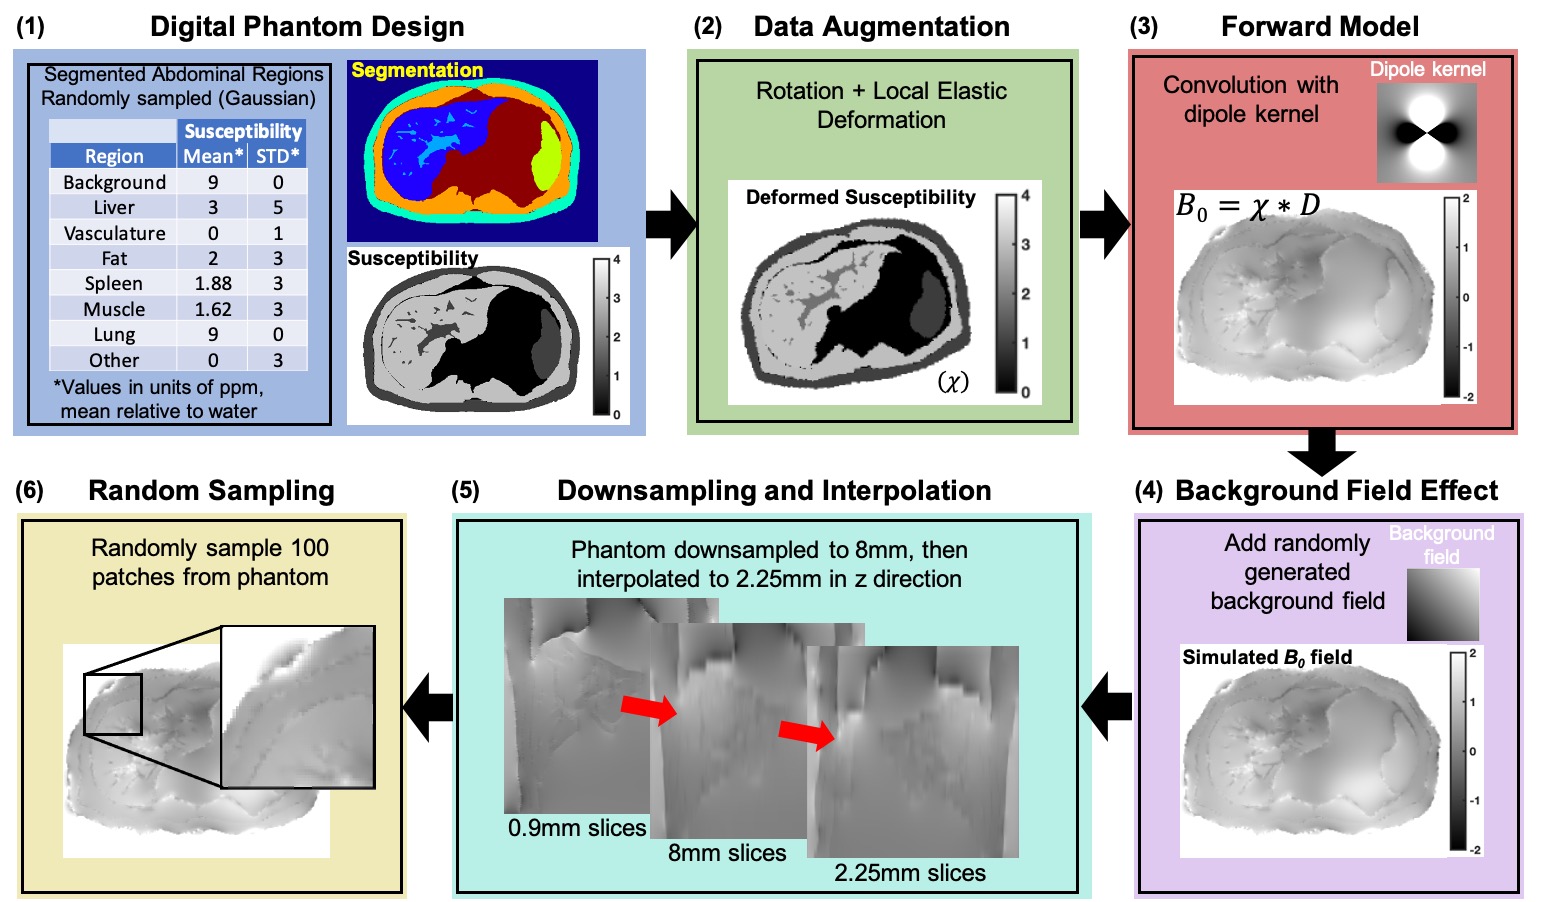
The proposed CobraChi method includes the following components: (1) Training data based on a simulated high resolution torso digital phantom including various levels of iron overload and geometric deformations10,11; (2) DL framework based on a 3D U-net9; (3) Simultaneous resolution of the dipole inversion problem12 and background field removal for liver QSM3.Training data: The simulated data were generated using a 3D (256x256x256) torso volume, including 9 different labeled regions (eg: organs). A range of susceptibility values was assigned to each region, and the volume underwent data augmentation through various spatial deformations, to generate 100 volumes for training (see Figure 1).
Deep learning framework: A 3D fully convolutional neural network based on a modified U-net structure9 was used. The U-net included connections between the contracting and expanding part of the network, as well as dropout (0.15)9.
Network training: The network was trained with 10000 64x64x64 image volumes extracted randomly from 100 256x256x103 synthetic torso volumes. Using Tensorflow with the Adam optimizer, 74,900 steps with 40 examples per step, and learning rate of 0.00001 resulted in a total training time of 34 hours, using an NVIDIA Tesla V100 GPU.
In vivo data acquisition: In a prospective, IRB-approved study, 41 patients with known or suspected iron overload were recruited with informed written consent. Scanning was performed at 3.0T (MR750 or Premier, GE Healthcare). Three-dimensional spoiled gradient echo (SGRE) was acquired in a 20s breath-hold, with the following parameters: FOV=40x32cm2, slice=8mm, TR=8ms, flip=3°, 6 echoes with TE1=1.2ms, ΔTE=1.0ms. Data were interpolated using zero-filling from 8mm to 2.25mm slice thickness to match the training data resolution (Figure 1). In addition, reference LIC was measured using the FDA-approved R2-based FerriScan (Resonance Health)13.
Data processing: From the multi-echo SGRE data, we measured B0 field, water, fat, proton density fat fraction (PDFF), and R2* maps. Field maps were used as input for the CobraChi network. Note that no separate background field removal was applied in CobraChi reconstruction. For comparison, a previously proposed L2 optimization-based QSM algorithm was applied3.
Measurement and analysis: For each QSM algorithm, region of interest (ROI)-based susceptibility measurements were performed in the right liver lobe as well as in the adjacent subcutaneous fat (as a susceptibility reference that does not accumulate iron). Linear correlation analysis was performed with reference susceptibility estimates derived from the FerriScan LIC using a previous calibration14.
Results
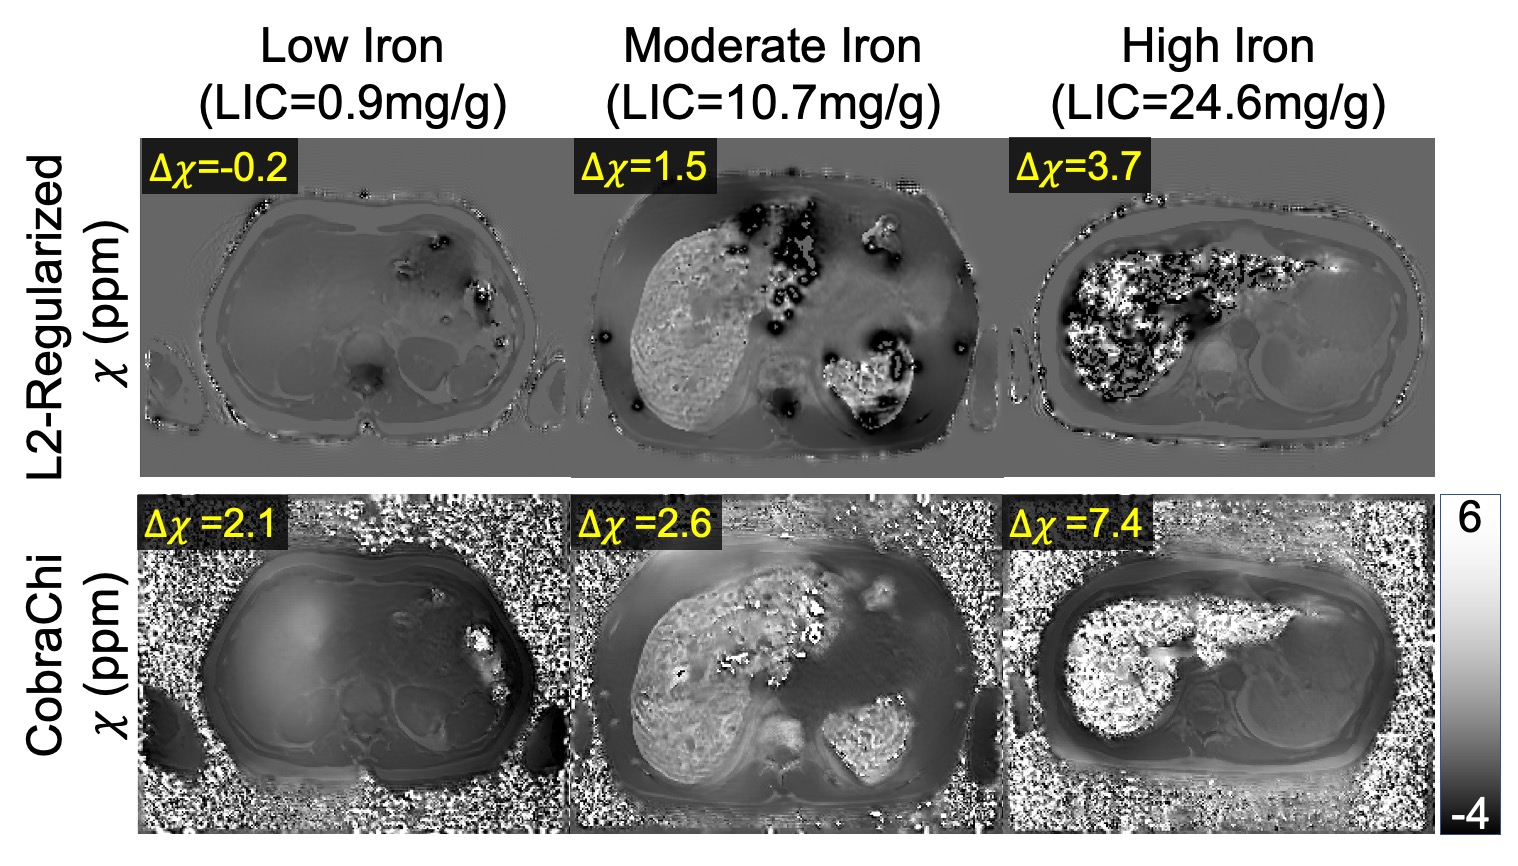
For each 3D dataset, the proposed DL-based method required 3 seconds whereas the previously proposed regularized QSM method required 50 minutes.Both DL-based and regularized QSM susceptibility maps demonstrated good image quality (see Figure 2). Compared to the regularized method, CobraChi may provide better robustness at high iron levels, as observed in a patient with R2*>900s-1. With such high R2*, the acquired echo images have low SNR and field mapping is challenging, complicating subsequent QSM estimation using the previous non-DL regularized method. Nevertheless, CobraChi leads to residual shading in the susceptibility map, particularly at low iron levels.
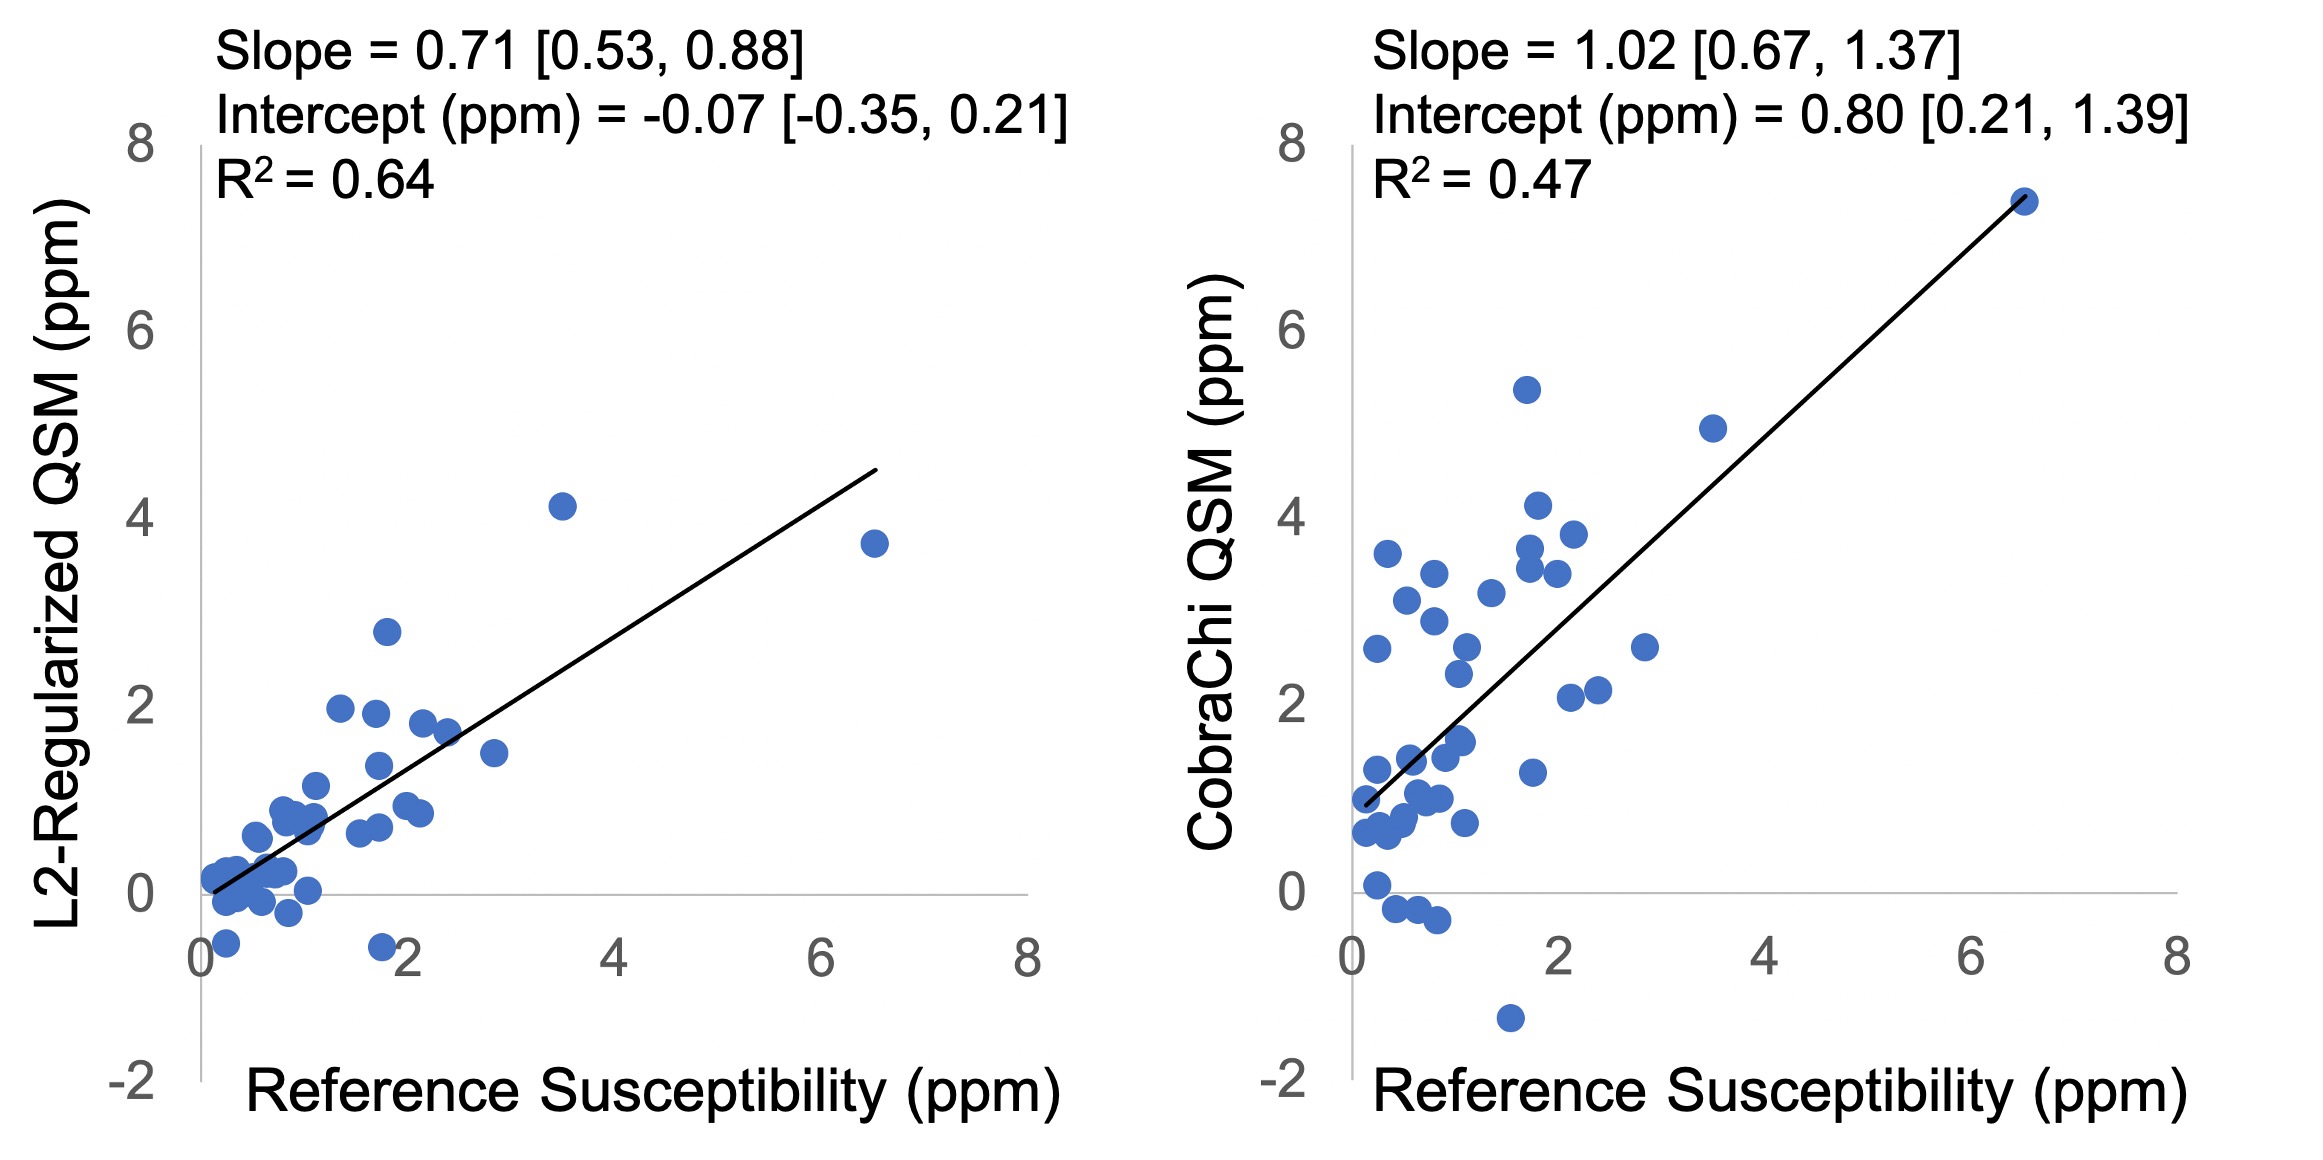
Figure 3 shows the regression analysis between estimated susceptibility and reference LIC-based susceptibility for each algorithm. L2-regularized QSM had a higher correlation coefficient, whereas CobraChi demonstrated a slope closer to 1.
Discussion
In this work we developed and evaluated a novel DL-based QSM method for the quantification of liver iron overload. Validation results demonstrated promising performance and agreement with reference susceptibility measurements across a wide range of iron overload.Compared to previous DL-based QSM methods, CobraChi uses an anatomically accurate digital torso phantom for training. Compared to previous regularization-based liver QSM3, the proposed method (after training) is substantially faster. Further, CobraChi may avoid the previously observed underestimation in liver QSM, although it led to lower correlation coefficient with reference measurements. In addition, CobraChi only uses field map for susceptibility mapping, whereas previous regularized QSM relies on additional maps (water, fat, PDFF, R2*) to guide anatomical constraints. Therefore, it should be possible to enhance CobraChi through the introduction of additional anatomical or signal information15.
This work has several limitations. This is a preliminary evaluation of a novel method, and further optimization and validation are necessary. Further, validation using a non-MRI reference (eg: from SQUID liver biosusceptometry) would be highly desirable.
Acknowledgements
The authors wish to acknowledge support from the NIH (R01‐DK117354, R01‐DK100651, and R01‐DK088925). In addition, GE Healthcare provides research support to the University of Wisconsin-Madison. Finally, Dr. Reeder is a Romnes Faculty Fellow, and has received an award provided by the University of Wisconsin-Madison Office of the Vice Chancellor for Research and Graduate Education with funding from the Wisconsin Alumni Research Foundation.References
1. Angelucci E, Brittenham GM, McLaren CE, Ripalti M, Baronciani D, Giardini C, Galimberti M, Polchi P, Lucarelli G. Hepatic iron concentration and total body iron stores in thalassemia major. The New England journal of medicine. 2000;343(5):327-31. doi: 10.1056/NEJM200008033430503. PubMed PMID: 10922422.
2. Sirlin CB, Reeder SB. Magnetic resonance imaging quantification of liver iron. Magnetic resonance imaging clinics of North America. 2010;18(3):359-81, ix. Epub 2010/11/26. PubMed PMID: 21094445.
3. Sharma SD, Hernando D, Horng DE, Reeder SB. Quantitative susceptibility mapping in the abdomen as an imaging biomarker of hepatic iron overload. Magnetic resonance in medicine : official journal of the Society of Magnetic Resonance in Medicine / Society of Magnetic Resonance in Medicine. 2015;74(3):673-83. Epub 2014/09/10. doi: 10.1002/mrm.25448. PubMed PMID: 25199788; PMCID: PMC4362853.
4. Sharma SD, Fischer R, Schoennagel BP, Nielsen P, Kooijman H, Yamamura J, Adam G, Bannas P, Hernando D, Reeder SB. MRI-based quantitative susceptibility mapping (QSM) and R2* mapping of liver iron overload: Comparison with SQUID-based biomagnetic liver susceptometry. Magn Reson Med. 2017;78(1):264-70. Epub 2016/08/12. doi: 10.1002/mrm.26358. PubMed PMID: 27509836; PMCID: PMC5303570.
5. Li J, Lin H, Liu T, Zhang Z, Prince MR, Gillen K, Yan X, Song Q, Hua T, Zhao X, Zhang M, Zhao Y, Li G, Tang G, Yang G, Brittenham GM, Wang Y. Quantitative susceptibility mapping (QSM) minimizes interference from cellular pathology in R2* estimation of liver iron concentration. Journal of magnetic resonance imaging : JMRI. 2018;48(4):1069-79. Epub 2018/03/23. doi: 10.1002/jmri.26019. PubMed PMID: 29566449; PMCID: PMC6151179.
6. Yoon J, Gong E, Chatnuntawech I, Bilgic B, Lee J, Jung W, Ko J, Jung H, Setsompop K, Zaharchuk G, Kim EY, Pauly J, Lee J. Quantitative susceptibility mapping using deep neural network: QSMnet. NeuroImage. 2018;179:199-206. Epub 2018/06/13. doi: 10.1016/j.neuroimage.2018.06.030. PubMed PMID: 29894829.
7. Chen Y, Jakary A, Avadiappan S, Hess CP, Lupo JM. QSMGAN: Improved Quantitative Susceptibility Mapping using 3D Generative Adversarial Networks with increased receptive field. NeuroImage. 2020;207:116389. Epub 2019/11/25. doi: 10.1016/j.neuroimage.2019.116389. PubMed PMID: 31760151.
8. Wei H, Cao S, Zhang Y, Guan X, Yan F, Yeom KW, Liu C. Learning-based single-step quantitative susceptibility mapping reconstruction without brain extraction. NeuroImage. 2019;202:116064. Epub 2019/08/05. doi: 10.1016/j.neuroimage.2019.116064. PubMed PMID: 31377323; PMCID: PMC6819263.
9. Bollmann S, Rasmussen KGB, Kristensen M, Blendal RG, Ostergaard LR, Plocharski M, O'Brien K, Langkammer C, Janke A, Barth M. DeepQSM - using deep learning to solve the dipole inversion for quantitative susceptibility mapping. NeuroImage. 2019;195:373-83. Epub 2019/04/03. doi: 10.1016/j.neuroimage.2019.03.060. PubMed PMID: 30935908.
10. Billot B, Greve DN, Leemput KV, Fischl B, Iglesias JE, Dalca A. A Learning Strategy for Contrast-agnostic MRI Segmentation. In: Tal A, Ismail Ben A, Marleen de B, Maxime D, Herve L, Christopher P, editors. Proceedings of the Third Conference on Medical Imaging with Deep Learning; Proceedings of Machine Learning Research: PMLR; 2020. p. 75--93.
11. Billot B, Robinson E, Dalca AV, Iglesias JE, editors. Partial Volume Segmentation of Brain MRI Scans of Any Resolution and Contrast2020; Cham: Springer International Publishing.
12. Wang Y, Liu T. Quantitative susceptibility mapping (QSM): Decoding MRI data for a tissue magnetic biomarker. Magnetic resonance in medicine : official journal of the Society of Magnetic Resonance in Medicine / Society of Magnetic Resonance in Medicine. 2015;73(1):82-101. Epub 2014/07/22. doi: 10.1002/mrm.25358. PubMed PMID: 25044035; PMCID: PMC4297605.
13. St Pierre TG, Clark PR, Chua-Anusorn W. Measurement and mapping of liver iron concentrations using magnetic resonance imaging. Ann N Y Acad Sci. 2005;1054:379-85. Epub 2005/12/13. doi: 1054/1/379 [pii]10.1196/annals.1345.046. PubMed PMID: 16339686.
14. Liu S, Wang C, Zhang X, Zuo P, Hu J, Haacke EM, Ni H. Quantification of liver iron concentration using the apparent susceptibility of hepatic vessels. Quant Imaging Med Surg. 2018;8(2):123-34. Epub 2018/04/21. doi: 10.21037/qims.2018.03.02. PubMed PMID: 29675354; PMCID: PMC5891678.
15. Liu F, Feng L, Kijowski R. MANTIS: Model-Augmented Neural neTwork with Incoherent k-space Sampling for efficient MR parameter mapping. Magnetic resonance in medicine : official journal of the Society of Magnetic Resonance in Medicine / Society of Magnetic Resonance in Medicine. 2019;82(1):174-88. Epub 2019/03/13. doi: 10.1002/mrm.27707. PubMed PMID: 30860285; PMCID: PMC7144418.
Figures