3995
Improved Regularization for Quantitative Susceptibility Mapping of Liver Iron Overload
Julia V Velikina1, Ruiyang Zhao1,2, Collin Buelo2, Alexey A Samsonov1, Scott Reeder1,2,3,4,5, and Diego Hernando1,2
1Radiology, University of Wisconsin-Madison, Madison, WI, United States, 2Medical Physics, University of Wisconsin - Madison, Madison, WI, United States, 3Biomedical Engineering, University of Wisconsin - Madison, Madison, WI, United States, 4Emergency Medicine, University of Wisconsin - Madison, Madison, WI, United States, 5Medicine, University of Wisconsin - Madison, Madison, WI, United States
1Radiology, University of Wisconsin-Madison, Madison, WI, United States, 2Medical Physics, University of Wisconsin - Madison, Madison, WI, United States, 3Biomedical Engineering, University of Wisconsin - Madison, Madison, WI, United States, 4Emergency Medicine, University of Wisconsin - Madison, Madison, WI, United States, 5Medicine, University of Wisconsin - Madison, Madison, WI, United States
Synopsis
QSM may enable accurate quantification of liver iron overload. However, QSM of the abdomen faces a number of unique challenges due to large variations in susceptibility, presence of fat, and motion, which further confound the ill-posed inverse problem. We propose an approach to optimize the use of additional information provided by CSE imaging to regularize the QSM inversion problem. We validated this approach at 3T in patients with various levels of iron overload, including assessment of test-retest repeatability. This approach resulted in significantly reduced shading artifact, improved quality of susceptibility maps, and higher repeatability of measurements.
Introduction
Quantitative susceptibility mapping (QSM) may enable accurate assessment of liver iron content1-3. Historically developed for brain imaging, QSM performs dipole inversion of the local susceptibility-induced field map, with regularization needed due to ill-posed nature of the inverse problem4. QSM techniques in body imaging face additional challenges, including more complex anatomy, presence of fat, rapid signal decay (especially for severe iron overload), and respiratory motion. These lead to errors in the measured field map, complicate QSM preprocessing (background field removal) and dipole inversion, creating errors and artifacts/shading in the resulting susceptibility maps. These challenges are exacerbated by liver iron overload and require specialized techniques5,6. In this work, we capitalize on the fact that chemical-shift-encoded (CSE) imaging7 used for field mapping in the liver provides additional information that can be exploited to improve dipole inversion. In particular, acquisition of multi-echo data enables estimation not only of the B0 field map but also fat and water images, $$$R_2^*$$$, and fat fraction (FF) maps. We describe an optimized method that uses information provided by CSE to improve accuracy and repeatability of liver QSM.Theory
Prior Work:We follow the formulation5 of simultaneous background field removal and susceptibility distribution estimation from multi-echo data collected in a single breath-hold:
$$\chi=\arg\min_\chi\left(||WL(\psi-D\ast\chi)||_2^2+\lambda||P\chi||_2^2\right),\qquad\qquad\qquad\qquad\qquad\qquad\qquad\qquad\qquad\qquad\quad(1)$$
where $$$\chi$$$ is magnetic susceptibility, $$$D$$$ dipole kernel, $$$\psi$$$ measured field map, $$$L$$$ the Laplace operator for background field removal, $$$W$$$ a weighting matrix accounting for spatial noise variations, $$$P$$$ regularization operator with parameter $$$\lambda$$$. Previously5, $$$W$$$ was selected to be sum-of-squares of image intensities across all echoes as a measure of SNR in the field map data, while $$$P$$$ combined edge mask and smoothness constraints.
Proposed Method:
The first feature of the proposed method hinges on the fact that the quality of the field map is crucial for the performance of QSM. In practice, the field map may contain errors ranging from phase wraps to areas of poor fit (e.g., due to high iron content, motion, etc.), which can be detected by analyzing residuals of the multi-echo CSE fit8. To account for field map estimation uncertainties and to counteract amplification and propagation of these errors by the iterative inversion, we propose modulating the weighting matrix by the residual fit error:
$$W(r)=\left(\sum_{n=1}^{N_{TE}}|s(r,t_n)|^2\right)^{1/2}/\left(\sum_{n=1}^{N_{TE}}\left|s(r,t_n)-\left(s_{water}(r)+s_{fat}(r)\sum_{j=1}^6\rho_je^{-2{\pi}i{\Delta}f_jt_n}\right)\right|^2\right)^{1/2},\qquad(2)$$
where $$$s(r,t_n)$$$ are source images at pixel location $$$r$$$ at echo time $$$t_n$$$, $$$s_{water}$$$ and $$$s_{fat}$$$ are water and fat images, respectively, $$${\Delta}f_j$$$ and $$$\rho_j$$$ are frequency shifts of fat species relative to water and their relative amplitudes.
The second feature of the method is incorporation of susceptibility priors $$$\chi_0$$$ that can be learned with sufficient confidence from the CSE fat/water (F/W) separation in spatial locations defined by a mask M, included into formulation as follows:
$$\chi=\arg\min_\chi\left(||WL(\psi-D\ast\chi)||_2^2+\lambda||P\chi||_2^2+\mu||M(\chi-\chi_0)||_2^2\right).\qquad\qquad\qquad\qquad\qquad\qquad(3)$$
In this work, we exploit the availability of FF map and the assumption of uniform susceptibility in fat since the adipose tissue does not accumulate iron2,5. As QSM allows only relative quantification of susceptibility (e.g., using fat as the reference), we impose a soft ($$$l_2$$$) constraint of $$$\chi_{fat}\approx0$$$ within the fat mask.
Methods
With IRB approval and informed written consent, 15 human subjects with known or suspected iron overload were scanned in a single 8s breath-hold at 3.0T (MR750 or Premier, GE Healthcare) using multi-echo 3D SGRE sequence (axial orientation, FOV=40x32cm2,slice=8mm,TR=8.0ms,FA=3°,six TEs: TE1=1.2ms,ΔTE=1.0ms). To evaluate repeatability, MRI table was removed from the scanner, coil array was removed, the subject was asked to sit up and lie back down, coil was replaced, table was returned into the scanner, and the same acquisition was repeated. The collected data were processed with graph-cut approach for CSE F/W separation9 to estimate the field map, used as input for QSM. The mapping was performed using the original liver QSM (Eq.1) and the proposed (Eqs.2-3) method with fat mask $$$M_{fat}$$$ comprising pixels with $$$\rm{FF}>0.9$$$. For both methods, susceptibility values were quantified relative to the average susceptibility in fat. We tested correlations between $$$R_2^*$$$ and the obtained susceptibility values averaged in ROIs placed in the right liver lobe and assessed repeatability using Spearman’s rank correlation and Bland-Altman analysis10.Results
The impact of regions with poor signal/high residual error in the multi-echo CSE fit (Fig.1a-b) is reduced by the proposed adaptive weighting (Fig.1c-d), which, combined with soft fat constraint, leads to reduced shading in the susceptibility maps (Fig.2). The linear modeling of relationship between $$$R_2^*$$$ and $$$\chi$$$ (Fig.3) is consistent across test/re-test and also with previously reported values5. Importantly, inclusion of fat constraint and adaptive weighting leads to lower sensitivity to field map errors, which are especially likely for high liver iron due to low SNR in field map, which results in improved repeatability as illustrated in Figs.4-5.Discussion and Conclusions
Abdominal QSM faces a number of unique challenges due to large variations in susceptibility, presence of fat, and motion, which further confound an ill-posed inverse problem. We proposed an approach to optimize the use of additional information provided by CSE imaging to regularize the QSM inversion problem. This approach resulted in significantly reduced shading artifact, improved quality of susceptibility maps, and higher repeatability of measurements. Additional validation using reference measurements of liver iron concentration, or liver susceptibility (e.g., from SQUID liver biosusceptometry) is highly desirable and remains a future work.Acknowledgements
The authors wish to acknowledge support from the NIH (R01 DK117354, R01 DK100651, R01 DK088925, R01EB027087). Also, GE Healthcare provides research support to the University of Wisconsin. Dr. Reeder is a Romnes Faculty Fellow and has received an award provided by the University of Wisconsin-Madison Office of the Vice Chancellor for Research and Graduate Education with funding from the Wisconsin Alumni Research Foundation.References
- Chu Z, Cohen AR, Muthupillai R, Chung T, Wang ZJ. MRI measurementof hepatic magnetic susceptibility—phantom validation andnormal subject studies. Magn Reson Med. 2004;52:1318–1327.
- Hernando D, Cook RJ, Diamond C, Reeder SB. Magnetic susceptibilityas a B0 field strength independent MRI biomarker of liver iron overload.Magn Reson Med. 2013;70:648–656.
- Sharma SD, Fischer R, Schoennagel BP, Nielsen P, Kooijman H, Yamamura J, Adam G, Bannas P, Hernando D and Reeder SB. MRI‐based quantitative susceptibility mapping (QSM) and R2* mapping of liver iron overload: Comparison with SQUID‐based biomagnetic liver susceptometry. Magn Reson Med. 2017;78:264-270.
- Li L and Leigh JS. Quantifying arbitrary magnetic susceptibility distributions with MR. Magn Reson Med. 2004;51:1077-1082.
- Sharma SD, Hernando D, Horng DE, Reeder SB. Quantitative susceptibility mapping in the abdomen as an imaging biomarker of hepatic iron overload. Magn Reson Med. 2015 Sep;74(3):673-83.
- Jafari R, Sheth S, Spincemaille P, Nguyen TD, Prince MR, Wen Y, Guo Y, Deh K, Liu Z, Margolis D, Brittenham GM, Kierans AS, Wang Y. Rapid automated liver quantitative susceptibility mapping. J Magn Reson Imaging. 2019;50(3):725-732.
- Reeder SB, Wen Z, Yu H, Pineda AR, Gold GE, Markl M, Pelc NJ. Multicoil Dixon chemical species separation with an iterative least-squares estimation method. Magn Reson Med. 2004;51(1):35-45.
- Yu H, Reeder SB, Shimakawa A, McKenzie CA, Brittain JH. Robust multipoint water-fat separation using fat likelihood analysis. Magn Reson Med. 2012;67(4):1065-76.
- Hernando D, Kellman P, Haldar JP, Liang ZP. Robust water/fat separation in the presence of large field inhomogeneities using a graph cut algorithm. Magn Reson Med. 2010;63(1):79-90.
- Bland JM, Altman DG. Measuring agreement in method comparison studies. Stat Methods Med Res. 1999;8:135–160.
Figures
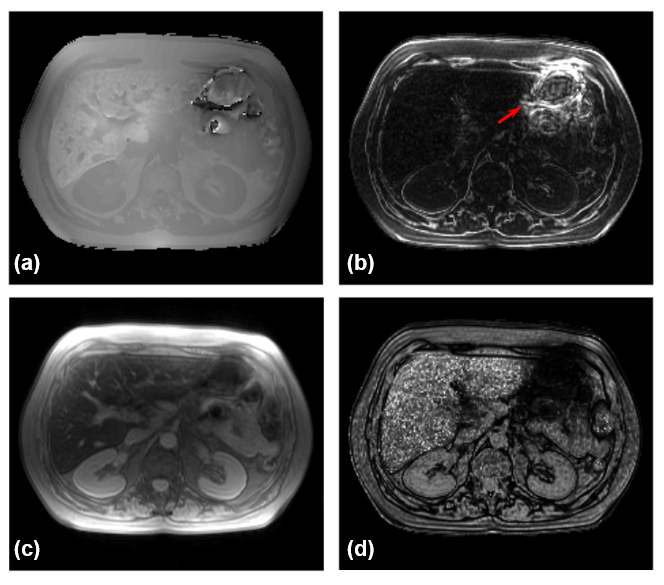
Figure 1. (a) Field map for a single slice in a patient with elevated liver iron content. Note areas of poor field map estimation near the intestine, likely due to the presence of air and motion. (b) Residual of CSE F/W separation fit. Note areas of poor fit near the intestine (arrow) as well as in partial volume voxels (tissue boundaries). (c) Sum of squares image used for data weighting in the original method5. (d) Residual-based data weighting of the proposed technique. Note that the proposed adaptive weighting reflects confidence in the field map estimate used as a QSM input.
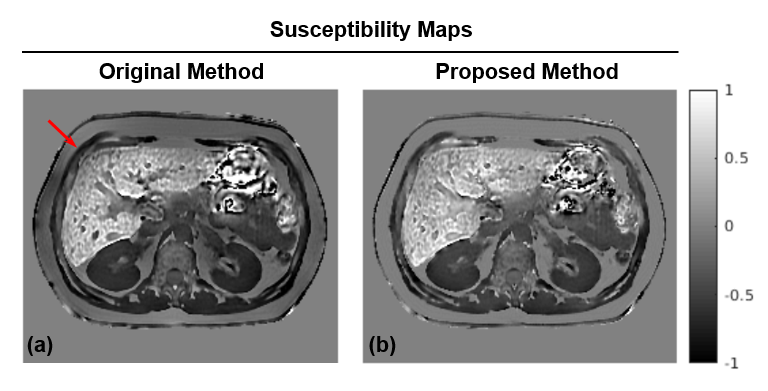
Figure 2. Comparison of susceptibility maps obtained with (a) the previous approach and (b) the proposed method. While the area of motion remains unrecovered, its impact on overall inversion is reduced in the proposed method as evidenced by improved homogeneity and reduced shading in the liver and subcutaneous fat (arrow).
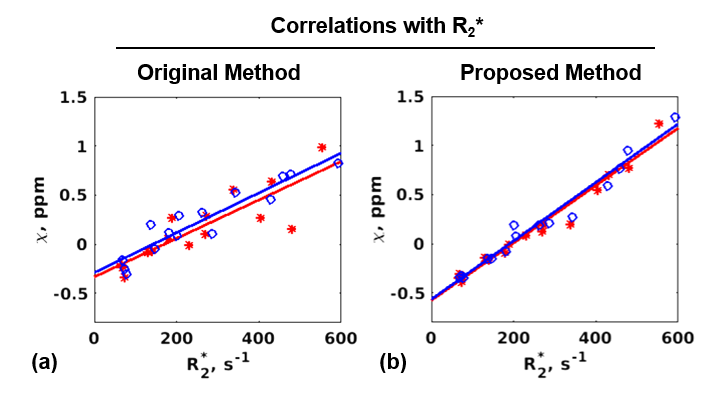
Figure 3. Correlation of R2* values in the liver with susceptibility values and the corresponding linear regression lines for test (red) and re-test (blue) exams obtained with (a) the original method (slopes 0.002/0.002, y-intercepts -0.334/-0.289, R2=0.858/0.939); (b) the proposed method (slopes 0.0029/0.003, y-intercepts -0.577/-0.566, R2=0.982/0.985). These slopes/intercepts are consistent with previously reported5 correlation results (slope 0.0028, y-intercept -0.54).
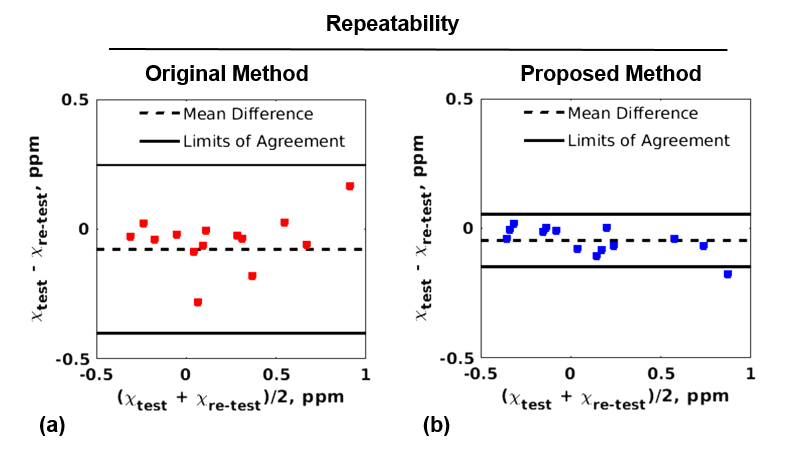
Figure 4. Bland-Altman plots for the two reconstruction approaches (a: original method, b: proposed method). The proposed method shows tighter limits of agreement (-0.149/0.054 vs. -0.401/0.247) and a smaller bias (-0.048 vs. -0.077) compared to the original one. Higher repeatability of the proposed method is further confirmed by Spearman’s rank correlation, which is 0.61 (p=0.017) for the original method and 0.79 (p=0.001) for the proposed method.
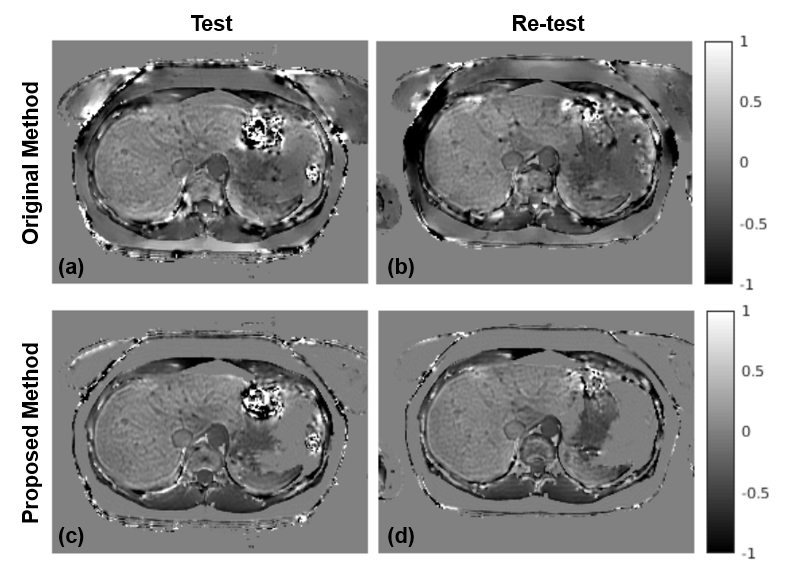
Figure 5. Compared to the original liver QSM method (a: test, b: re-test), the proposed method (c: test, d: re-test) produces more consistent (repeatable) susceptibility maps. The improved repeatability may be explained by the fact that the proposed method is less sensitive to errors in the field map induced by air/tissue interface due to adaptive data weighting, which, together with fat constraint, reduces shading artifacts.