3994
Investigating the Magnetic Susceptibility of Silent Cerebral Infarcts in Sickle Cell Anaemia Using Two Different Gradient Echo Acquisitions1Department of Medical Physics and Biomedical Engineering, University College London, London, United Kingdom, 2Imaging and Biophysics, Developmental Neurosciences, UCL Great Ormond Street Institute of Child Health, London, United Kingdom
Synopsis
Little is known about the histopathology of silent cerebral infarcts (SCI) in sickle cell anaemia (SCA). Therefore, we measured the magnetic susceptibility (χ) of SCI in 45 SCA subjects and 10 healthy controls using quantitative susceptibility mapping (QSM) calculated from two different gradient-echo (GRE) acquisitions. Significantly lower χ was measured in lesions located in the parietal lobes relative to the frontal lobe. No significant relationships with mean lesion χ were observed with subject age, lesion size or depth in white matter. Strong correlations and minimal biases were observed between mean lesion χ measured using the two GRE acquisitions.
Introduction
Silent Cerebral Infarcts (SCI), or “silent strokes”, are the most common neurologic injury in sickle cell anaemia (SCA). SCI are defined as lesions, present in subjects with a normal neurological examination which appear hyperintense on T2-weighted FLAIR images and are visible in two planes1. In SCA, the presence of SCI in white matter (WM) has been linked to a decline in Full Scale IQ and increased risk of clinical stroke2. However, little information is available on the histopathology of SCI in SCA and novel imaging techniques can now be used to characterize SCI, moving beyond lesion volumes and magnitude intensities3.Here, we aimed to investigate the magnetic susceptibility (χ) of SCI lesions in SCA using Quantitative Susceptibility Mapping (QSM). χ is a tissue property determined by its molecular composition including myelin, especially in WM. Therefore, WM χ changes may indicate demyelination, and myelin loss has been linked to SCI presence4.
We investigated whether χ differed between SCI lesions in SCA and healthy control (HC) subjects. We also examined whether χ varied between SCI lesions in each brain lobe, with depth within WM, subject age and lesion size. We calculated QSM from two different 3D multi-echo gradient echo (ME-GRE) acquisitions, aiming to examine the similarity between lesion χ measured using both ME-GRE acquisitions.
Methods
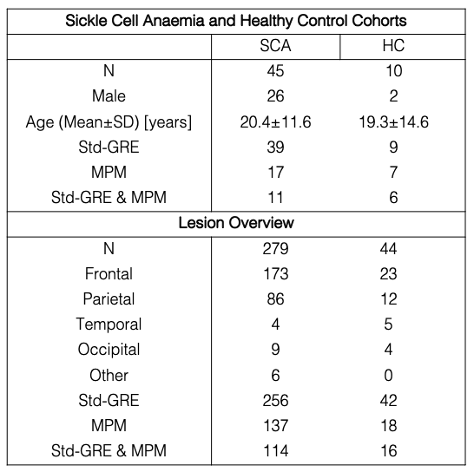
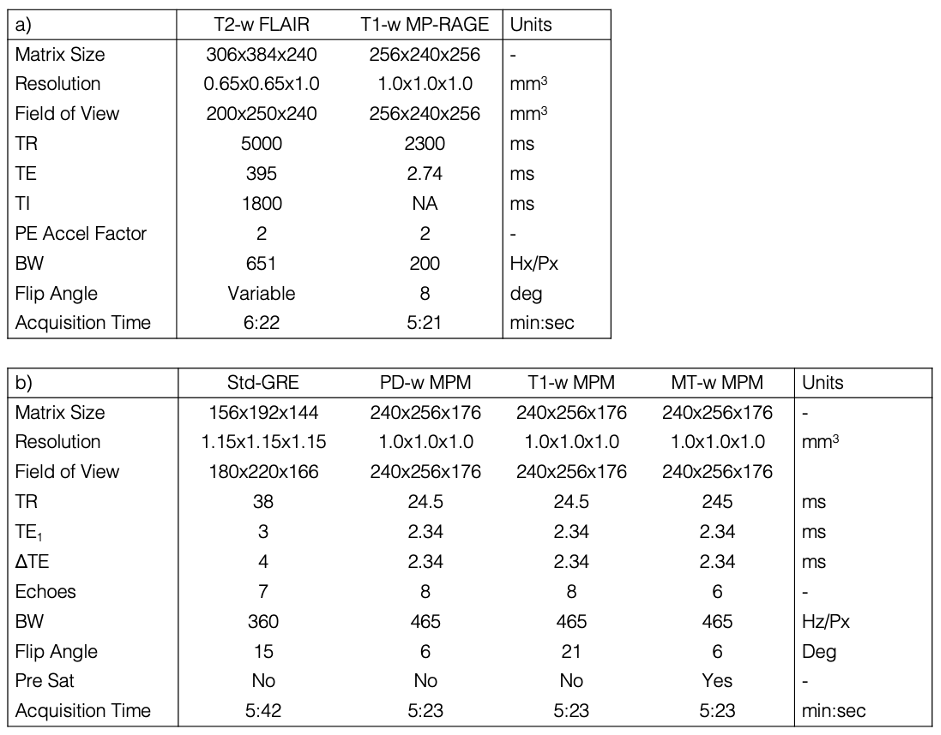
The SCA and HC cohorts are described in Figure 1. All subjects underwent MRI on a 3T Siemens Magnetom Prisma. The MRI protocol included T1-weighted MP-RAGE and T2-weighted Fluid-Attenuated Inversion Recovery (FLAIR) sequences (Figure 2a). The protocol also included a conventional ME-GRE sequence (Std-GRE) and/or a Multi-Parametric Mapping (MPM) acquisition comprising three separate ME-GRE sequences (Figure 2b). We have shown that MPM can produce accurate QSM, with results very similar to Std-GRE5 despite the two acquisitions having different resolutions, echo times, and fields of view.QSM was calculated from the Std-GRE using a previously described pipeline5. For the MPM acquisition the same QSM pipeline was applied to each ME-GRE sequence, χ maps were co-registered using NiftyReg6 to account for motion between sequences, and the MPM χ map was averaged across all three.
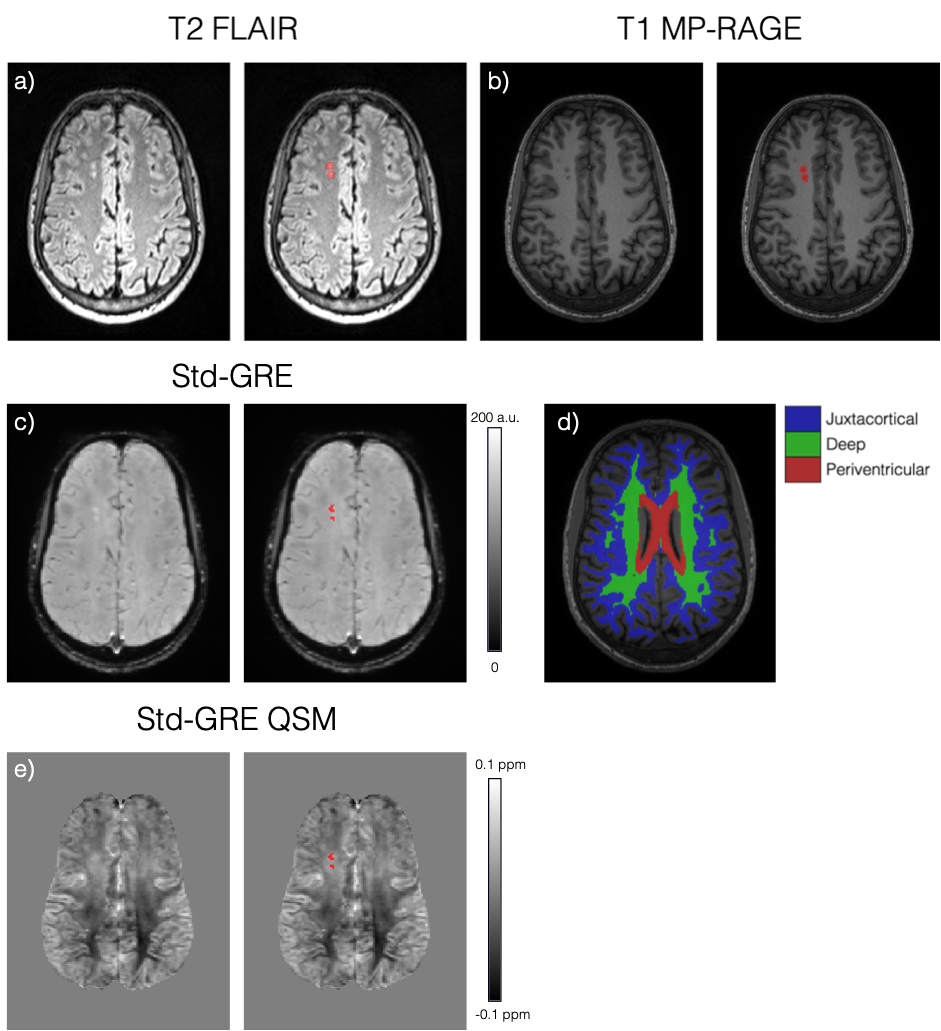
Each FLAIR image was examined by a neuroradiologist to identify SCI lesions and the lobes in which they were located. A generous region of interest (ROI) was manually drawn around each lesion. Ventricle, cortical and WM segmentations were calculated from the T1 MP-RAGE magnitude image using Freesurfer7. To remove any normal appearing WM from the lesion ROIs, a minimum intensity threshold was derived from the mean FLAIR magnitude intensity across the segmented cortex (1.02xmeanFLAIR CORTEX)8 and voxels with FLAIR intensities below this threshold were removed. The WM was further sub-divided into juxtacortical, deep, and periventricular regions based on percentile distance thresholds from the cortical/ventricle segmentations (Figure 3)9.
All FLAIR and MP-RAGE images were registered to the native QSM space using NiftyReg5 and the resultant transformations were applied to lesion and white matter segmentations. Mean ROI χ and standard deviation were then calculated in each lesion. For confluent lesions which spanned multiple WM regions, χ was measured in each of the three WM regions.
Results
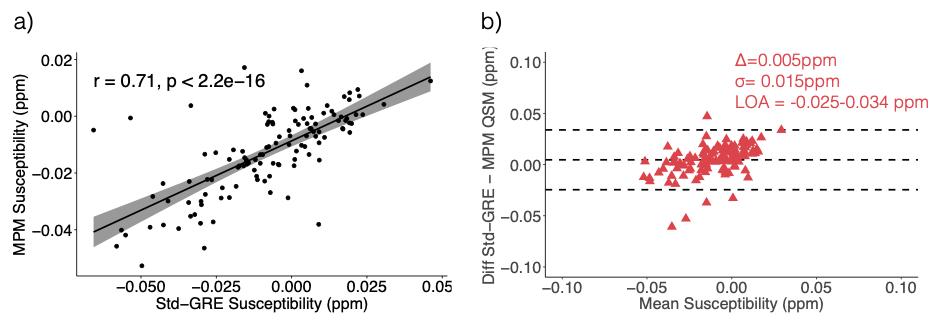
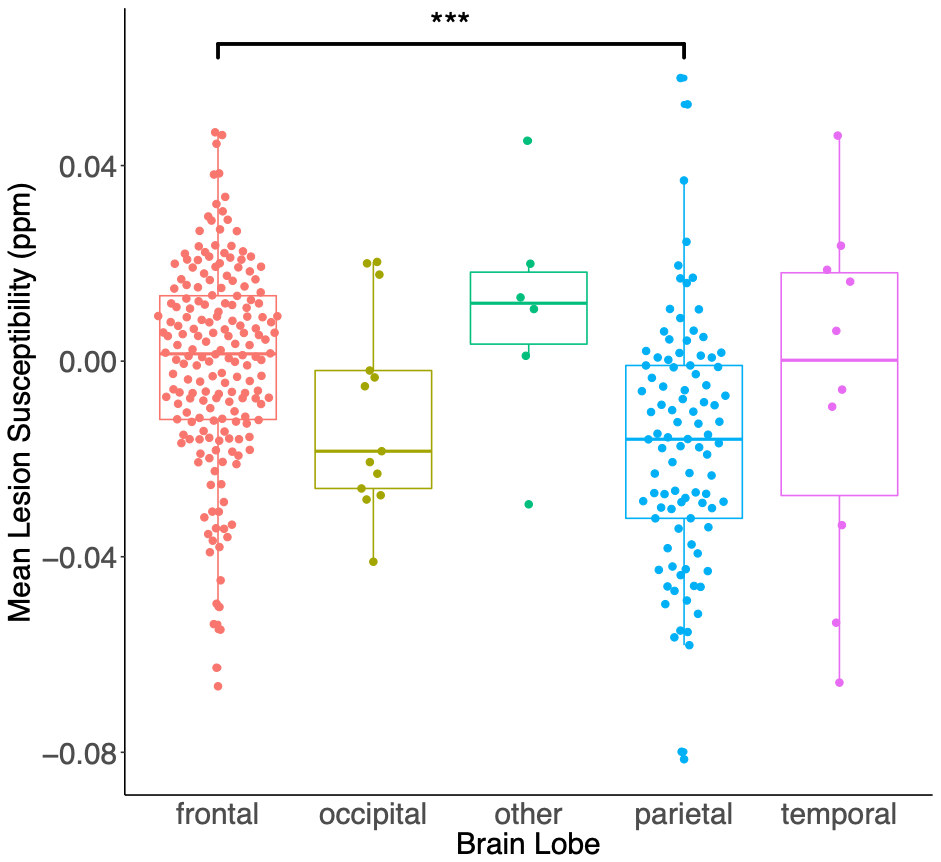
SCI lesion appearance in GRE magnitude and QSM images is illustrated in Figure 3c and 3e. Analysis of mean lesion χ in subjects with both Std-GRE and MPM acquisitions showed strong correlations (p<2.2e-16) and minimal bias between the two measures (Δ=0.005ppm) (Figure 4). Due to the strong similarities, χ values from the two acquisitions were included in a combined analysis. When both Std-GRE and MPM were available, χ values from the Std-GRE sequence were included due to the larger number of lesions imaged with Std-GRE only.Lesions in the frontal lobe were significantly more paramagnetic than those in the parietal lobe (Figure 5) suggesting a lower myelin content in frontal lobe lesions. The difference was significant when either the Std-GRE or MPM χ values were selected in lesions with both acquisitions. No differences in lesion χ were observed between SCA and HC subjects or between lesions in each of the WM-depth regions. There were no correlations between lesion χ and subject age or lesion size.
Discussion
In subjects with both Std-GRE and MPM acquisitions, extremely strong correlation was found between χ measurements from the two methods. This is reassuring regarding the repeatability of QSM even in WM regions with χ close to zero and potential χ anisotropy confounds. As no explicit reference region is used, this finding suggests that implicitly referencing χ to the whole brain average (via background field removal) provides repeatable χ between different ME-GRE sequences. We observed significant differences in χ between SCI lesions in the parietal and frontal lobes indicating that there may be increased demyelination in frontal lobe lesions. Future work will consider χ in lesions which meet the strictest SCI definition based upon T1 image intensities thresholds10.Conclusion
Quantitative susceptibility mapping (QSM) showed a significant difference between the magnetic susceptibility of silent cerebral infarcts in the frontal and parietal lobes of the brain. Lesion susceptibility was not associated with subject age, lesion size or depth in white matter. Lesion χ values were highly correlated between QSM calculated from two different gradient-echo acquisitions.Acknowledgements
Dr Karin Shmueli is supported by European Research Council Consolidator Grant DiSCo MRI SFN 770939. Hanne Stotesbury was funded by Action Medical Research (GN2509) and Jamie Kawadler was funded by Great Ormond Street Children’s Charity (V4615). The National Institute for Health Research (UK; PB-PG-1112-29099) and NHLBI (R01HL079937) provided funding for patient recruitment. The work was supported by the National Institute for Health Research and Biomedical Research Centre at Great Ormond Street Hospital for Children NHS Foundation Trust and the Institute of Child Health (IS-BRC-1215-20012).References
1. Casella JF, King AA, Barton B, et al. Design of the silent cerebral infarct transfusion (SIT) trial. Pediatric hematology and oncology. 2010;27(2):69–89.
2. Kugler S, Anderson B, Cross D, et al. Abnormal cranial magnetic resonance imaging scans in sickle-cell disease. Neurological correlates and clinical implications. Archives of Neurology. 1993;50(6):629–635.
3. Maillard P, Carmichael O, Harvey D, et al. FLAIR and diffusion MRI signals are independent predictors of white matter hyperintensities. American Journal of Neuroradiology. 2013;34(1):54-61.
4. DeBaun MR, Armstrong FD, McKinstry RC, et al. Silent cerebral infarcts: a review on a prevalent and progressive cause of neurologic injury in sickle cell anemia. Blood. 2012;119(20):4587-96.
5. Murdoch R, Kawadler J, Carmichael D, et al. Can Multi-Parametric Mapping Sequences be used for Accurate Quantitative Susceptibility Mapping? Proceedings of the 2020 ISMRM & SMRT VIRTUAL CONFERENCE & EXHIBITION #3206. 2020.
6. Modat M, Cash DM, Daga P, et al. Global image registration using a symmetric block-matching approach. Journal of Medical Imaging. 2014 Sep;1(2):024003.
7. Fischl B, Sereno MI, Dale AM. Cortical surface-based analysis: II: inflation, flattening, and a surface-based coordinate system. Neuroimage. 1999 Feb 1;9(2):195-207.
8. van der Land V, Hijmans CT, de Ruiter M, et al. Volume of white matter hyperintensities is an independent predictor of intelligence quotient and processing speed in children with sickle cell disease. British journal of haematology. 2015;168(4):553-6.
9. Stotesbury H, Kawadler JM, Clayden JD, et al: Definition, classification, and quantification of silent cerebral infarction on high-resolution FLAIR in sickle cell disease; limited utility for predicting cognition. 2021. In prep.
10. Choudhury NA, DeBaun MR, Rodeghier M, et al. Silent cerebral infarct definitions and full-scale IQ loss in children with sickle cell anemia. Neurology 2018; 90: e239–46.
Figures