3993
Validation Study of Venous Oxygenation in Internal Cerebral Vein in Patients with Sickle Cell Disease by QSM and CISSCO Method1Biomedical Engineering, University of Southern California, Los Angeles, CA, United States, 2Radiology, Academic Medical Center, Amsterdam, Netherlands, 3Children's Hospital Los Angeles, Los Angeles, CA, United States
Synopsis
Brain oxygenation can be measured using either T2-based methods or magnetic susceptibility-based methods. This study validates QSM and CISSCO methods in measuring the oxygenation in the internal cerebral vein and compares the results in sickle cell disease patients, anemia subjects with normal hemoglobin and healthy controls. Both methods reveal the group difference in the oxygen saturation in the deep structures. The limitations for both methods are discussed and the explanation for the bias between the two methods is provided.
Introduction
Sickle cell disease (SCD) is caused by a single amino acid mutation in hemoglobin, causing chronic hemolytic anemia and neurovascular complications.1 Imaging of brain oxygenation in deep cerebral veins could be a powerful tool to the balance between oxygen supply and demand in the deep structures. Quantitative susceptibility mapping (QSM) uses deconvolution of the magnetic dipole from magnetic field (B0) images to quantify the magnetic susceptibility shift between venous blood and background tissue and the susceptibility difference is converted to estimated venous oxygenation.2 Alternatively, a method called CISSCO (Complex Image Summation around a Spherical or a Cylindrical Object) was introduced to quantify susceptibility in narrow cylindrical objects.3 In this study, our goal was to validate venous oxygen saturation measured by QSM and CISSCO in the internal cerebral vein (ICV) in SCD patients, anemia subjects with normal hemoglobin and healthy controls.Methods
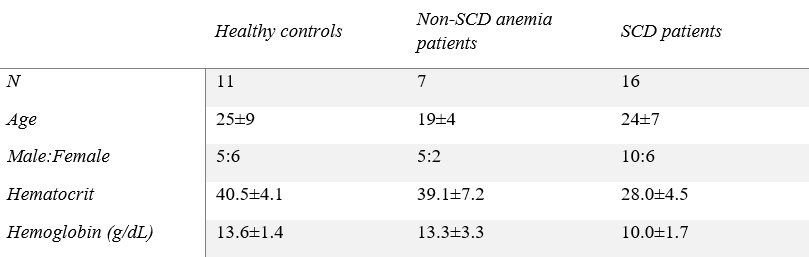
Demographics: 16 SCD patients, 7 non-sickle anemia patients and 11 healthy controls participated in the study (Table 1).MR acquisition: Images were acquired on a clinical 3 T Philips system and the 3D gradient echo sequence had parameters: TR = 30 ms, α = 25°, 2 echoes: TE1 = 4.94 ms, ΔTE = 5.2 ms, FOV = 210 x 190 x 120 mm3, spatial resolution: 0.6 x 0.6 x 1.3 mm3, SENSE factor = 2 and total acquisition time = 6 mins 50 s.
QSM: For each subject, phase images were fitted to generate a B0 field map. Brain extraction and phase unwrapping was performed using FSL.4 Background field was removed using projection onto dipole fields (PDF).5 Unreliable phase voxels were identified6 and removed from the brain mask for subsequent processing. L1-regularized field-to-susceptibility inversion was performed to derive the susceptibility map ($$$\lambda$$$=4×10⁻⁴).7 Venous oxygen saturation was computed based on:
$$\chi=(1-SvO_2)\chi_{d-o}Hct+\chi_{o-w}Hct$$
where $$$\chi$$$ is the susceptibility measurement of the ICV, $$$\chi_{d-o}$$$ is the susceptibility shift per unit hematocrit between fully oxygenated and fully deoxygenated erythrocytes, and $$$\chi_{o-w}$$$ is the susceptibility shift between oxygenated blood cells and water. Values of 0.27 ppm and -0.03 ppm were used for and.8 The ROI mask of the ICV was manually selected based on the susceptibility map that was threshold at 0.1 ppm to avoid partial-volume effect.
CISSCO: This method integrates the complex MR signals in three annuli around the cylinder of interest. The complex sums are cast into equations containing three unknown parameters, the susceptibility and radius of the cylinder, and the proton spin density. If the radius of a cylindrical object is a, the overall MR complex signal S within a coaxial cylinder with radius R is
$$S=\pi l\rho_0\vartheta\int_{\vartheta/R^2}^{g'} \frac{dx}{x^2}J_0(x)+\pi la^2\rho_{0,c}e^{i\varphi_{in}}$$
where $$$\varphi_{in} = -\gamma \frac{\Delta \chi}{6}(3cos^2\theta-1)B_0T_E$$$, $$$\Delta \chi$$$ is the susceptibility difference between tissues inside and outside, l is the slice thickness, $$$\rho_0$$$ and $$$\rho_{0,c}$$$ are the effective spin densities of the tissue outside and inside the object, $$$\vartheta$$$ is the effective magnetic moment, g' is the extremum phase value the surface of the object. After applying the equation to three coaxial cylinders, $$$\vartheta$$$, $$$\rho_0$$$ and $$$\Delta \chi$$$ can be solved sequentially.
Results
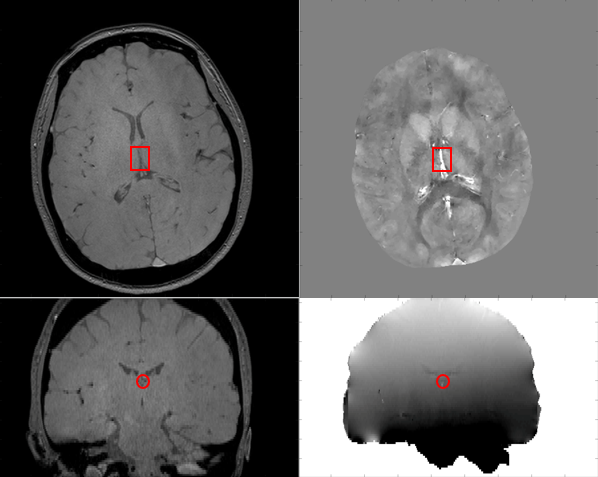
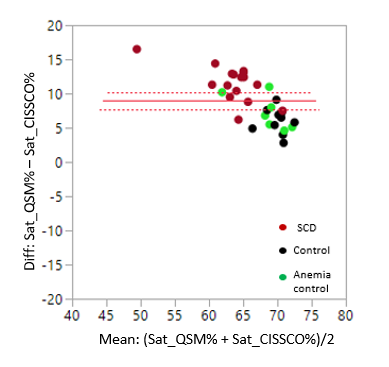
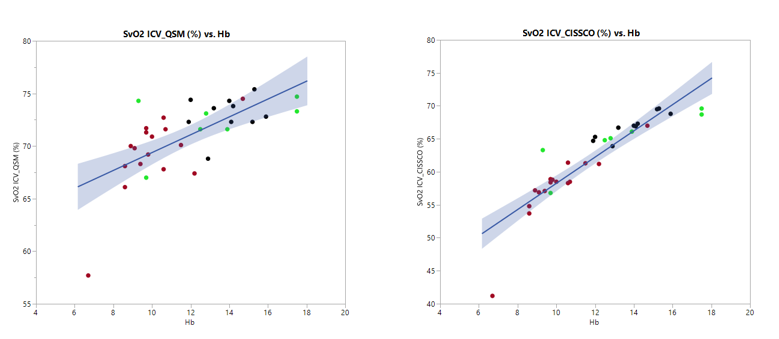
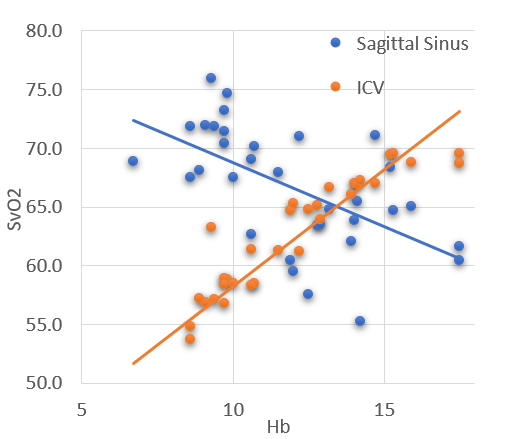
Figure 1 shows representative magnitude and phase images, the processed susceptibility map by QSM, and the internal cerebral vein. Mean ICV oxygen saturation measured by QSM in the three groups are 73.9% in CTL, 73.6% in ACTL, and SCD 69.3%, p<0.05 by analysis of variance. The mean ICV oxygen saturation measured by CISSCO are 67.0% in CTL, 64.9% in ACTL and 57.7% in SCD (p<0.05). There exists bias between these two methods and the Bland-Altman analysis is shown in Figure 2. The relationship between oxygen saturation and hemoglobin is shown in Figure 3. Both methods indicate that SCD patients have lower oxygen saturation in deep regions compared with healthy controls. Figure 4 shows the opposite correlation between oxygen saturation and hemoglobin in ICV revealed by CISSCO and in sagittal sinus measured by TRUST.9Discussion
There are some limitations for QSM. Partial-voluming effect causes susceptibility to be underestimated10, particularly in small vessels like the internal cerebral vein. And QSM estimates of vein saturation are impacted by nonlinear phase accrual in moving spins.11 We postulate that the two effects are responsible for the systemic bias between QSM and CISSCO oximetry in these patients. CISSCO overcomes these limitations by avoiding unstable dipole inversion and by inferring vessel susceptibility from its effect on surrounding tissue rather than from the blood itself. However, two major independent noise sources might introduce some bias in the quantified results, including the Gaussian noise and the systematic noise due to discrete pixels and Gibbs ringing.12 One other practical issue is that the chosen radii that are too small suffer from Gibbs ringing, and the ones too large have inadequate SNR.12From a physiological perspective, both methods reveal that ICV oxygen saturation is lower for SCD patients compared with healthy controls, with saturation proportional to hemoglobin. However, this is completely opposite to venous saturation in the sagittal sinus. Chronic anemia begets increased oxygen saturation in the sagittal sinus measured by TRUST and this paradoxical observation has been attributed to cortical steal.13 Our data suggests that this “physiologic shunting” favors gray matter perfusion, at the expense of deep white matter structures.
Acknowledgements
This work is supported by the National Heart Lung and Blood Institute (1RO1HL136484-A1, 1U01HL117718-01), the National Institutes of Health (1R01-NS074980), the National Institute of Clinical Research Resources (UL1 TR001855-02) and by research support in kind from Philips Healthcare.References
1. Ohene-Frempong, Kwaku, et al. "Cerebrovascular accidents in sickle cell disease: rates and risk factors." Blood, The Journal of the American Society of Hematology 91.1 (1998): 288-294.
2. Wang, Yi, and Tian Liu. "Quantitative susceptibility mapping (QSM): decoding MRI data for a tissue magnetic biomarker." Magnetic resonance in medicine 73.1 (2015): 82-101.
3. Hsieh, Ching-Yi, et al. "Susceptibility and size quantification of small human veins from an MRI method." Magnetic resonance imaging 33.10 (2015): 1191-1204.
4. Smith, Stephen M., et al. "Advances in functional and structural MR image analysis and implementation as FSL." Neuroimage 23 (2004): S208-S219.
5. Liu, Tian, et al. "A novel background field removal method for MRI using projection onto dipole fields." NMR in Biomedicine 24.9 (2011): 1129-1136.
6. Schweser, Ferdinand, et al. "Quantitative imaging of intrinsic magnetic tissue properties using MRI signal phase: an approach to in vivo brain iron metabolism?." Neuroimage 54.4 (2011): 2789-2807.
7. Bilgic, Berkin, et al. "MRI estimates of brain iron concentration in normal aging using quantitative susceptibility mapping." Neuroimage 59.3 (2012): 2625-2635.
8. Spees, William M., et al. "Water proton MR properties of human blood at 1.5 Tesla: Magnetic susceptibility, T1, T2, T, and non‐Lorentzian signal behavior." Magnetic Resonance in Medicine: An Official Journal of the International Society for Magnetic Resonance in Medicine 45.4 (2001): 533-542.
9. Lu, Hanzhang, et al. "Calibration and validation of TRUST MRI for the estimation of cerebral blood oxygenation." Magnetic resonance in medicine 67.1 (2012): 42-49.
10 Haacke, E. M., et al. "Susceptibility mapping as a means to visualize veins and quantify oxygen saturation." Journal of Magnetic Resonance Imaging 32.3 (2010): 663-676.
11 Betts, Matthew J., et al. "High-resolution characterisation of the aging brain using simultaneous quantitative susceptibility mapping (QSM) and R2* measurements at 7 T." Neuroimage 138 (2016): 43-63.
12 Hsieh, Ching-Yi, et al. "An improved method for susceptibility and radius quantification of cylindrical objects from MRI." Magnetic resonance imaging 33.4 (2015): 420-436.
13 Bush, Adam M., Thomas D. Coates, and John C. Wood. "Diminished cerebral oxygen extraction and metabolic rate in sickle cell disease using T2 relaxation under spin tagging MRI." Magnetic resonance in medicine 80.1 (2018): 294-303.
Figures