3991
Quantitative Susceptibility Mapping of Venous Vessels in Neonates With Perinatal Asphyxia1Pediatrics, UBC, Vancouver, BC, Canada, 2Radiology, Children’s Hospital of Chongqing Medical University, Chongqing, China, 3Physics, UBC, Vancouver, BC, Canada
Synopsis
We aimed to test whether Cerebral venous oxygen saturation (CSVO2) could be measured using quantitative susceptibility mapping (QSM) in three distinct groups: healthy term neonates, and asphyxia injured term and preterm neonates.
We acquired multi-echo gradient echo MRI data in 16 neonates with perinatal asphyxia and moderate or severe hypoxic-ischemic encephalopathy (HIE) (eight term-age, eight preterm, in eight healthy term-age controls.
QSM derived oxygen saturation values in preterm and term neonates agreed well with past literature. CSVO2 in preterm and term neonates with HIE, however, were not found to be significantly different from each other or healthy controls.
Introduction
Hypoxic-ischemic encephalopathy (HIE) occurs when the entire brain is deprived of an adequate supply of oxygen, and can result in neurological disability, such as cerebral palsy, mental retardation, and epilepsy. HIE occurs in 1.5 per 1,000 live births,1 and is the fifth leading cause of death worldwide in children under five years of age (8%).2While identifying HIE in term infants is generally well-characterized, its identification in preterm infants remains complex.3-6
Cerebral venous oxygen saturation (CSVO2) is the amount of left-over oxygen in the veins after oxygen delivery and extraction by the brain, and can act as a surrogate of brain oxygen consumption. Knowing CSVO2 in preterm and term infants who are suspected of having HIE could provide clinicians with invaluable information.
Quantitative susceptibility mapping (QSM)7,8 examines gradient-echo phase data, acquired using susceptibility-weighted imaging (SWI),9 to determine local tissue magnetic susceptibility (χ). SWI is already often acquired clinically and can be used to better characterize lesions.10 Since deoxyhemoglobin in the venous blood is paramagnetic, a decrease in χ of venous blood compared with the surrounding brain tissue will indicate increased CSVO2.
Thus, we set out to measure how well CSVO2 could be measured using QSM and Hct from blood samples in term and preterm neonates with moderate or severe HIE, and compare those values to healthy term controls. We hypothesized that, after perinatal asphyxia, both preterm and term-neonates with moderate or severe HIE would demonstrate increased CSVO2 through decreased cerebral vein magnetic susceptibility, compared to healthy term controls.
Methods
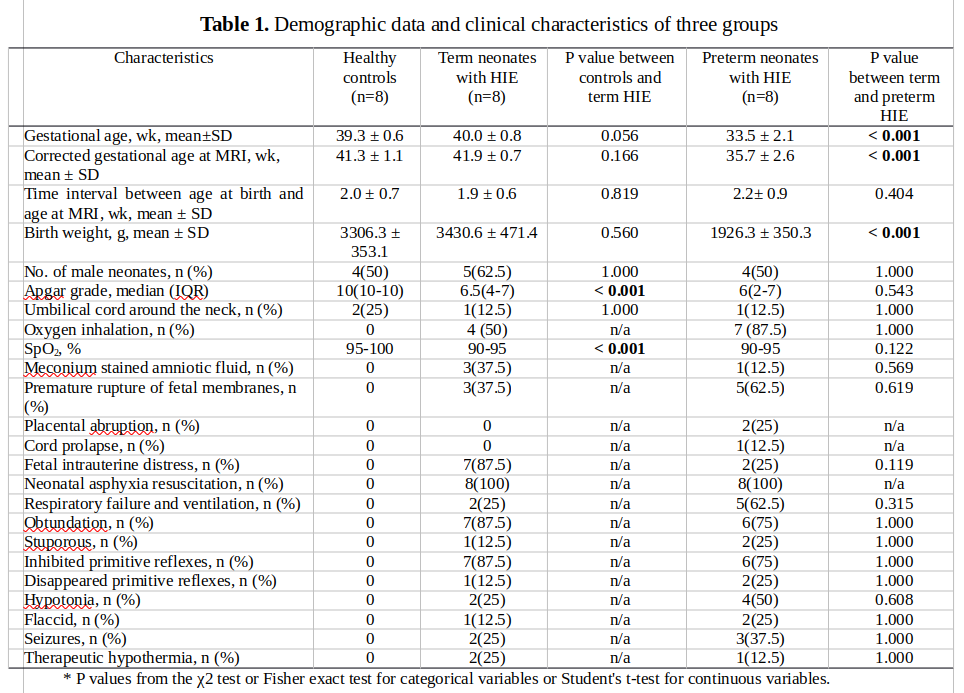
Between January 2017 and January 2018, preterm and term neonates with a clinical history of perinatal asphyxia and moderate or severe HIE that transferred to Children's hospital of Chongqing Medical University intensive care nursery were enrolled in a study evaluating the detection of brain injury by MRI, in accordance with The Code of Ethics of the World Medical Association (Declaration of Helsinki).In total, eight term neonates and eight preterm neonates who were determined to have perinatal asphyxia and moderate or severe HIE were included for further study. Eight term neonates with hyperbilirubinemia, who were free of other neonatal complications, such as congenital and chromosomal abnormalities, and with normal MRI, were recruited prospectively as healthy controls.
Brain MR images were obtained on a 3T system (Philips Achieva) using an 8-channel SENSE head coil. Data for QSM were collected using a three dimensional gradient-echo sequence with five echoes (TR=30ms, TE1=4.5ms, echo-spacing=5.5ms, α=17°, FOV=196×154×103mm3, acquired-voxel-size=0.50×0.5×1.0mm3, reconstructed-voxel-size=0.5×0.5×0.5mm3, scan-time=5m9s).11
QSM images were post-processed from the phase data of the multi gradient-echo scans.12 This QSM algorithm can be freely accessed at https://github.com/kamesy/QSM.m
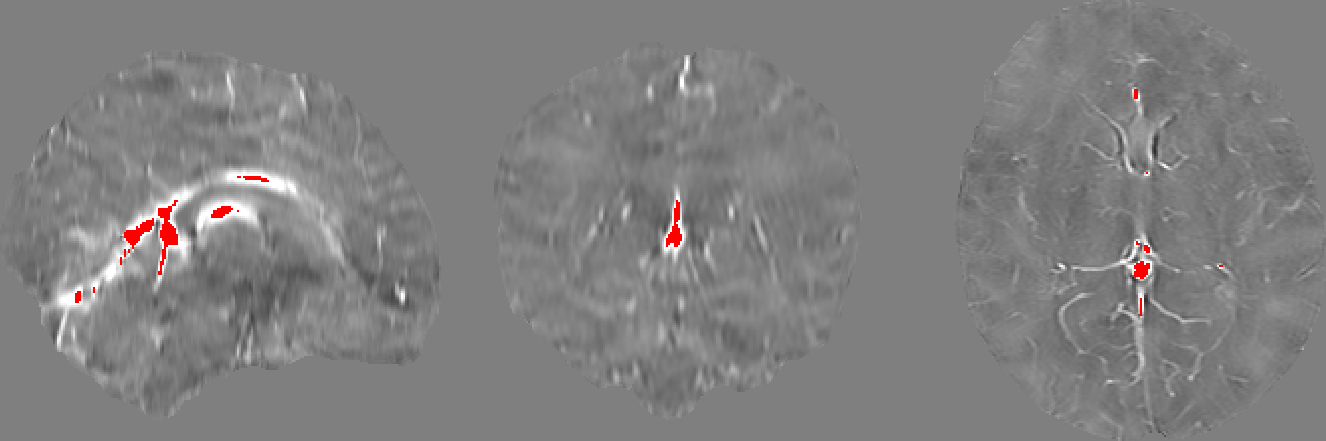
The χ of cerebral veins was measured by thresholding out the lowest 99.75% values of the whole brain. ROIs were also drawn manually on non-vein tissue by A.W. in order to calculate Δχ.
CSVO2 was calculated using the following equation:
$$Δ χ = Δ {χ} _{do} ⋅ HCT ⋅ (1 − {CS} _{V} {O} _{2})$$
The relationship between calculated CSVO2 and condition (healthy control, preterm injury, and term injury) was investigated by using a one-way ANOVA.
Results
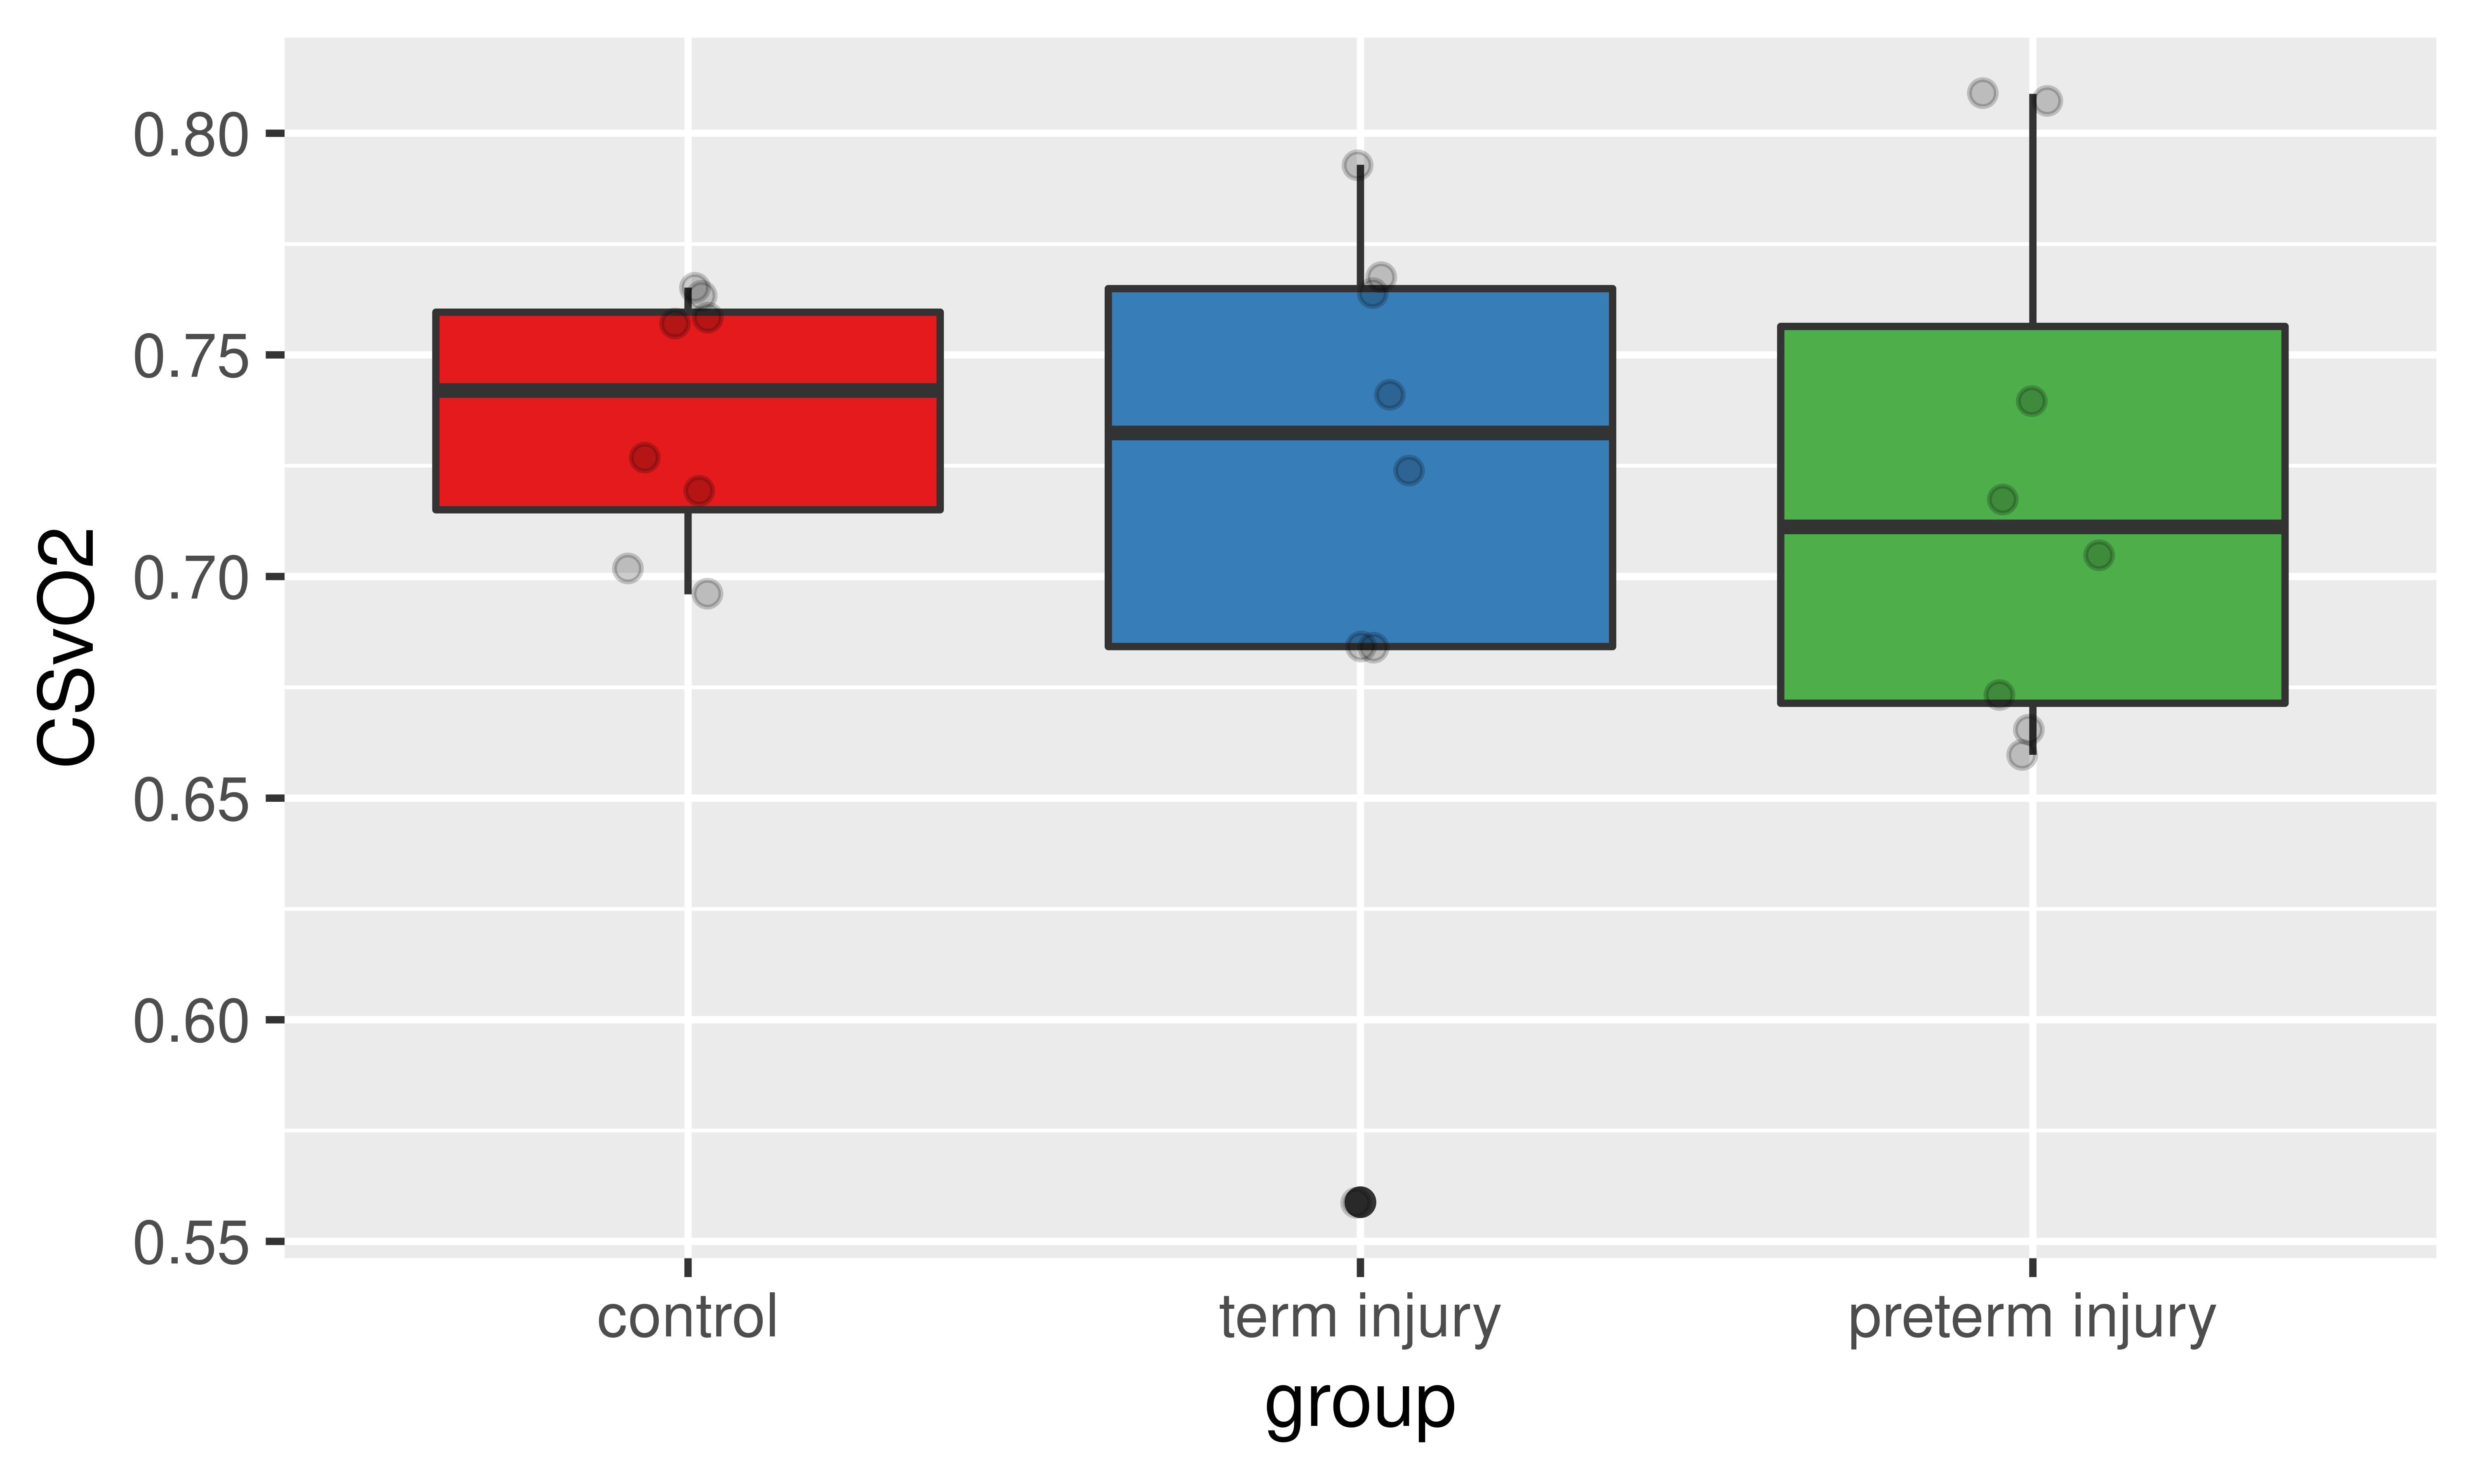
Demographic data and clinical characteristics are summarized in Table 1.Derived mean CSVO2 values were 73.6±2.8%, 71.5±7.4%, and 72.2±6.0%, respectively (Figures 1 and 2). One-way ANOVA analysis did not reveal that the condition (healthy control, preterm injury, and term injury) made a significant difference between groups (p > 0.05).
Discussion
It is of great importance to examine cerebral hemodynamic changes in neonates with moderate or severe HIE, as this may lead to a better understanding of cerebral oxygen metabolism of brain injury in HIE, and early therapeutic interventions. Although no statistical difference in CSVO2 values were found between healthy term controls, and preterm and term infants with moderate or severe HIE. To the best of our knowledge, this is one of the first studies measuring CSVO2 using QSM in healthy term neonates, as well as the first to do so in term and preterm neonates with moderate or severe HIE. Thus, our reported values for healthy newborns, as well as injured preterm and term neonates, may be used in future studies for comparison purposes.One reason we did not see differences in CSVO2 between groups could be that preterm and term infants with HIE could have reduced CBF, which along with a reduced oxygen metabolism, would result in similar CSVO2 as healthy controls. Another explanation could come from the fact that our data shows premature rupture of fetal membranes in over 60% of the preterm infants, which is higher than usual. It is possible that these infants have adopted to the outside world and have CSVO2 values closer to term infants.
Conclusion
In conclusion, we were able to measure CSVO2 in internal cerebral veins in healthy term, preterm, and term injured neonates. These values agree well with previously reported values in the literature. However, we did not see a difference in CSVO2, despite the presence of HIE in the term injured and preterm infants. More studies should be done on preterm and term infants with moderate or severe HIE, while acquiring other brain oxygen metrics such as CBF and CSAO2, along with cognitive metrics as the infants develop later in life.Acknowledgements
A.M.W. was supported by a British Columbia Children’s Hospital Research Institute – M.I.N.D. Postdoctoral Fellowship. A.R. is supported by Canada Research Chairs, and a Natural Sciences and Engineering Council of Canada (NSERC) award (402039‐2011, RGPIN‐2016‐05371).References
1. Kurinczuk JJ, White-Koning M, Badawi N. Epidemiology of neonatal encephalopathy and hypoxic-ischaemic encephalopathy. Early Hum Dev. 2010;86(6):329-338. doi:10.1016/j.earlhumdev.2010.05.010
2. Bryce J, Boschi-Pinto C, Shibuya K, Black RE. WHO estimates of the causes of death in children. The Lancet. 2005;365(9465):1147-1152. doi:10.1016/S0140-6736(05)71877-8
3. Chalak LF, Rollins N, Morriss MC, Brion LP, Heyne R, Sánchez PJ. Perinatal acidosis and hypoxic-ischemic encephalopathy in preterm infants of 33 to 35 weeks’ gestation. J Pediatr. 2012;160(3):388-394. doi:10.1016/j.jpeds.2011.09.001
4. Logitharajah P, Rutherford MA, Cowan FM. Hypoxic-ischemic encephalopathy in preterm infants: antecedent factors, brain imaging, and outcome. Pediatr Res. 2009;66(2):222-229. doi:10.1203/PDR.0b013e3181a9ef34
5. Laptook AR. Birth Asphyxia and Hypoxic-Ischemic Brain Injury in the Preterm Infant. Clin Perinatol. 2016;43(3):529-545. doi:10.1016/j.clp.2016.04.010
6. Salhab WA, Perlman JM. Severe fetal acidemia and subsequent neonatal encephalopathy in the larger premature infant. Pediatr Neurol. 2005;32(1):25-29. doi:10.1016/j.pediatrneurol.2004.06.016
7. Shmueli K, de Zwart JA, van Gelderen P, Li T-Q, Dodd SJ, Duyn JH. Magnetic susceptibility mapping of brain tissue in vivo using MRI phase data. Magn Reson Med. 2009;62(6):1510-1522. doi:10.1002/mrm.22135
8. Deistung A, Schweser F, Reichenbach JR. Overview of quantitative susceptibility mapping. NMR Biomed. 2017;30(4). doi:10.1002/nbm.3569
9. Haacke EM, Xu Y, Cheng Y-CN, Reichenbach JR. Susceptibility weighted imaging (SWI). Magnetic Resonance in Medicine. 2004;52(3):612-618. doi:10.1002/mrm.20198
10. Denk C, Rauscher A. Susceptibility weighted imaging with multiple echoes. J Magn Reson Imaging. 2010;31(1):185-191. doi:10.1002/jmri.21995
11. Zhang Y, Rauscher A, Kames C, Weber AM. Quantitative Analysis of Punctate White Matter Lesions in Neonates Using Quantitative Susceptibility Mapping and R2* Relaxation. AJNR Am J Neuroradiol. 2019;40(7):1221-1226. doi:10.3174/ajnr.A6114
12. Kames C, Wiggermann V, Rauscher A. Rapid two-step dipole inversion for susceptibility mapping with sparsity priors. Neuroimage. 2018;167:276-283. doi:10.1016/j.neuroimage.2017.11.018
Figures