3989
Separation of positive and negative susceptibility contrast at 7 Tesla allows for a more detailed characterization of multiple sclerosis lesions1Division of Medical Physics in Radiology, German Cancer Research Center (DKFZ), Heidelberg, Germany, 2Faculty of Physics and Astronomy, University of Heidelberg, Heidelberg, Germany, 3Division Radiology, German Cancer Research Center (DKFZ), Heidelberg, Germany
Synopsis
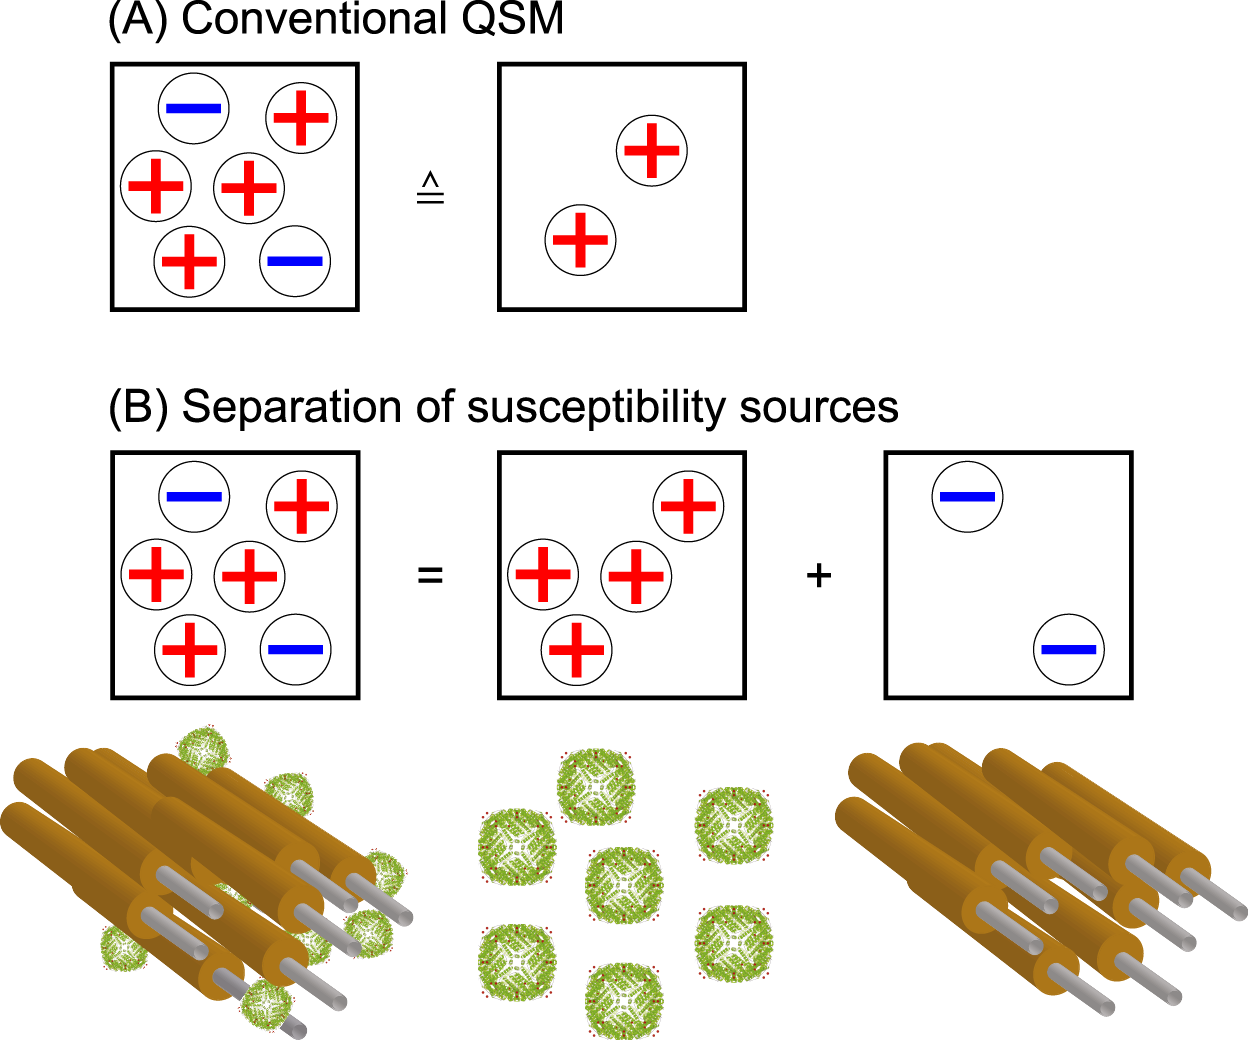
Quantitative susceptibility mapping (QSM) is known for its usefulness in imaging multiple sclerosis lesions. However, the co-occurrence of demyelination and iron accumulation due to the underlying inflammatory processes limit QSM from truthfully representing histology-like information as phase effects from positive and negative susceptibility sources within the same voxel cancel out in QSM. Here, it is shown that the separation of positive and negative susceptibility sources provides additional information to characterize susceptibility lesions.
Introduction
The contrast in quantitative susceptibility mapping is affected by tissue substructure and governed by sub-voxel compounds such as iron and myelin in the human brain1. In multiple sclerosis (MS) lesions, these substances occur co-located within the same voxel due to multiple processes such as demyelination and iron accumulation occurring simultaneously. In various studies, the usefulness of QSM to characterize MS lesions has been shown2,3,4. Based on Ref. 5, a method for the separation of susceptibility sources was developed and applied in clinical MS-patients.Methods
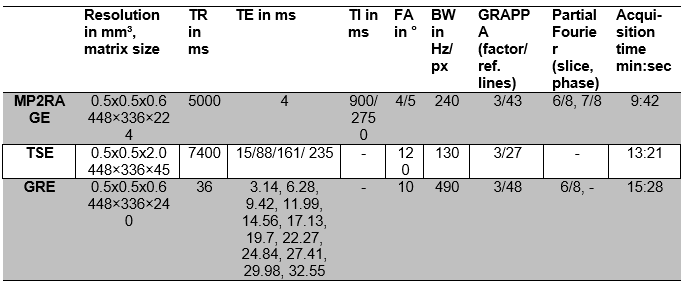
Three patients (mean age 47.7±7.8 years, two female) who provided written informed consent were chosen from a larger MS patient cohort that was measured in accordance with the Declaration of Helsinki. For each scan a clinical reference scan at 1.5 T or 3 T was performed. Data was acquired at a 7 Tesla whole-body system (Magnetom 7 Tesla, Siemens Healthinieers) with a 8Tx/32Rx-channel head coil (Nova Medical Inc., Wakefield, MA, USA). Single-channel data were combined on the scanner using the computationally efficient combination of multi-channel phase data from multi-echo acquisitions (ASPIRE)6, and each echo was unwrapped with Laplacian-based phase unwrapping7-9. On each echo of the gradient echo data, a brain mask was generated with FSL Brain Extraction Tool10, and background filed removal was performed with the variable-kernel sophisticated harmonic artifact reduction for phase data (V-SHARP)8,9 method, then all echoes were averaged11. The susceptibility maps were calculated from local phase data using the streaking artifact reduction for QSM (STAR-QSM) algorithm12.The separation of positive and negative susceptibility sources was performed by a joint inversion of the following equations, where $$$D_m$$$ is the so called magnitude decay kernel and $$$d_p$$$ is a unit dipole:
$$\Delta R_2^*= D_m \cdot (|\chi^+|+|\chi^-|) $$
$$\phi = d_p \cdot ((\chi^++\chi^-) $$
Solving the equations was performed using an in-house developed iterative algorithm based in the MEDI-algorithm13 with a physical prior 10. All lesions were labeled manually for each patient and each measurement using the T2-weighted and MP2RAGE data, and the lesion age was estimated based on the first appearance of the lesion according to previous measurements.
Results and Discussion
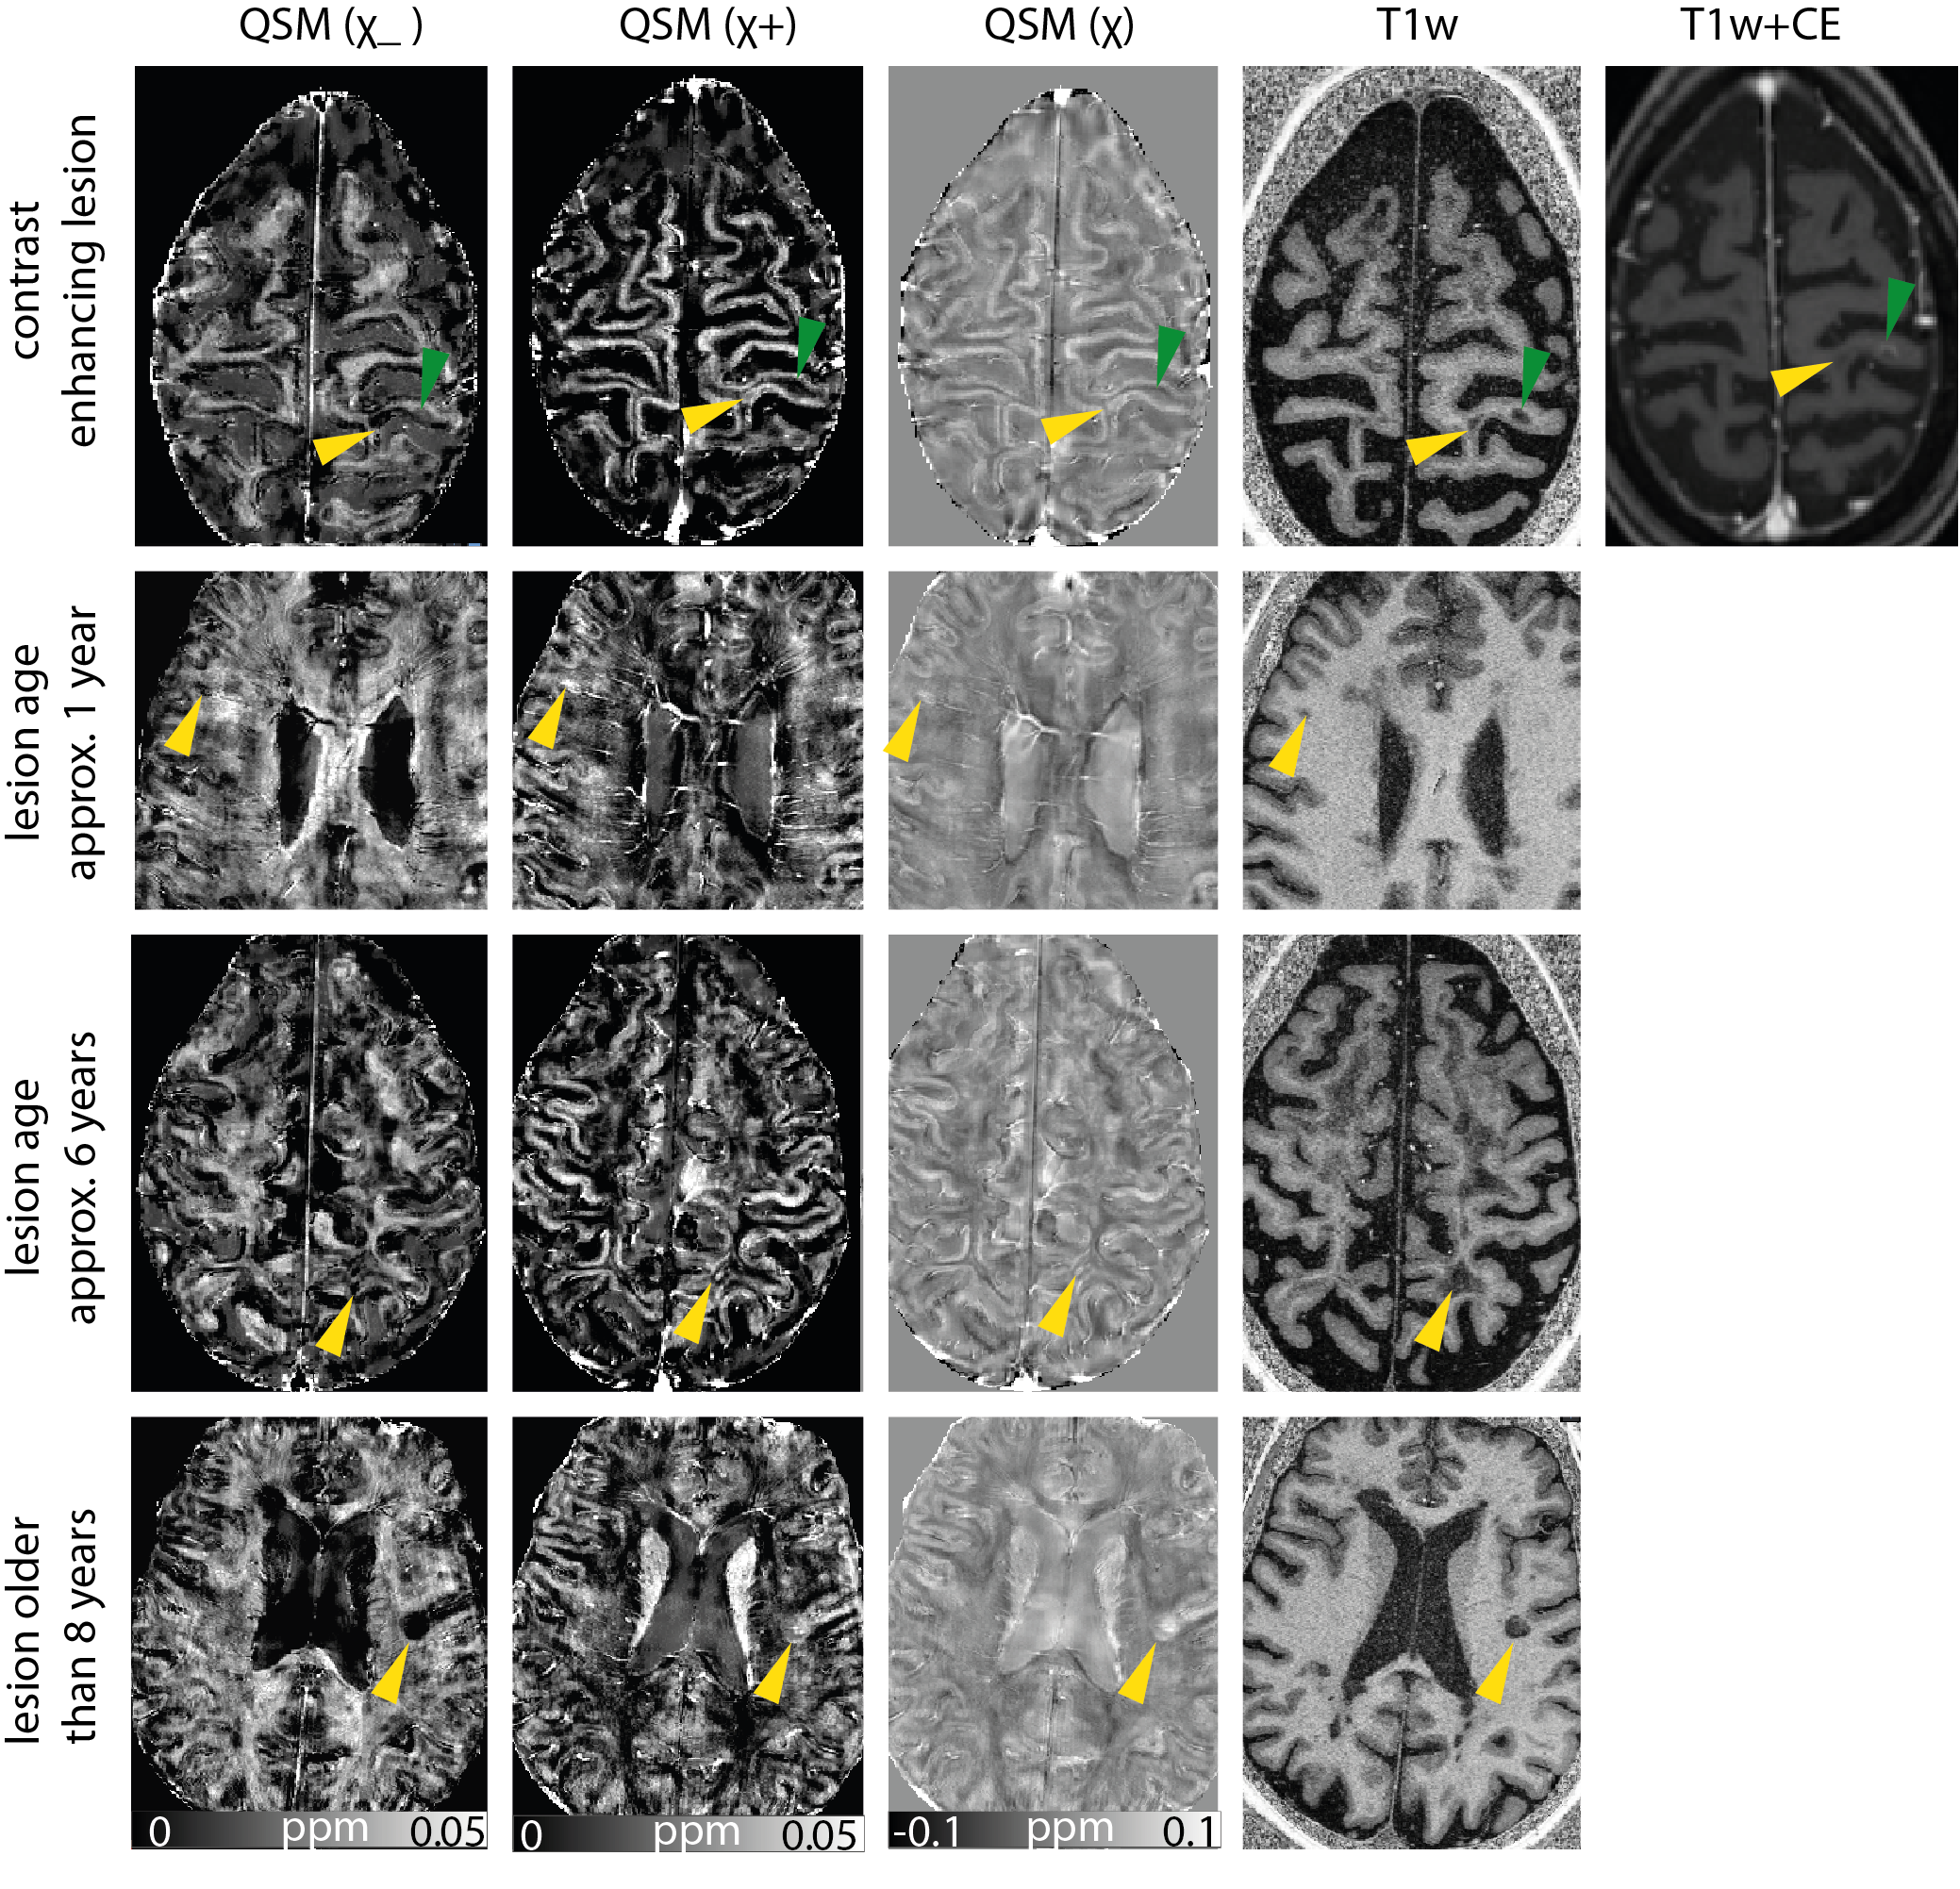
In accordacne with the findings in Ref. 2, the enhaning MS lesion (yellow arrow) in row one (Figure 2) shows little contrast with respect to its sourrounding normal appearing white matter, however, in the separated susceptibility maps, one can observe that no strong enahncement can be observed in the positve susceptibilities which suggests that no iron accumulation occured as well as a slightly decreased negative susceptibility indicating demeylination.However, compared to the adjacent non-enhaning lesion (green arrow) the loss of myelin appears less pronounced. In rows two and three, small non-enhancing lesions are shown that are between one and approximately six years old. In QSM, they show a high susceptibility, and in the separated susceptibility maps, image contrast is in accordance with strong iron accumulation and demyelination. The oldest lesion in the third row which is older than eight years, shows strong loss of myelin in the positive susceptibility map, but the contrast in the negative susceptibility maps in less pronounced and rather rim-like which has previously been shown in the literature3 for lesions on QSM.It is worth mentioning that some of the theorectial assumptions of these method are likely violated in in vivo measurements, and that the consequences of this need to be evaluated in future.Acknowledgements
The provision of the ASPIRE gradient echo sequence and corresponding ICE program for coil combination of the 7 T GRE data by Korbinian Eckstein and Simon D. Robinson is kindly acknowledged.References
1. Yablonskiy, DA. Quantitation of intrinsic magnetic susceptibility‐related effects in a tissue matrix. Phantom study. Magnetic resonance in medicine 1998;39.3 417-428.
2. Chen W, Gauthier SA, Gupta A, et al. Quantitative susceptibility mapping of multiple sclerosis lesions at various ages. Radiology. 2014;271(1):183-192. doi:10.1148/radiol.13130353.
3. Zhang Y, Gauthier SA, Gupta A, Chen W, Comunale J, Chiang GC, Zhou D, Askin G, Zhu W, Pitt D, Wang Y. Quantitative Susceptibility Mapping and R2* Measured Changes during White Matter Lesion Development in Multiple Sclerosis: Myelin Breakdown, Myelin Debris Degradation and Removal, and Iron Accumulation. AJNR Am J Neuroradiol. 2016 Sep;37(9):1629-35. doi: 10.3174/ajnr.A4825.
4. Zhang Y, Gauthier SA, Gupta A, Tu L, Comunale J, Chiang GC, Chen W, Salustri CA, Zhu W, Wang Y. Magnetic Susceptibility from Quantitative Susceptibility Mapping Can Differentiate New Enhancing from Nonenhancing Multiple Sclerosis Lesions without Gadolinium Injection. AJNR Am J Neuroradiol. 2016 Oct;37(10):1794-1799. doi: 10.3174/ajnr.A4856.
5. Lee J, Nam YH, Choi JY, Shin H, Hwang T, Lee J. Separating positive and negative susceptibility sources in QSM, Proc. Intl. Soc. Mag. Reson. Med. 2017, 25, 0751.
6. Eckstein K, Dymerska B, Bachrata B, Bogner W, Poljanc K, Trattnig S, et al. Computationally Efficient Combination of Multi-channel Phase Data From Multi-echo Acquisitions (ASPIRE). Magnet Reson Med. 2018;79(6):2996-3006.
7. Li W, Wu B, Liu CL. Quantitative susceptibility mapping of human brain reflects spatial variation in tissue composition. Neuroimage. 2011;55(4):1645-56.
8. Li W, Avram AV, Wu B, Xiao X, Liu CL. Integrated Laplacian-based phase unwrapping and background phase removal for quantitative susceptibility mapping. Nmr Biomed. 2014;27(2):219-27.
9. Wu B, Li W, Guidon A, Liu CL. Whole brain susceptibility mapping using compressed sensing. Magnet Reson Med. 2012;67(1):137-47.
10. Smith SM. Fast robust automated brain extraction. Hum Brain Mapp. 2002;17(3):143-55.
11. Wu B, Li W, Avram AV, Gho SM, Liu C. Fast and tissue-optimized mapping of magnetic susceptibility and T2* with multi-echo and multi-shot spirals. Neuroimage. 2012;59(1):297-305.
12. Wei HJ, Dibb R, Zhou Y, Sun YW, Xu JR, Wang N, et al. Streaking artifact reduction for quantitative susceptibility mapping of sources with large dynamic range. Nmr Biomed. 2015;28(10):1294-303.
13. Liu T, Liu J, de Rochefort L, Spincemaille P, Khalidov I, Ledoux JR, Wang Y. Morphology enabled dipole inversion (MEDI) from a single-angle acquisition: comparison with COSMOS in human brain imaging. Magn Reson Med. 2011 Sep;66(3):777-83. doi: 10.1002/mrm.22816.
Figures