3988
Clinical correlations of iron-rich deep grey matter of MS patients1School of Health Sciences, University of Newcastle, Newcastle, Australia, 2Hunter Medical Research Institute, Newcastle, Australia, 3CSIRO Health and Biosecurity, Brisbane, Australia, 4University of Newcastle, Newcastle, Australia, 5John Hunter Hospital, Newcastle, Australia, 6Siemens Healthcare Pty Ltd, Brisbane, Austria, 7ARC Training Centre for Innovation in Biomedical Imaging Technology, The University of Queensland, Brisbane, Australia, 8The University of Queensland, Brisbane, Australia, 9The Florey Institute of Neuroscience & Mental Health, Parkville, Australia, 10Murdoch Children's Research Institute, Royal Children's Hospital, University of Melbourne, Melbourne, Australia
Synopsis
This novel study compared quantitative magnetic susceptibility signal of deep grey matter (DGM) structures in the MS brain. We evaluated the QSM metrics in selected deep grey matter regions in 5 RRMS patients and 9 matched HCs. The STI suite software package was used for QSM image reconstruction. Compared to a reference region in HCs, a significant susceptibility change was detected in most DGM regions showing statistically significant RRMS cohort differences. QSM metrics in caudate showed strong correlations with depression scores, while pallidum and thalamus correlated significantly with anxiety. While results are limited due to small numbers, they provide the opportunity for further investigation in larger cohorts and strengthen these preliminary results.
Background
Multiple Sclerosis (MS) is a chronic neurodegenerative disease whose diagnosis and monitoring relies on conventional MRI1,2, where unfortunately the MRI biomarkers of MS are not unique to its pathophysiological substrates. Several MRI studies have shown increased iron deposition in the MS brain 3-5. MS demyelination and atrophy reduces the tissue's diamagnetic properties leading to higher tissue magnetic susceptibility 6,7. High levels of iron accumulation have been found particularly in the deep grey matter (DGM) of people with neurodegenerative diseases like MS8. Quantitative susceptibility mapping (QSM) is a novel post-processing imaging modality that quantifies tissue magnetic susceptibility using gradient-recalled-echo (GRE) sequence. Langkammer et al. showed a strong positive correlation between basal ganglia QSM values and the Expanded Disability Status Scale score among MS patients 4. A strong correlation between iron levels in the basal ganglia and fatigue scores and disease duration has been shown in people with MS (pwMS)4,5. DGM QSM values correlate with clinical parameters and may potentially have a predictive role in MS5. Our goal was to characterise the susceptibility in specific regions of interest in the DGM (in reference to medial-frontal white matter) for MS and healthy subjects. The reference region has shown no susceptibility association with age or sex in healthy subjects 9. This study also measured the correlation between QSM metrics of DGM structures and MS clinical parameters.Materials and Methods
Five MS patients diagnosed with relapsing-remitting multiple sclerosis (RRMS) according to the McDonald criteria were recruited in addition to nine age-matched healthy controls (HC)s (mean age: 46±14 yrs). All MRI/QSM were performed on a 3T scanner (Prisma, Siemens Healthcare) equipped with a 64-channel coil. Structural imaging using 3D T1-MPRAGE (TR/TE/TI=2000/3.5/1100ms, flip-angle=7°, FOV=256x256mm2, voxel size=1.0mm3). The GRE data were acquired with FOV=24×180mm2; 176slices; voxel size= 1.0mm3; TR=39ms; flip-angle=15°, seven echoes with TE1/TE7=5.84/34.58ms with TEincrement: 4.74ms. For computing QSM images, a brain mask was generated using FSL’s BET. A Laplacian-based method was used to unwrap each phase image, followed by background field elimination using vSHARP 10. The STI Suite (v2.2) 11 was used for QSM reconstruction by performing dipole inversion using iLSQR technique on each echo followed by averaging all seven QSM images to generate a single QSM image with a higher signal-to-noise ratio. The statistical analysis of regional QSM average values was performed using JASP (version:0.14). The level of significant change in QSM values associated with the regions of interest was assessed using repeated-measures ANOVA, followed by Bonferroni's corrected post-hoc tests. Additionally, correlations between clinical measurement scores and the iron-rich regions, adjusted for age, were performed using Spearman’s non-parametric correlation.Results
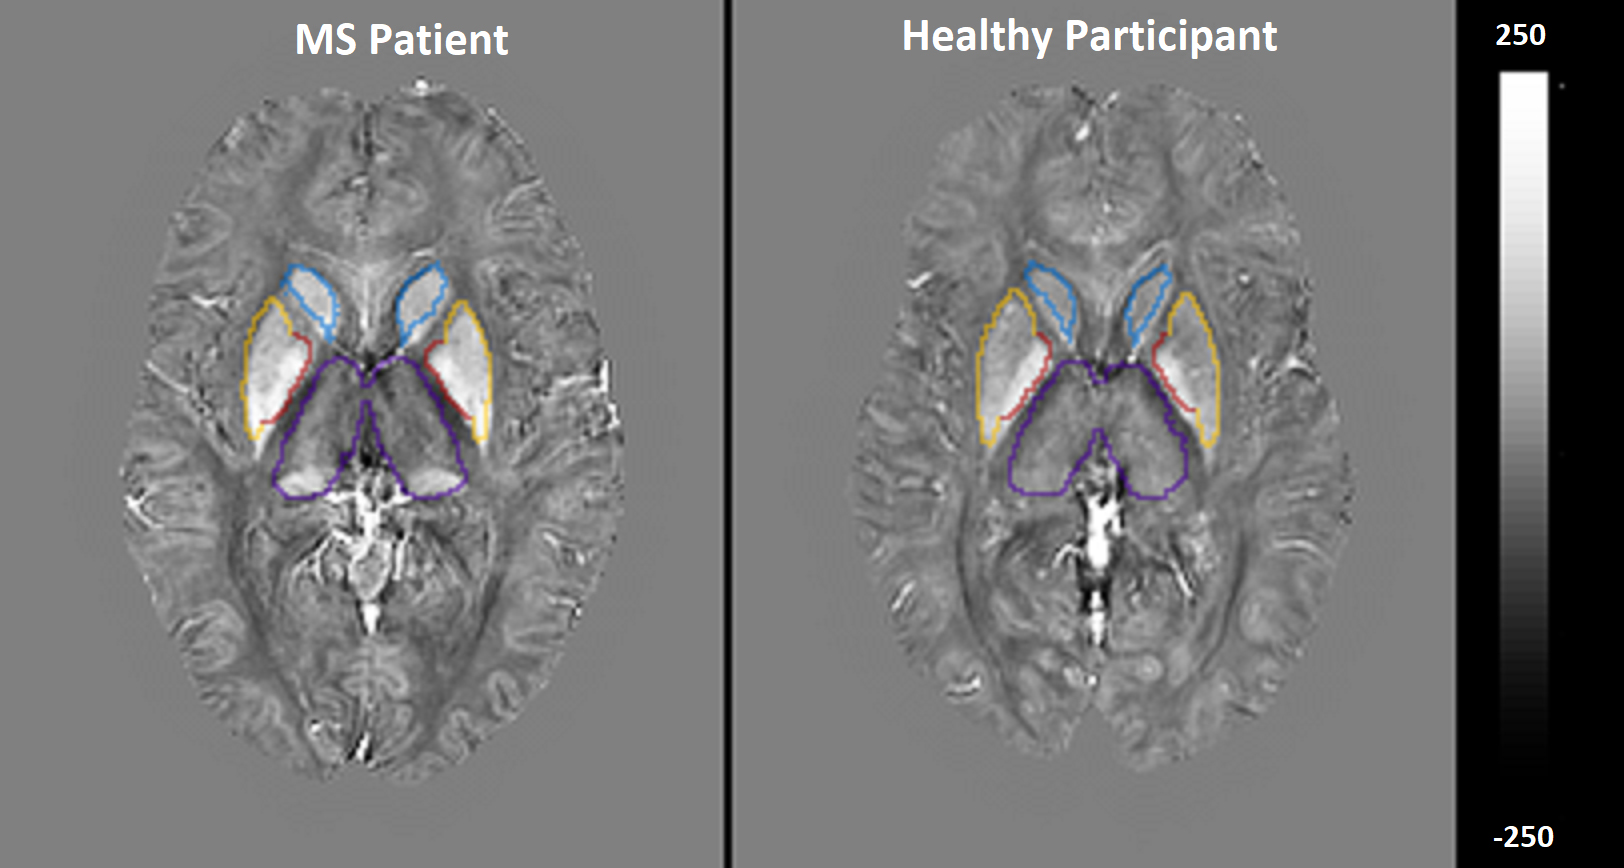
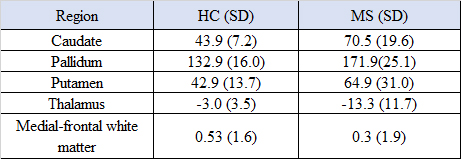
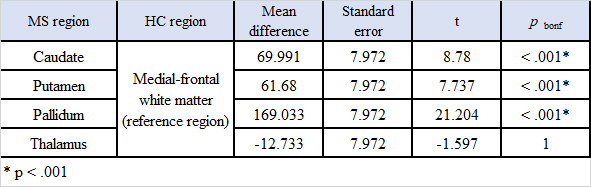
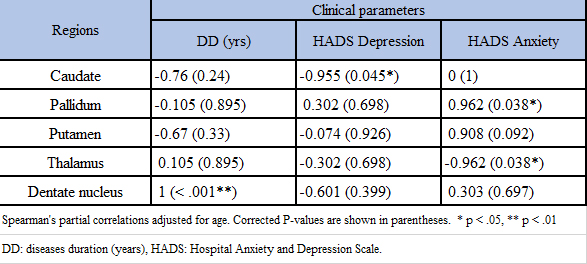
Average magnetic susceptibility (parts-per-billion; ppb) within DGM are shown in Table 1. Susceptibility mean differences between the groups in the DGM regions reached statistical significance (F-test:5.798, p<.001). RRMS showed statistically significant susceptibility changes compared to HCs when controlling for reference region, which did not differ between pwMS and HCs. Higher susceptibility was reported for MS compared to the reference region of HC in the caudate (70.5ppb; mean difference (d)=69.9; p<0.01), pallidum (171.9ppb; d=169.0; p<0.01) and putamen (64.9ppb; d =61.6; p<0.01), but not thalamus (−13.3ppb; d = −12.7; p=1 ) (Figure 1) (Table 2). For our 5 patients, we found a negative correlation between the caudate QSM signal and depression score (r=-0.955) when using the Hospital Anxiety and Depression Scale (HADS). Pallidum and thalamus QSM signal correlated significantly with anxiety (r=0.962, r=-0.962 respectively). QSM signal in the dentate nucleus region was highly correlated with the disease duration (r=1) (Table 3).Discussion
These preliminary results present novel work for assessing magnetic susceptibility variations across different DGM and their clinical correlations in RRMS. We found significantly higher magnetic susceptibilities in most DGM structures compared to age-matched HCs. QSM signal in DGM seems to be strongly correlated with depression and anxiety. There were strong negative correlations between increasing iron-richness in the caudate and depression in pwMS. These findings are consistent with several studies that confirmed interactions between depression and caudate QSM. These could be explained in different ways, e.g. decreased functional connectivity including the caudate in patients with depression 12,13. Thalamus and pallidum regions showed significant correlations with anxiety scores, which is potentially a consequence of debilitating MS symptoms 14. Many studies assessing cognition in MS also reported an association of cognitive impairment with volume reduction in the thalamus 14. Compared to other regions, the lower susceptibility in the thalamus region may come from lower paramagnetic iron components and higher diamagnetic components due to MS demyelination. This finding is consistent with other studies 4,15,16, but HADS scores had so far not yet been related to QSM metrics for MS patients adding to the novelty of our findings. While results are limited by the small numbers and sex-mismatching, they provide an incentive to investigate this method in larger cohorts to strengthen these preliminary results.Conclusion
These preliminary results using QSM in pwMS suggests neurodegenerative and neuroinflammatory processes in DGM leading to clinical symptoms. Our research supports the promising nature of QSM to investigate the contribution of iron in the pathophysiology of MS.Acknowledgements
Funding for this study provided by MS Research Australia. The authors thank the Imaging Centre of the University of Newcastle and Hunter Medical Research Institute.References
1. Rovira A, Auger C, Alonso J. Magnetic resonance monitoring of lesion evolution in multiple sclerosis. Ther Adv Neurol Disord 2013;6(5):298-310. 2. Sajja BR, Wolinsky JS, Narayana PA. Proton magnetic resonance spectroscopy in multiple sclerosis. Neuroimaging Clin N Am 2009;19(1):45-58. 3. Stuber C, Pitt D, Wang Y. Iron in Multiple Sclerosis and Its Noninvasive Imaging with Quantitative Susceptibility Mapping. Int J Mol Sci 2016;17(1). 4. Langkammer C, Liu T, Khalil M, et al. Quantitative susceptibility mapping in multiple sclerosis. Radiology 2013;267(2):551-559. 5. Schmalbrock P, Prakash RS, Schirda B, et al. Basal Ganglia Iron in Patients with Multiple Sclerosis Measured with 7T Quantitative Susceptibility Mapping Correlates with Inhibitory Control. Ajnr: American Journal of Neuroradiology 2016;37(3):439-446. 6. Zhang Y, Gauthier SA, Gupta A, et al. Quantitative Susceptibility Mapping and R2 Measured Changes during White Matter Lesion Development in Multiple Sclerosis: Myelin Breakdown, Myelin Debris Degradation and Removal, and Iron Accumulation. Ajnr: American Journal of Neuroradiology 2016;37(9):1629-1635. 7. Yao Y, Nguyen TD, Pandya S, et al. Combining Quantitative Susceptibility Mapping with Automatic Zero Reference (QSM0) and Myelin Water Fraction Imaging to Quantify Iron-Related Myelin Damage in Chronic Active MS Lesions. Ajnr: American Journal of Neuroradiology 2018;39(2):303-310. 8. Naji N, Sun H, Wilman AH. On the value of QSM from MPRAGE for segmenting and quantifying iron‐rich deep gray matter. Magnetic Resonance in Medicine 2020;84(3):1486-1500. 9. Fazlollahi A, Ayton S, Bourgeat P, et al. A normalisation framework for quantitative brain imaging; application to quantitative susceptibility mapping. 2017 IEEE 14th International Symposium on Biomedical Imaging (ISBI 2017): IEEE; 2017. p. 97-100. 10. Wu B, Li W, Guidon A, Liu C. Whole brain susceptibility mapping using compressed sensing. Magnetic resonance in medicine 2012;67(1):137-147. 11. Li W, Wu B, Liu C. STI Suite: a Software Package for Quantitative Susceptibility Imaging. Proc Intl Soc Mg Reson Med 2014;22. 12. Leech R, Sharp DJ. The role of the posterior cingulate cortex in cognition and disease. Brain 2014;137(Pt 1):12-32. 13. Stefancin P, Govindarajan ST, Krupp L, Charvet L, Duong TQ. Resting-state functional connectivity networks associated with fatigue in multiple sclerosis with early age onset. Multiple sclerosis and related disorders 2019;31:101-105. 14. Jameen A, Ribbons K, Lechner-Scott J, Ramadan S. Evaluation of MS related central fatigue using MR neuroimaging methods: scoping review. Journal of the Neurological Sciences 2019;400:52-71. 15. Zivadinov R, Tavazzi E, Bergsland N, et al. Brain iron at quantitative MRI is associated with disability in multiple sclerosis. Radiology 2018;289(2):487-496. 16. Pontillo G, Cocozza S, Lanzillo R, et al. Determinants of Deep Gray Matter Atrophy in Multiple Sclerosis: A Multimodal MRI Study. Ajnr: American Journal of Neuroradiology 2019;40(1):99-106.Figures