3987
Quantifying iron deposition in Multiple System Atrophy via multi-echo Quantitative Susceptibility Mapping1IMT School for Advanced Studies Lucca, Lucca, Italy, 2IMAGO7 Foundation, Pisa, Italy, 3IRCCS Stella Maris, Pisa, Italy, 4Department of Neuroscience, Rehabilitation, Ophtalmology, Genetics, Maternal and Child Sciences (DINOGMI), University of Genova, Genova, Italy, 5Azienda Ospedaliero-Universitaria Pisana, Pisa, Italy, 6Parkinson and Movement Disorder Unit, IRCCS Mondino Foundation, Pavia, Italy, 7Department of Biomedical and NeuroMotor Sciences, University of Bologna, Bologna, Italy, 8Clinica Neurologica, IRCCS Istituto delle Scienze Neurologiche di Bologna, Bologna, Italy
Synopsis
In this work we quantified iron deposition in gray matter nuclei in a cohort of MSA patients with parkinsonian and cerebellar phenotypes using Quantitative Susceptibility Mapping (QSM). As it captures different tissues contribution depending on TE, we performed an ROI-based histogram analysis on susceptibility maps computed at each TE of a multi-echo GRE sequence. We observed significant differences among groups in several ROIs, such as putamen, globus pallidus, caudate nucleus, substantia nigra and dentate nucleus. The area under the ROC curve was higher for short TEs suggesting that short-TE QSM enhances diagnostic performances in the presence of strong susceptibility sources.
Introduction
Multiple system atrophy (MSA) is a rare neurodegenerative disorder characterized by autonomic failure, parkinsonism and cerebellar ataxia. Clinically, depending on the prominent motor symptoms, parkinsonian (MSA-p) and cerebellar (MSA-c) phenotypes are distinguished. Previous studies reported altered susceptibility in putamina, substantia nigra, red nuclei, subthalamic nuclei and, for MSA-c, in dentate nuclei1–5. In this work we aimed to quantify iron deposition in a cohort of MSA patients of each variant and a population of healthy controls. To this purpose, we performed ROI-based histogram analysis on multi-echo Quantitative Susceptibility Mapping (QSM) images to discriminate between groups. As QSM is known to depend on TE due to the non-linear time-evolution of phase signal6–8, susceptibility maps at each TE were analyzed separately to assess whether QSM diagnostic accuracy also depends on TE in the presence of strong susceptibility sources. Here, we demonstrated increased diagnostic capability for shorter TEs, which must be taken into account when optimizing protocols.Methods
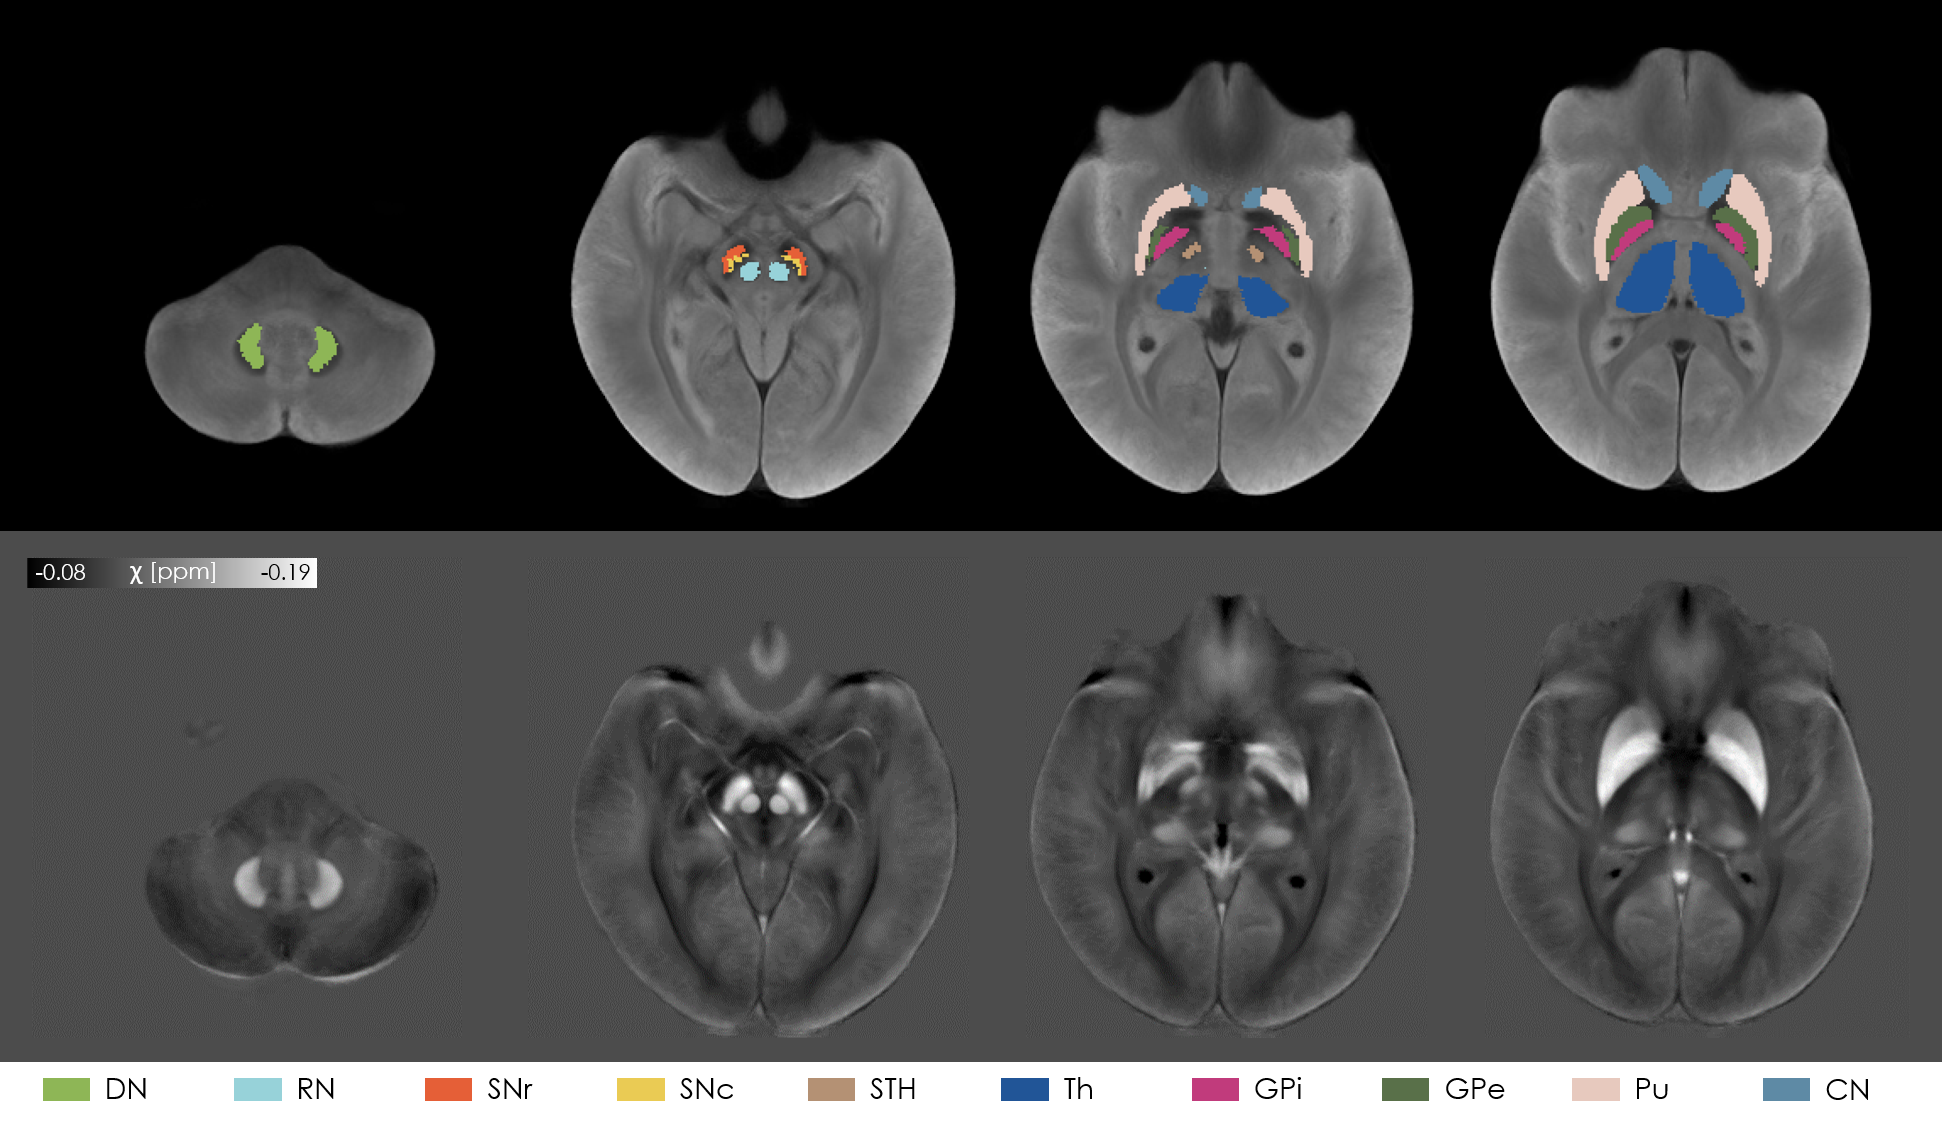
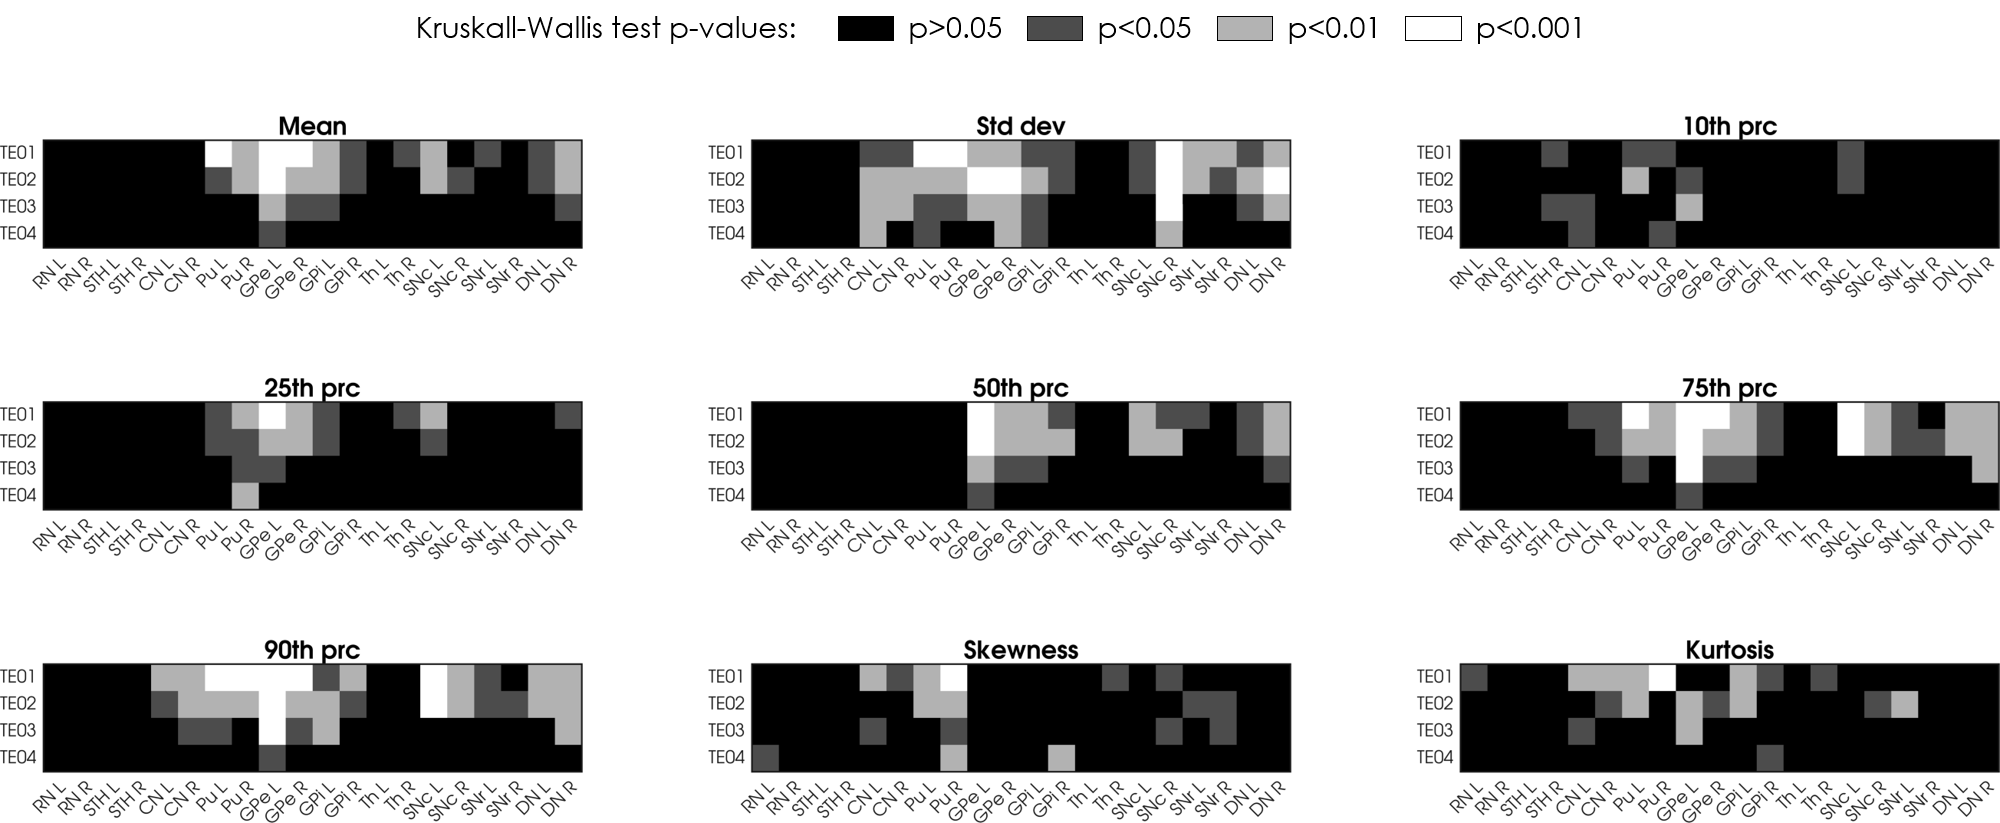
We enrolled 19 MSA-p, 13 MSA-c patients and 16 healthy controls (HC) (age range: 43-76y; 26 males). Sex and age distributions of the three populations were compared via chi-square test and independent t-test respectively. A 3D Gradient Recalled Multi-Echo sequence was acquired with whole-brain coverage on a 7T MRI scanner (GE-MR950) with the following parameters: TR=54.1ms; TE=7.4,16.4,25.3,34.3ms; spatial-resolution=0.6×0.6×1.2mm3. Susceptibility maps were computed from the phase signal of each echo using a Laplacian-based phase unwrapping algorithm9, V-SHARP background field removal10 and iLSQR algorithm for dipole deconvolution11,12, contained in STI Suite13. A study-specific template was created with ANTs14 from the magnitude image averaged across TEs of each subject. The susceptibility maps were warped to the template by applying the corresponding transformation. Ten ROIs, each divided into left and right regions, were selected from PD25 atlas15 (red nuclei (RN), subthalamic nuclei (STH), caudate nucleus (CN), putamen (Pu), globus pallidus externus (GPe) and internus (GPi), thalamus (Th)), from probabilistic CIT168 atlas16 (substantia nigra pars compacta and reticulata (SNc and SNr)), and from a probabilistic dentate nucleus (DN) atlas17. Probabilistic ROIs were thresholded to 0.5. The atlases were warped to the study-specific template using ANTs. For each ROI and for each TE we extracted the following histogram features: mean value, standard deviation, 10th/25th/50th/75th/90th percentile, kurtosis and skewness. The feature values among the three groups (MSA-p, MSA-c, HC) were compared with Kruskal-Wallis omnibus test, followed by Mann-Whitney U test and FDR correction for post-hoc analysis. Diagnostic accuracy was evaluated via the area under the curve (AUC) of the receiver operating characteristic (ROC) curve.Results
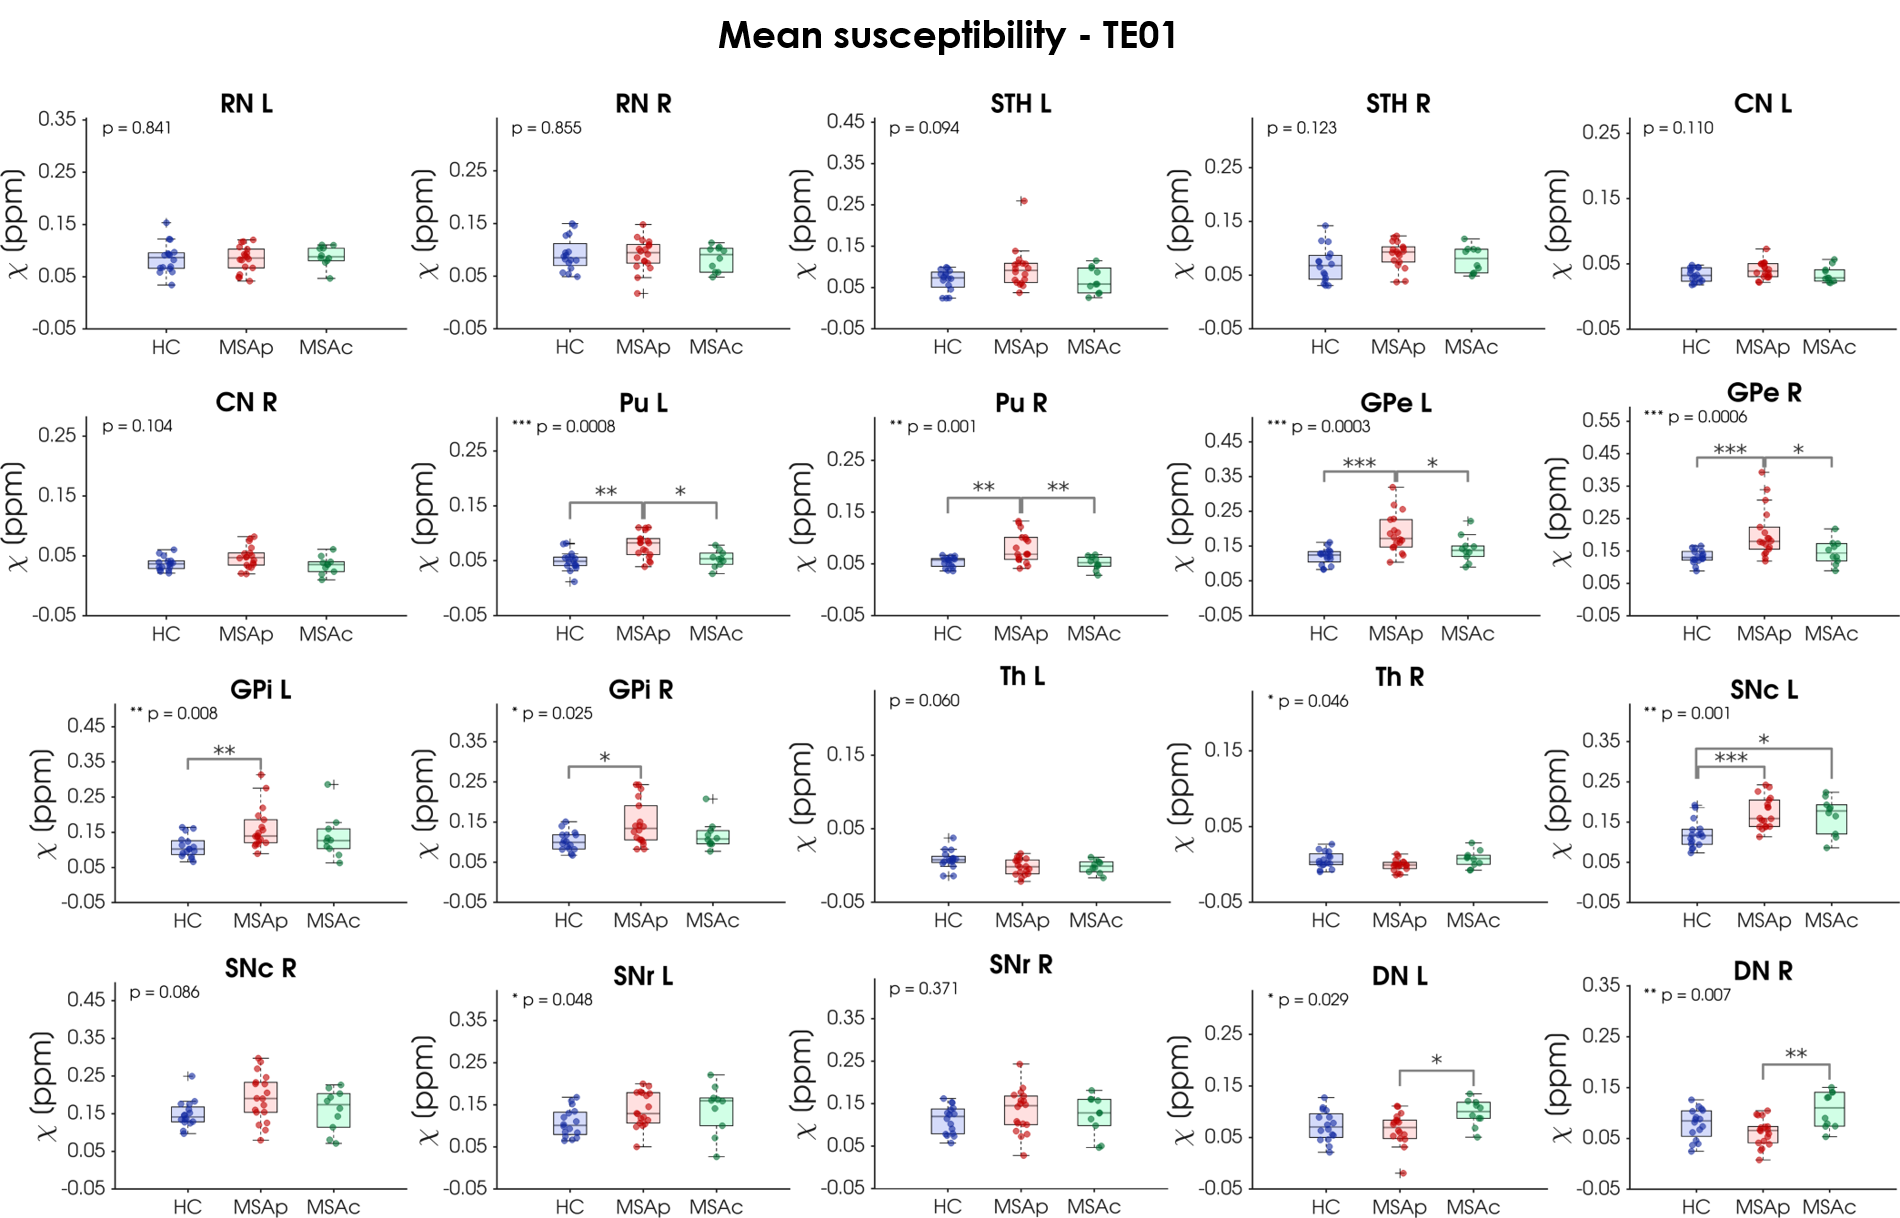
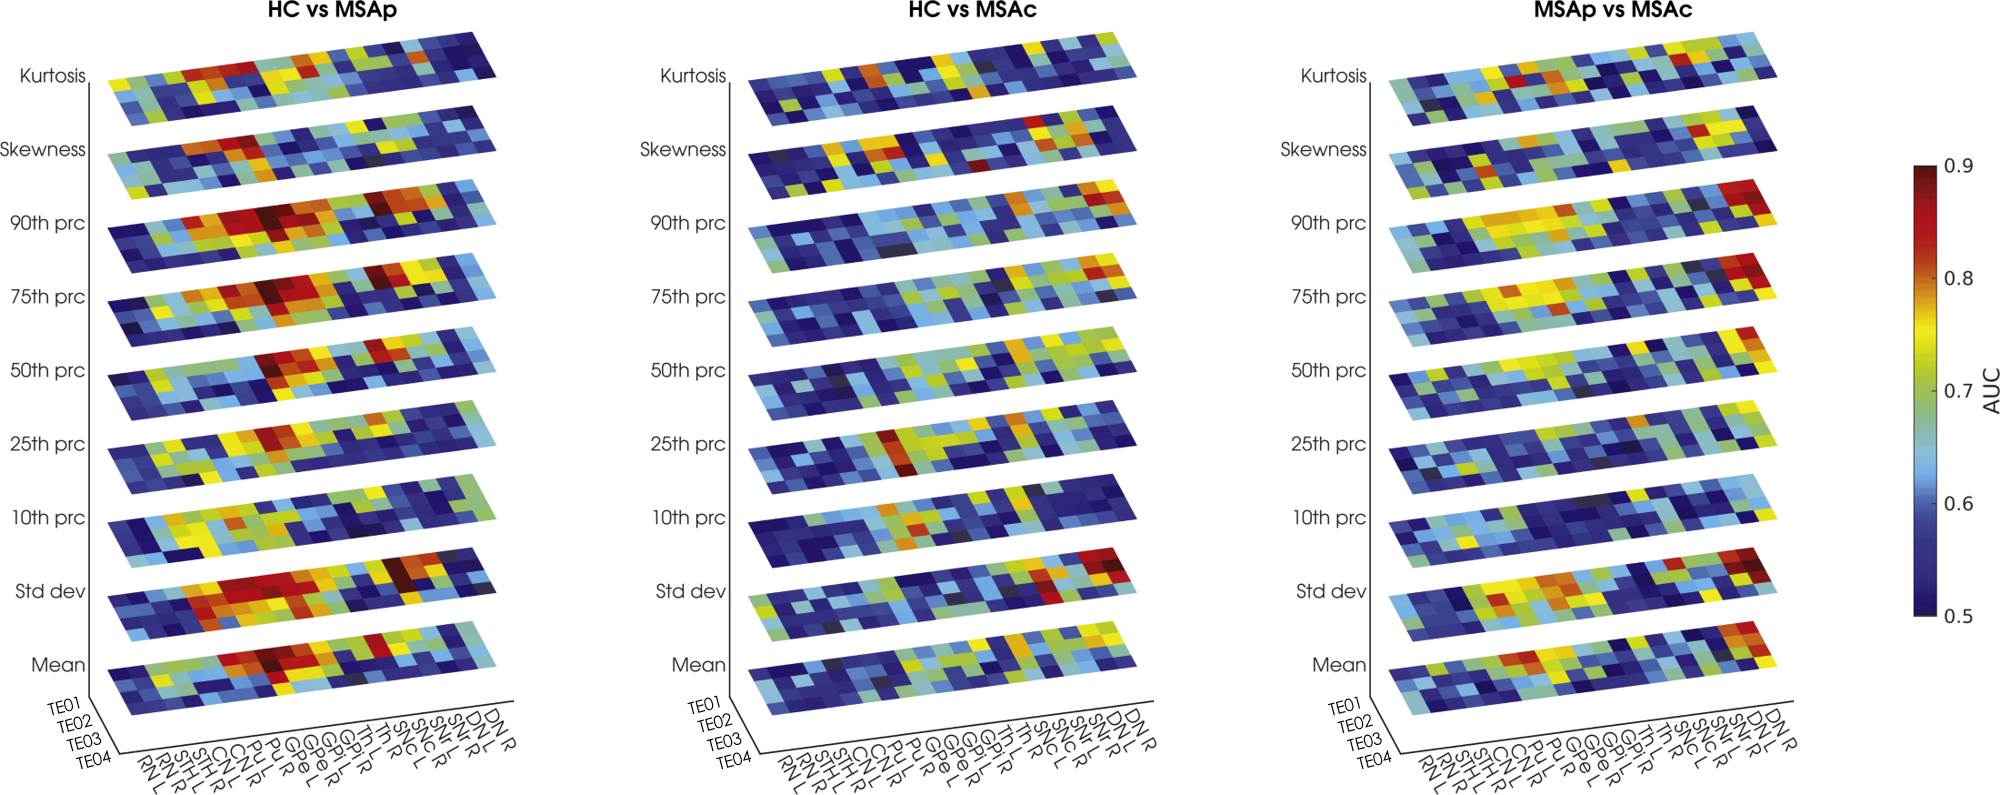
After visual inspection, 4 subjects (1 MSA-p, 3 MSA-c) were excluded due to severe motion artifacts. Age and sex were equally distributed among groups. The selected ROIs are shown in Figure 1 overlaid onto the study-specific template. The p-values obtained from the omnibus test for each ROI and each TE are reported in Figure 2. The highest level of significance is achieved for the shortest TE. According to the mean susceptibility computed in the first TE (Figure 3), MSA-p patients show higher susceptibility in Pu and GPe with respect to MSA-c and HC, and higher susceptibility in GPi with respect to HC. Increased iron deposition is reported in left SNc for both phenotypes with respect to HC while higher susceptibility is observed in DN for MSA-c with respect to MSA-p. When considering the 90th percentile and the standard deviation, significant susceptibility differences between groups were detected also in other ROIs, such as CN, SNr and right SNc (Figure 2). When the same features are extracted from maps computed at longer TEs, the difference between groups in several ROIs is reduced and does not reach significance. The AUC tends to be higher for short TEs (Figure 4) for which excellent diagnostic accuracy (up to 0.93) is achieved. The susceptibility maps computed from the first two TEs provide the highest diagnostic accuracy overall. The mean, the standard deviation the 90th percentile yield the highest accuracy.Discussion
In this study we performed an ROI-based analysis targeting deep gray matter structures and explored the diagnostic performances of a set of histogram features extracted by susceptibility maps computed at different TE. Importantly, at short TE we observed significantly increased iron deposition in MSA patients with respect to HC in several ROIs, including Pu, SN, DN and also GP and CN, that were not reported in previous studies. This may be due to the longer TE sometimes used in QSM protocols which may not capture the rapidly decaying contribution of strong susceptibility source and should be considered when planning clinical protocols. Excellent diagnostic accuracy in discriminating patients from controls and between phenotypes either with QSM mean and with standard deviation or 90th percentile. This may reflect the non-uniform spatial distribution of iron deposition in some regions1 and texture analysis may provide useful information.Conclusion
We demonstrated that the use of short TEs enhances the diagnostic performances of QSM, improving its capability in detecting altered iron deposition in several deep gray matter nuclei. Notably, it allowed the detection of significant susceptibility increase in previously unreported ROIs. Then, a targeted choice of TE can increase QSM importance in the differential diagnosis of neurodegenerative diseases.Acknowledgements
This study was supported by the Italian Ministry of Health (RF-2016-02361597, “Prognostic predictive value of autonomic markers during sleep and wakefulness in multiple system atrophy: a neurophysiological and neuroimaging study”).References
1. Ito K, Ohtsuka C, Yoshioka K, et al. Differential diagnosis of parkinsonism by a combined use of diffusion kurtosis imaging and quantitative susceptibility mapping. Neuroradiology. 2017;59(8):759-769. doi:10.1007/s00234-017-1870-7
2. Sjöström H, Granberg T, Westman E, Svenningsson P. Quantitative susceptibility mapping differentiates between parkinsonian disorders. Park Relat Disord. 2017;44:51-57. doi:10.1016/j.parkreldis.2017.08.029
3. Mazzucchi S, Frosini D, Costagli M, et al. Quantitative susceptibility mapping in atypical Parkinsonisms. NeuroImage Clin. 2019;24:101999. doi:10.1016/j.nicl.2019.101999
4. Wang EW, Du G, Lewis MM, et al. Multimodal MRI evaluation of parkinsonian limbic pathologies. Neurobiol Aging. 2019;76:194-200. doi:10.1016/j.neurobiolaging.2019.01.004
5. Sugiyama A, Sato N, Kimura Y, et al. Quantifying iron deposition in the cerebellar subtype of multiple system atrophy and spinocerebellar ataxia type 6 by quantitative susceptibility mapping. J Neurol Sci. 2019;407:116525. doi:10.1016/j.jns.2019.116525
6. Cronin MJ, Wang N, Decker KS, Wei H, Zhu W-Z, Liu C. Exploring the origins of echo-time-dependent quantitative susceptibility mapping (QSM) measurements in healthy tissue and cerebral microbleeds. Neuroimage. 2017;149:98-113. doi:10.1016/j.neuroimage.2017.01.053
7. Sood S, Urriola J, Reutens D, et al. Echo time-dependent quantitative susceptibility mapping contains information on tissue properties. Magn Reson Med. 2017;77(5):1946-1958. doi:10.1002/mrm.26281
8. Lancione M, Donatelli G, Cecchi P, Cosottini M, Tosetti M, Costagli M. Echo-time dependency of quantitative susceptibility mapping reproducibility at different magnetic field strengths. Neuroimage. 2019;197:557-564. doi:10.1016/j.neuroimage.2019.05.004
9. Li W, Avram A V, Wu B, Xiao X, Liu C. Integrated Laplacian-based phase unwrapping and background phase removal for quantitative susceptibility mapping. NMR Biomed. 2014;27(2):219-227. doi:10.1002/nbm.3056
10. Schweser F, Deistung A, Lehr BW, Reichenbach JR. Quantitative imaging of intrinsic magnetic tissue properties using MRI signal phase: an approach to in vivo brain iron metabolism? Neuroimage. 2011;54(4):2789-2807. doi:10.1016/j.neuroimage.2010.10.070
11. Li W, Wu B, Liu C. Quantitative susceptibility mapping of human brain reflects spatial variation in tissue composition. Neuroimage. 2011;55(4):1645-1656. doi:10.1016/j.neuroimage.2010.11.088
12. Li W, Wang N, Yu F, et al. A method for estimating and removing streaking artifacts in quantitative susceptibility mapping. Neuroimage. 2015;108:111-122. doi:10.1016/j.neuroimage.2014.12.043
13. Liu C. STI Suite. https://people.eecs.berkeley.edu/~chunlei.liu/software.htm
14. Avants BB, Tustison NJ, Song G, Cook PA, Klein A, Gee JC. A reproducible evaluation of ANTs similarity metric performance in brain image registration. Neuroimage. 2011;54(3):2033-2044. doi:10.1016/j.neuroimage.2010.09.025
15. Xiao Y, Fonov V, Chakravarty MM, et al. A dataset of multi-contrast population-averaged brain MRI atlases of a Parkinson׳s disease cohort. Data Br. 2017;12:370-379. doi:10.1016/j.dib.2017.04.013
16. Pauli WM, Nili AN, Tyszka & JM. Data Descriptor: A high-resolution probabilistic in vivo atlas of human subcortical brain nuclei Background & Summary. Published online 2018. doi:10.1038/sdata.2018.63
17. He N, Langley J, Huddleston DE, et al. Improved Neuroimaging Atlas of the Dentate Nucleus. Cerebellum. 2017;16(5-6):951-956. doi:10.1007/s12311-017-0872-7
Figures