3986
Prediction of Amyloid-β Deposition Using Multiple Regression Analysis of Quantitative Susceptibility Mapping1Healthcare Business Unit, Hitachi, Ltd., Tokyo, Japan, 2Department of Diagnostic Imaging, Hokkaido University Graduate School of Medicine, Hokkaido, Japan, 3Department of Psychiatry, Hokkaido University Graduate School of Medicine, Hokkaido, Japan, 4Department of Neurology, Faculty of Medicine and Graduate School of Medicine, Hokkaido University, Hokkaido, Japan, 5Institute for Biomedical Sciences, Iwate Medical University, Iwate, Japan, 6Department of Radiology, Tokushima University, Tokushima, Japan, 7Department of Neurology, Nagoya City University, Aichi, Japan
Synopsis
For early diagnosis of Alzheimer’s disease, we created and evaluated a prediction method of amyloid β deposition based on multiple regression analysis of quantitative susceptibility mapping. A multiple regression model to predict standard uptake values (SUVs) of amyloid PET was constructed based on susceptibilities in 47 brain regions with the constraint Aβ deposition and susceptibility being positively correlated. The correlation coefficients between true and predicted SUVs were increased by incorporating the constraint, and the area under the receiver operating characteristics curve to predict Aβ positivity was 70%. The results suggest that the model could predict Aβ positivity at moderate accuracy.
Introduction
Early diagnosis of Alzheimer's disease is important for appropriate treatment to slow cognitive decline and to reduce symptoms. Amyloid positron emission tomography (PET) can detect accumulation of amyloid-β (Aβ) in the early stages of Alzheimer's disease, but it is not widely available due to its high cost and radiation exposure. Iron may be a surrogate marker of Aβ because several histological studies revealed iron deposition in Aβ plaques 1. Quantitative susceptibility mapping (QSM) has been found to correlate positively with the standard uptake values (SUVs) of amyloid PET 2. In this study, we investigated a method for predicting Aβ accumulation using MRI on the basis of the relationship between QSM and amyloid PET images.Methods
The susceptibilities and SUVs of 47 brain regions were calculated from QSM and amyloid PET images, respectively, and a multiple regression model was created and evaluated to predict Aβ deposition from susceptibilities in multiple brain regions.MRI and PET protocols
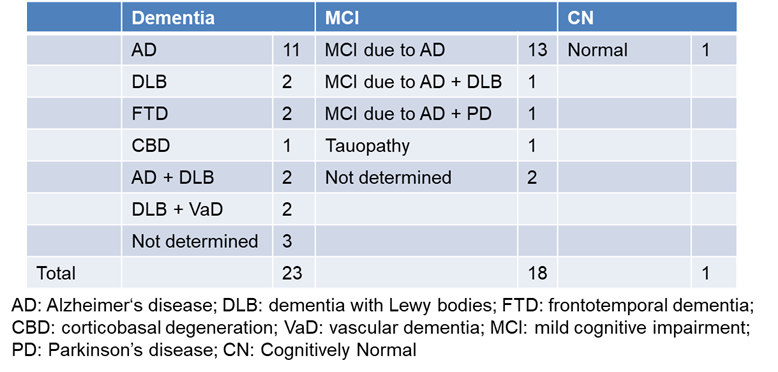
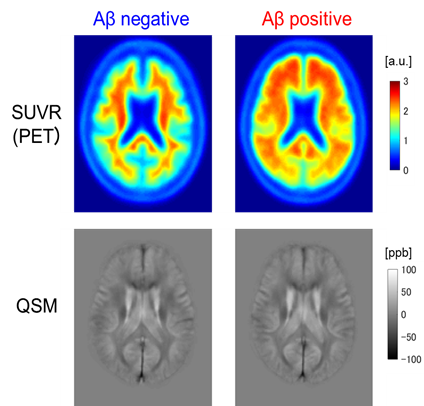
Forty-two patients were recruited in four centers, and the study protocol was approved by the institutional review boards of the four centers and Hitachi, Ltd. The clinical diagnoses based on the Diagnostic and Statistical Manual of Mental Disorders, 5th edition (DSM-5) were as follows: 23 dementia cases, 18 mild cognitive impairment (MCI) cases, and one cognitively normal (CN) case (Table 1). MRI was performed using 3-T scanners (Hitachi, Ltd.). The scan parameters were as follows. Sequence: RF-spoiled gradient echo; TR: 38 ms; TE: 4.3, 9.6, 14.9, 20.2, 25.5, and 30.8ms; FA: 45 degrees; FOV: 240×192×200 mm; voxel size: 0.7×0.8×2.0 mm; and scan time: 4 min 48 sec. Amyloid PET imaging was performed using 18F-flutemetamol and four types of scanners: Discovery ST Elite, Discovery PET/CT610, Discovery PET/CT710 (GE Healthcare), or mCT40 (Siemens Healthineers). On the basis of the amyloid PET images, 22 patients were Aβ negative, and 20 patients were Aβ positive (Figure 1).
Image processing
QSM images were reconstructed using a brain-surface correction method, in which constrained regularization enabled sophisticated harmonic artifact reduction for phase data (RESHARP) 3 was implemented with a brain-surface background field calculated by local polynomial approximation 4. Both QSM and PET images were spatially normalized 5, and the region of interest analysis was conducted using an automated anatomical labeling atlas 6,7. The cerebellar cortex was used to calculate the relative values of SUV (SUVRs) for PET. After 94 supratentorial regions in the atlas were averaged between left and right, susceptibilities and SUVRs were obtained for 47 regions.
Multiple regression analysis
A prediction model for SUVRs was created from the susceptibilities in multiple regions as follows;
$$y=\alpha_0+\sum^{N_{ROI}}_i{\alpha_i}{x_i},$$
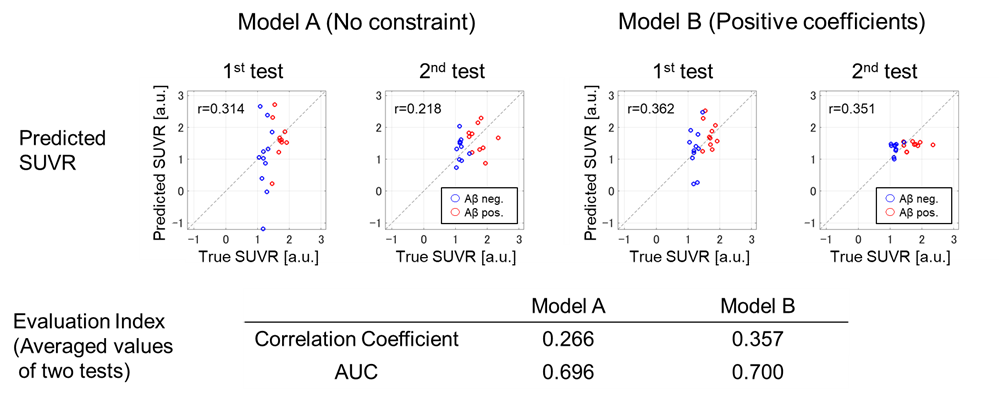
where y is the averaged SUVR of 47 regions, xi is the susceptibility of each region normalized to the z-score, αi is a coefficient, and NROI is the number of regions selected from 47 regions. To determine the variables (regions) used in the equation, we applied the forward-backward stepwise selection procedure based on the Akaike information criterion (AIC). In the procedure, adding and removing processes are repeated from the simplest equation (y = α0) until the AIC becomes a minimum (the maximum number of processes was set to 15). Additionally, on the basis of the findings that susceptibility and Aβ were positively correlated 2, a constraint was added to the aforementioned selection procedure in which the adding or removing process was conducted only when all coefficients (αi) were positive. The effects of the constraint were evaluated by comparing the prediction accuracy between two models ((A) without and (B) with constraint).
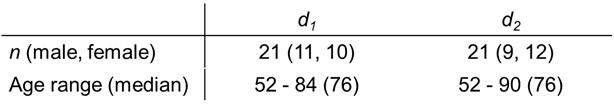
The evaluation was performed based on two-fold cross validation. Forty-two patients were divided into two groups (d1 and d2,Table 2) in accordance with their acquiring date or patient number in each site. The prediction accuracy was assessed using correlation coefficients (between true and predicted SUVR) and the area under the receiver operating characteristic curve (in the discrimination of Aβ negative or positive based on predicted SUVRs) (AUC). These values were evaluated as the average of two tests.
Results and discussion
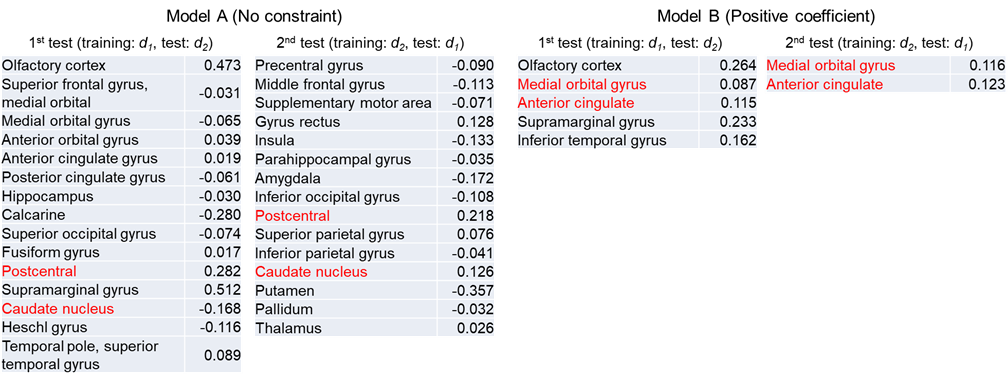
As shown in Table 3, many regions were selected for model A (without constraint), and these regions did not overlap (excluding postcentral and caudate nucleus) in the two tests, indicating that the model could not robustly select the suitable regions. On the other hand, five or two regions were selected for model B (with constraint), and the two regions (medial orbital gyrus and anterior cingulate) reported in previous studies 2,8 overlapped in the two tests. This result suggests that the constraint of positive correlation enabled robust prediction. As shown in Figure 2, the correlation coefficient (0.357) in model B was larger than that of model A (0.266), and the AUC in model B was 0.70. These results suggest that the moderate prediction accuracy of Aβ deposition was achieved by the multiple regression analysis of QSM with the constraint of positive correlation.Conclusions
We created and evaluated a prediction model of Aβ deposition based on multiple regression analysis of QSM. The results suggest that the model could predict Aβ positivity at moderate accuracy.Acknowledgements
This research was supported by AMED under Grant Number JP18he1402002.References
1. Falangola MF, et al. Histological co-localization of iron in Abeta plaques of PS/APP transgenic mice. Neurochem Res 2005;30:201.
2. van Bergen JM, et al., Colocalization of cerebral iron with amyloid beta in mild cognitive impairment. Sci Rep 2016;6:35514.
3. Sun H and Wilman AH, Background field removal using spherical mean value filtering and Tikhonov regularization. Magn Reson Med 2014;71:1151.
4. Shirai T, et al., Whole brain background field removal using spherical mean value filtering and local polynomial approximation for quantitative susceptibility mapping. Proc ISMRM 2018;4990.
5. Ashburner J, A fast diffeomorphic image registration algorithm. Neuroimage 2007;38:95.
6. Tzourio-Mazoyer N, et al. Automated anatomical labeling of activations in SPM using a macroscopic anatomical parcellation of the MNI MRI single-subject brain. NeuroImage 2002;15:273.
7. Rolls ET, et al., Implementation of a new parcellation of the orbitofrontal cortex in the automated anatomical labeling atlas. Neuroimage. 2015;122:1.
8. Palmqvist S, et al., Earliest accumulation of beta-amyloid occurs within the default-mode network and concurrently affects brain connectivity. Nat Commun 2017;8:1214.
Figures