3985
Quantitative susceptibility mapping MRI of brain iron and PET of β-amyloid predict cognitive decline during aging
Lin Chen1,2, Anja Soldan3, Kenichi Oishi1, Andreia Faria1, Marilyn Albert3, Peter van Zijl1,2, and Xu Li1,2
1Department of Radiology and Radiological Sciences, Johns Hopkins University, Baltimore, MD, United States, 2F.M. Kirby Research Center for Functional Brain Imaging, Kennedy Krieger Institute, Baltimore, MD, United States, 3Department of Neurology, Johns Hopkins University, Baltimore, MD, United States
1Department of Radiology and Radiological Sciences, Johns Hopkins University, Baltimore, MD, United States, 2F.M. Kirby Research Center for Functional Brain Imaging, Kennedy Krieger Institute, Baltimore, MD, United States, 3Department of Neurology, Johns Hopkins University, Baltimore, MD, United States
Synopsis
We investigated associations of brain volume, iron levels as measured by QSM-MRI, and β-amyloid plaque load as measured by 11C-PiB PET imaging on prospective cognitive trajectories, measured using a global and domain-specific cognitive composite scores (e.g., episodic memory, executive function, visuospatial processing and language) in cognitively normal older adults with maximum follow-up of 5 years. Greater volume of multiple cortical and subcortical brain regions was strongly associated with the rate of cognitive decline. Associations between brain iron and β-amyloid and longitudinal cognitive decline were weaker, with brain iron in the basal ganglia and entorhinal cortex predicting global decline.
Introduction
Recent studies suggest elevated brain iron content especially in the hippocampus is associated with lower cognitive performance, independent of brain volume and β-amyloid burden among cognitively normal older adults1. In addition, the interaction between iron and β-amyloid may predict longitudinal cognitive deterioration in AD2. However, effects of brain atrophy, iron and β-amyloid deposition on the rate of decline of global and domain specific cognitive functions in cognitively normal older adults remain unclear. This study investigated the relationship between brain volume, iron level measured with quantitative susceptibility mapping (QSM) and β-amyloid load based on 11C-PiB PET on prospective cognitive trajectories over 5 years.Methods
Participants comprised 150 cognitively normal participants (mean age at QSM scan = 69 ± 8 y/o, 57 males) who are part of the BIOCARD cohort3,4. Among them, 97 participants (PET group) underwent a 11C-PiB PET examination to assess β-amyloid levels at the same visit as the QSM scan, and volume ratio (DVR) images were calculated in the native space of each PET image5. Participants complete a comprehensive neuropsychological battery annually to calculate global cognitive composite score3. Additionally, domain-specific cognitive composite scores were computed based on factor analysis of 12 neuropsychological test scores3.Participants were scanned on a 3T Philips scanner using a 3D multi-echo GRE sequence (TR/TE1/∆TE = 40/6/6 ms, 5 echoes, voxel size = 1×1×1 mm3). QSM processing involved best-path based phase unwrapping6, VSHARP-background field removal7 and SFCR8. For brain segmentation, T1-weighted MPRAGE images were coregistered to the QSM and PET space. Twelve selected ROIs in superior-and-middle frontal gyrus (SMF), inferior and orbital frontal gyrus (IOF), parietal, temporary, occipital and entorhinal cortex (ENT), cingulate, amygdala, hippocampus, caudate nucleus (CN), putamen (PT) and globus pallidus (GP) were automatically segmented on the basis of human brain atlases (mricloud.org) for quantifying mean magnetic susceptibility and DVR, structure volume.
Linear mixed models were used to test the association of ROI-based volumes and iron load on cognition over time. The longitudinal cognitive scores (global and domain-specific composites) were the outcome variables, and age, gender, APOE ε4, years of education, volume, volume × time, QSM, and QSM × time were the predictors. To test how the relationship was affected by β-amyloid deposition, all models were rerun in the PET group with local DVR and DVR× time as extra predictors.
Results
Demographic information of all participants and the PET group can be found in our recent study1.In all participants, greater baseline hippocampal volume was associated with less global cognitive decline [β (standard error, SE) = 0.057 (0.021), p = 0.007]. Similar associations between structure volume and global cognitive decline were also found in amygdala [β (SE) = 0.052 (0.021), p = 0.013] and all the selected cortical regions except in the cingulate and ENT (Table 1), while baseline QSM in ENT [β (SE) = -0.050 (0.021), p = 0.017], CN [β (SE) = -0.051 (0.020), p = 0.013], PT [β (SE) = -0.051 (0.020), p = 0.013], and GP [β (SE) = -0.047 (0.020), p = 0.023] were found to predict the decline rate of global cognitive composite score in all participants (Fig. 1 and Table 1).Similar analyses in the PET group confirmed the positive associations between volume and global cognitive decline in the hippocampus [β (SE) = 0.083 (0.024), p = 0.001] and other cortical regions (Table 1), while baseline QSM in CN [β (SE) = -0.058 (0.024), p = 0.015] was predictive of decline rate. β-amyloid load showed no association with global cognition over time in all selected ROIs.
For domain-specific cognition, baseline hippocampal volume predicted the rate of change of episodic memory [β (SE) = 0.061 (0.023), p = 0.008], visuospatial function [β (SE) = 0.043 (0.018), p = 0.020], and language [β (SE) = 0.044 (0.021), p = 0.040], while rate of decline in the executive function was predicted by hippocampal QSM [β (SE) = -0.041 (0.019), p = 0.031] (Table 2). In the PET group, the relationships between baseline hippocampal volume and episodic memory, visuospatial function and language were the same, while QSM in CN [β (SE) = -0.059 (0.023), p = 0.013] and GP [β (SE) = -0.050 (0.024), p = 0.041] predicted the rate of episodic memory change, and QSM in ENT [β (SE) = -0.061 (0.020), p = 0.003] predict the rate of visuospatial function decline. In addition, β-amyloid level in SMF [β (SE) = -0.050 (0.025), p = 0.046], parietal [β (SE) = -0.059 (0.025), p = 0.020], occipital [β (SE) = -0.050 (0.025), p = 0.049] and PT [β (SE) = -0.060 (0.026), p = 0.027] predict the deteriorating rate in the language domain (Table 3).
Discussion and conclusion
Among cognitively normal individuals, the volumes of several cortical and subcortical regions were negatively associated with the rate of decline in global and domain-specific cognitive composite scores. In addition to brain atrophy, we found that iron load and to a lesser extent β-amyloid were negatively associated with decline rate of global and domain-specific cognitive composite scores in this population. Future studies with larger sample size and longer follow-ups may help further illustrate the effects of brain iron and β-amyloid and their possible synergistic effect on longitudinal cognitive declines.Acknowledgements
This work was supported by NCRR and NIBIB (P41EB015909), NIA (R03AG065527, U19AG033655) of the National Institutes of Health.References
[1] Chen L, Soldan A, Oishi K, et al. Quantitative susceptibility mapping of brain iron and b-amyloid in MRI and PET relating to cognitive performance in cognitively normal older adults. Radiology 2020. https://doi.org/10.1148/ radiol.2020201603.[2] Ayton S, Fazlollahi A, Bourgeat P, et al. Cerebral quantitative susceptibility mapping predicts amyloid-beta-related cognitive decline. Brain 2017;140(8):2112-2119.[3] Albert M, Soldan A, Gottesman R, et al. Cognitive changes preceding clinical symptom onset of mild cognitive impairment and relationship to ApoE genotype. Curr. Alzheimer Res. 2014;11(8):773-784.[4] Soldan A, Pettigrew C, Cai Q, et al. Cognitive reserve and long-term change in cognition in aging and preclinical Alzheimer's disease. Neurobiol. Aging 2017;60:164-172.[5] Zhou Y, Resnick SM, Ye W, et al. Using a reference tissue model with spatial constraint to quantify [11C]Pittsburgh compound B PET for early diagnosis of Alzheimer's disease. Neuroimage 2007;36(2):298-312.[6] Abdul-Rahman HS, Gdeisat MA, Burton DR, et al. Fast and robust three-dimensional best path phase unwrapping algorithm. Appl Opt 2007;46(26):6623-6635.[7] Schweser F, Deistung A, Lehr BW, et al. Quantitative imaging of intrinsic magnetic tissue properties using MRI signal phase: an approach to in vivo brain iron metabolism? Neuroimage 2011;54(4):2789-2807.[8] Bao L, Li X, et al. Quantitative susceptibility mapping using structural feature based collaborative reconstruction (SFCR) in the human brain. IEEE Trans Med Imaging 2016;35(9):2040-2050.Figures
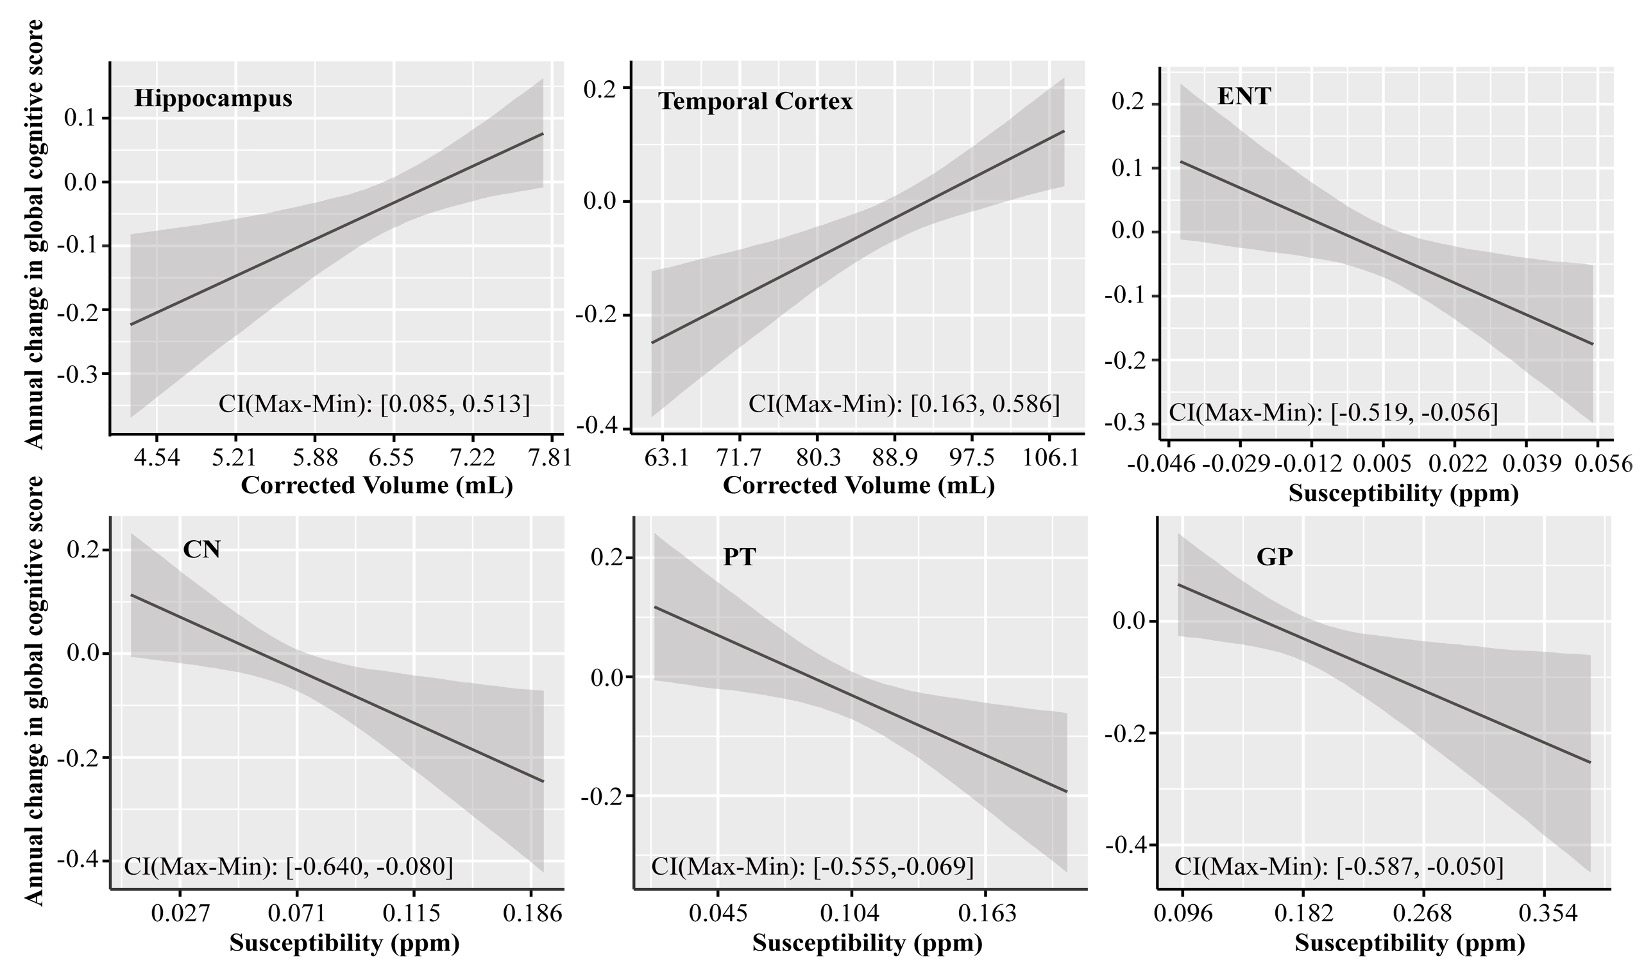
Figure 1 Associations of the corrected volume in hippocampus and temporal cortex, QSM in ENT, CN, PT and GP, to the annual change in global cognitive functions in all participants (n = 150). Annual change of cognitive function was calculated for each participant based on his or her trajectory of decline in the follow-up years after baseline MRI (up to 5 years), and it was plotted against baseline predictor, i.e. corrected volume or QSM. CI (Max-Min) = confidence interval of the difference between the annual change in global cognitive score at the minimum and maximum values of the predictor.
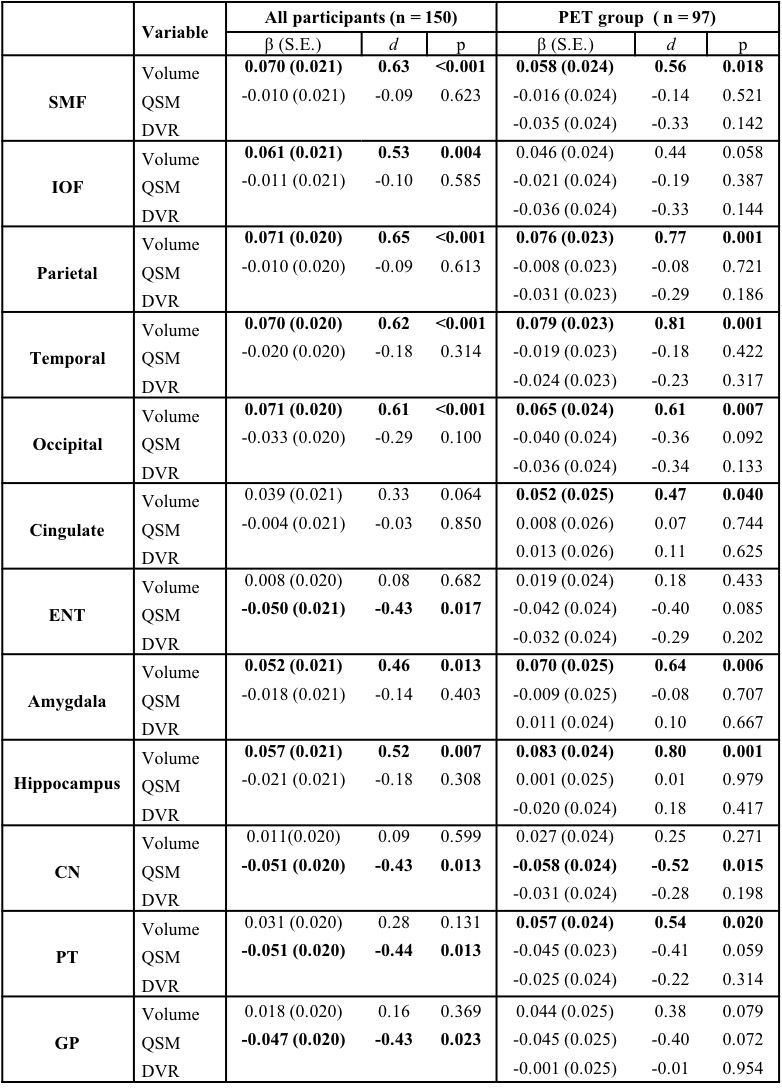
Table 1 Associations of structure volume, tissue iron load (QSM) and β-amyloid load (PET DVR) with rate of change in global cognitive composite scores (variable×time interaction in mixed-effects models) in all participants and participants in the PET group. d: effect size.
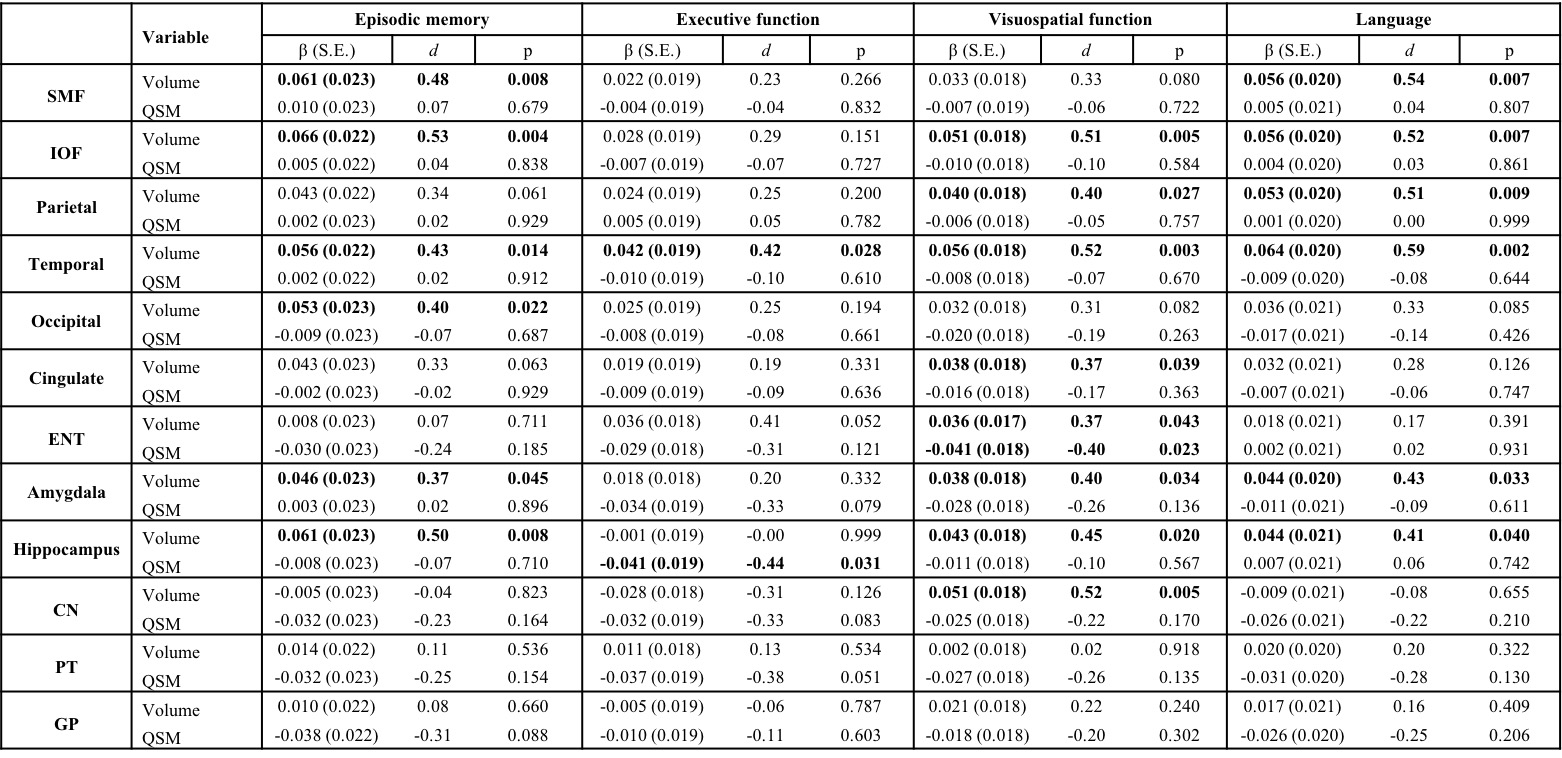
Table 2 Associations of structure volume and tissue iron load (QSM) with rate of change in episodic memory scores, executive score, visuospatial score and language score (variable×time interaction in mixed-effects models) in all participants (n=150). d: effect size.
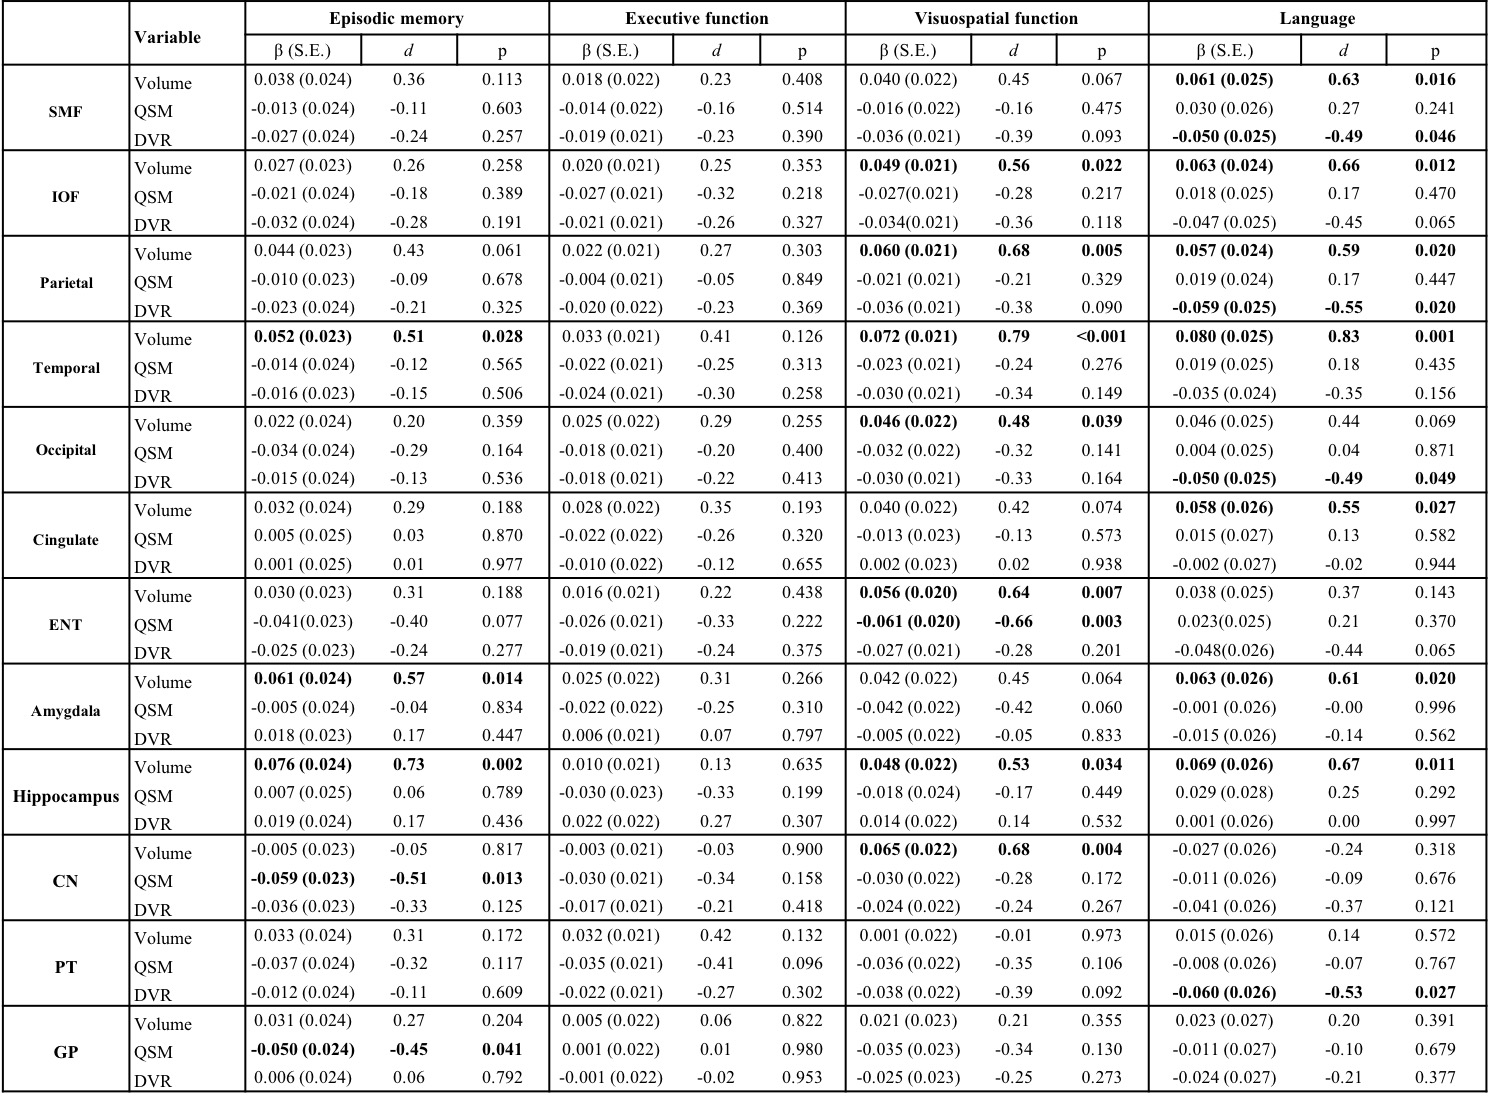
Table 3 Associations of structure volume, tissue iron load (QSM) and β-amyloid load (PET DVR) with rate of change in episodic memory scores, executive score, visuospatial score and language score (variable×time interaction in mixed-effects models) in participants in the PET group (n=97). d: effect size.