3974
Reproducibility of R2* and quantitative susceptibility mapping in deep grey matter at 3T: Cross-vendor non-harmonized protocol study1Department of Biomedical Engineering, University of Alberta, Edmonton, AB, Canada, 2Departments of Radiology and Clinical Neurosciences, Hotchkiss Brain Institute, University of Calgary, Calgary, AB, Canada, 3Seaman Family MR Research Centre, Foothills Medical Centre, Calgary, AB, Canada, 4Department of Radiology, Alberta Children’s Hospital Research Institute and Hotchkiss Brain Institute, University of Calgary, Calgary, AB, Canada
Synopsis
R2* and QSM provide noninvasive ways to measure iron concentration in human brain. Performing multi-center studies help exploring wider demographical and pathological conditions. However, data pooled from multiple sites typically contain local acquisition sequence variations. In this study, the reproducibility of R2* and QSM at 3T are evaluated in 21 healthy adults (“traveling phantoms”) scanned 2x per site using independently site-optimized sequences from three sites and two scanner vendors. Mean R2* and susceptibility measurements in four deep grey matter structures were found to be highly correlated (r2 ≥ 0.98) and reproducible with SD of 1.2 s-1 and 4.1 ppb, respectively.
INTRODUCTION
The transverse relaxation rate (R2*) and susceptibility (using quantitative susceptibility mapping, QSM) can be used to estimate iron load in deep grey matter associated with aging and/or pathology. Both R2* and QSM can be reconstructed from a multi-echo gradient-echo (MEGE) sequence, but the sequence is sensitive to variations in B0 inhomogeneity, gradient nonlinearity, acquisition parameters and motion. Several studies have assessed the repeatability1-3 and reproducibility of R2* and QSM across different sites,3-5 vendors,3,4,6 acquisition methods7 and field strengths.6,8,9 These studies demonstrated that R2* and QSM are reproducible when measurements were collected using similar MEGE sequences. However, practical amalgamation of data between sites and vendors requires managing local sequence variations. In this study, we evaluate the reproducibility of R2* and QSM at 3T using three independent site-optimized sequences.METHODS
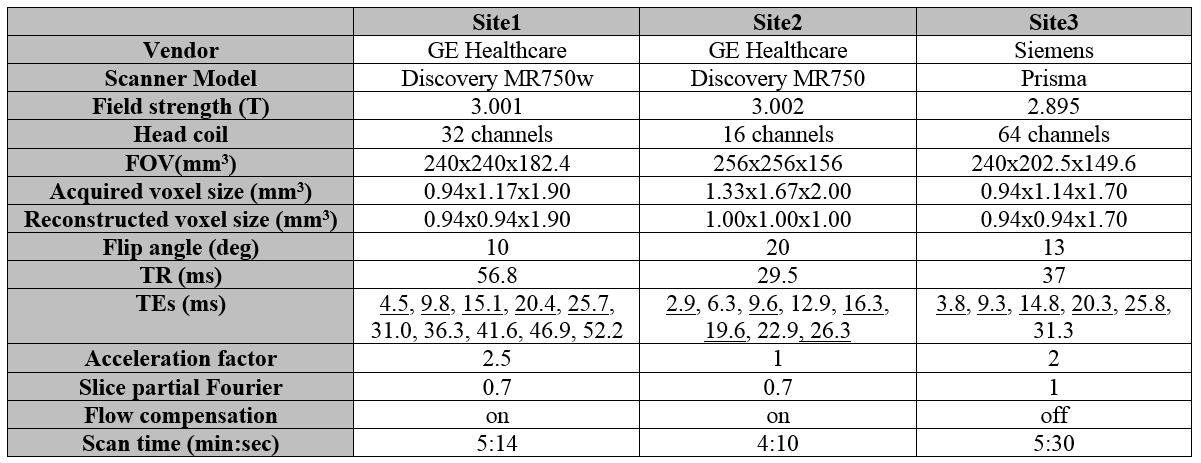
Subjects and Imaging SetupTwenty-one healthy subjects (10 males, aged 20 to 49 years) were analyzed after being scanned twice (in different sessions; mean interval 18.7 ± 26.3 days) at each of three sites. The study was approved by the local ethics committee and all subjects gave written informed consent prior to imaging. Imaging was done at 3T with non-harmonized protocols optimized separately by each site (scanners and imaging parameters are listed in Table 1). Each protocol included two whole brain 3D sequences: T1w MPRAGE (for tissue segmentation) and MEGE (for R2* and QSM).
R2* and QSM Processing
Complex images from different coil elements were combined using the default method for each scanner. Two scenarios of TE selection were tested: processing data from all TEs, or only from the 5 comparable TEs (underlined in Table 1). R2* maps were produced using the ARLO fitting method.10 To exclude unreliable regions, brain masks were produced using FSL's BET from the magnitude of the longest comparable TE between protocols (TE~26 ms). The local phase shift was extracted from averaged Laplacian-unwrapped phase images using V-SHARP with maximum kernel radius of 12 mm, then inverted into a susceptibility map using the iLSQR algorithm.11
Registration and Analysis
Segmentations of four deep grey matter regions (caudate, putamen, thalamus, globus pallidus) were obtained from the T1w volume of a single scan per individual (chosen as the reference) using VolBrain’s online tool.12 MEGE magnitude images at TE1 of the six scans were rigidly registered to the reference T1w volume using ANTs,13 after which the R2* and susceptibility images were mapped into the T1w space using the obtained transformation matrices. Mean R2* and susceptibility values were recorded by pooling over both hemispheres. Repeated scans were compared pairwise using Student’s paired t-test (with significance level set to α= 0.05).
RESULTS AND DISCUSSION
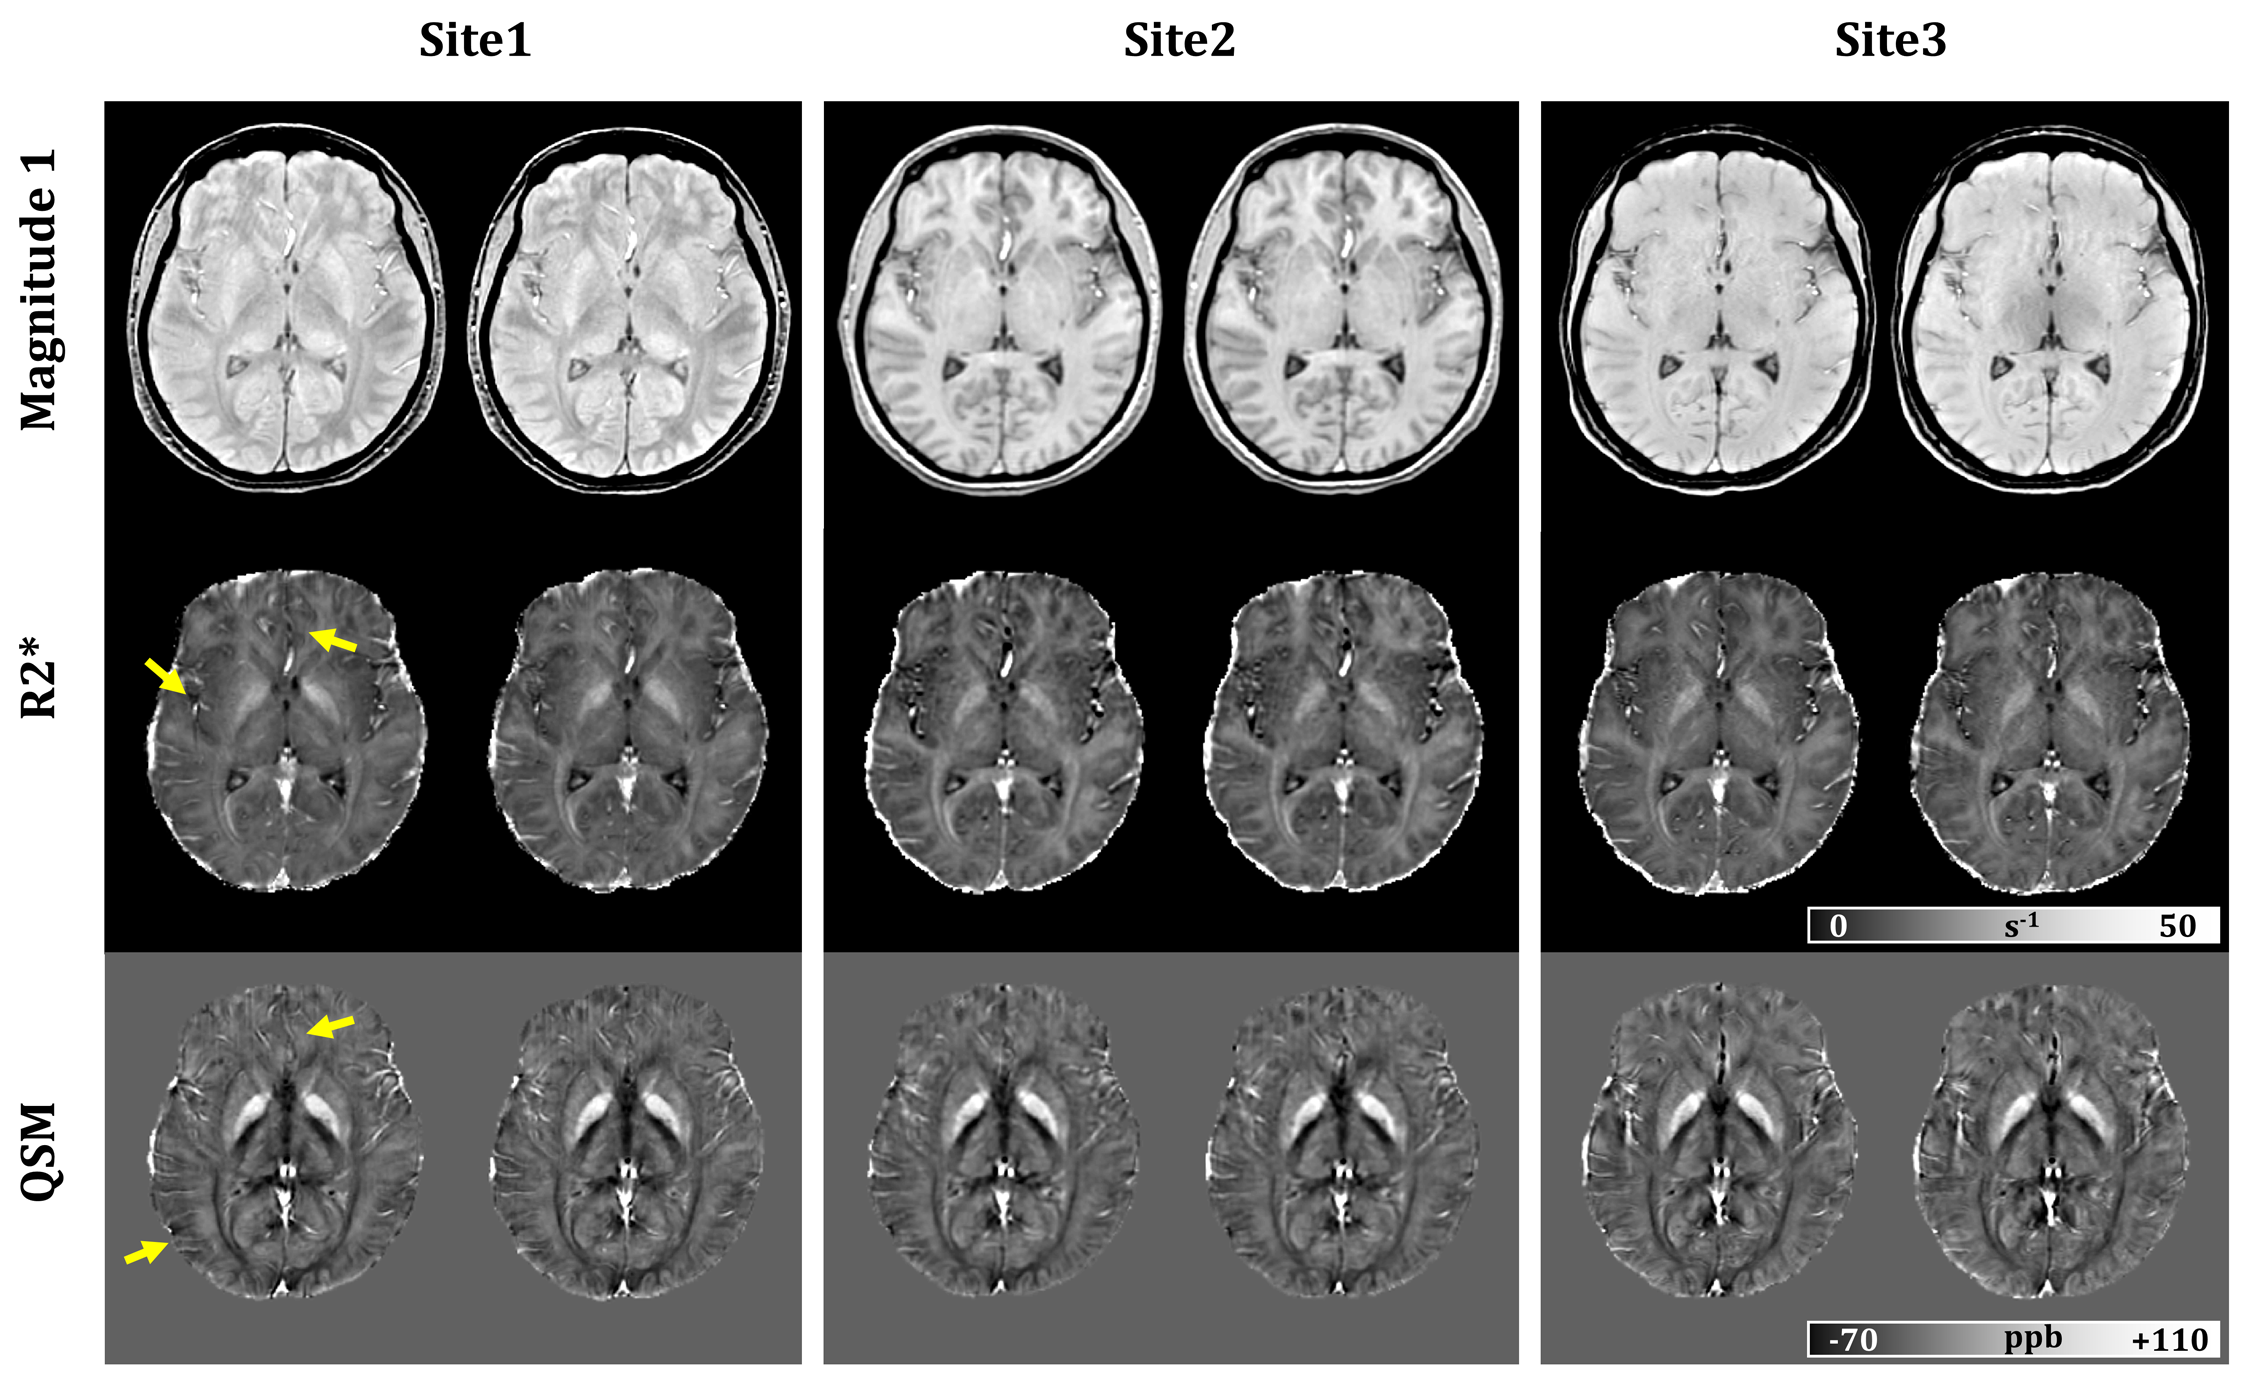
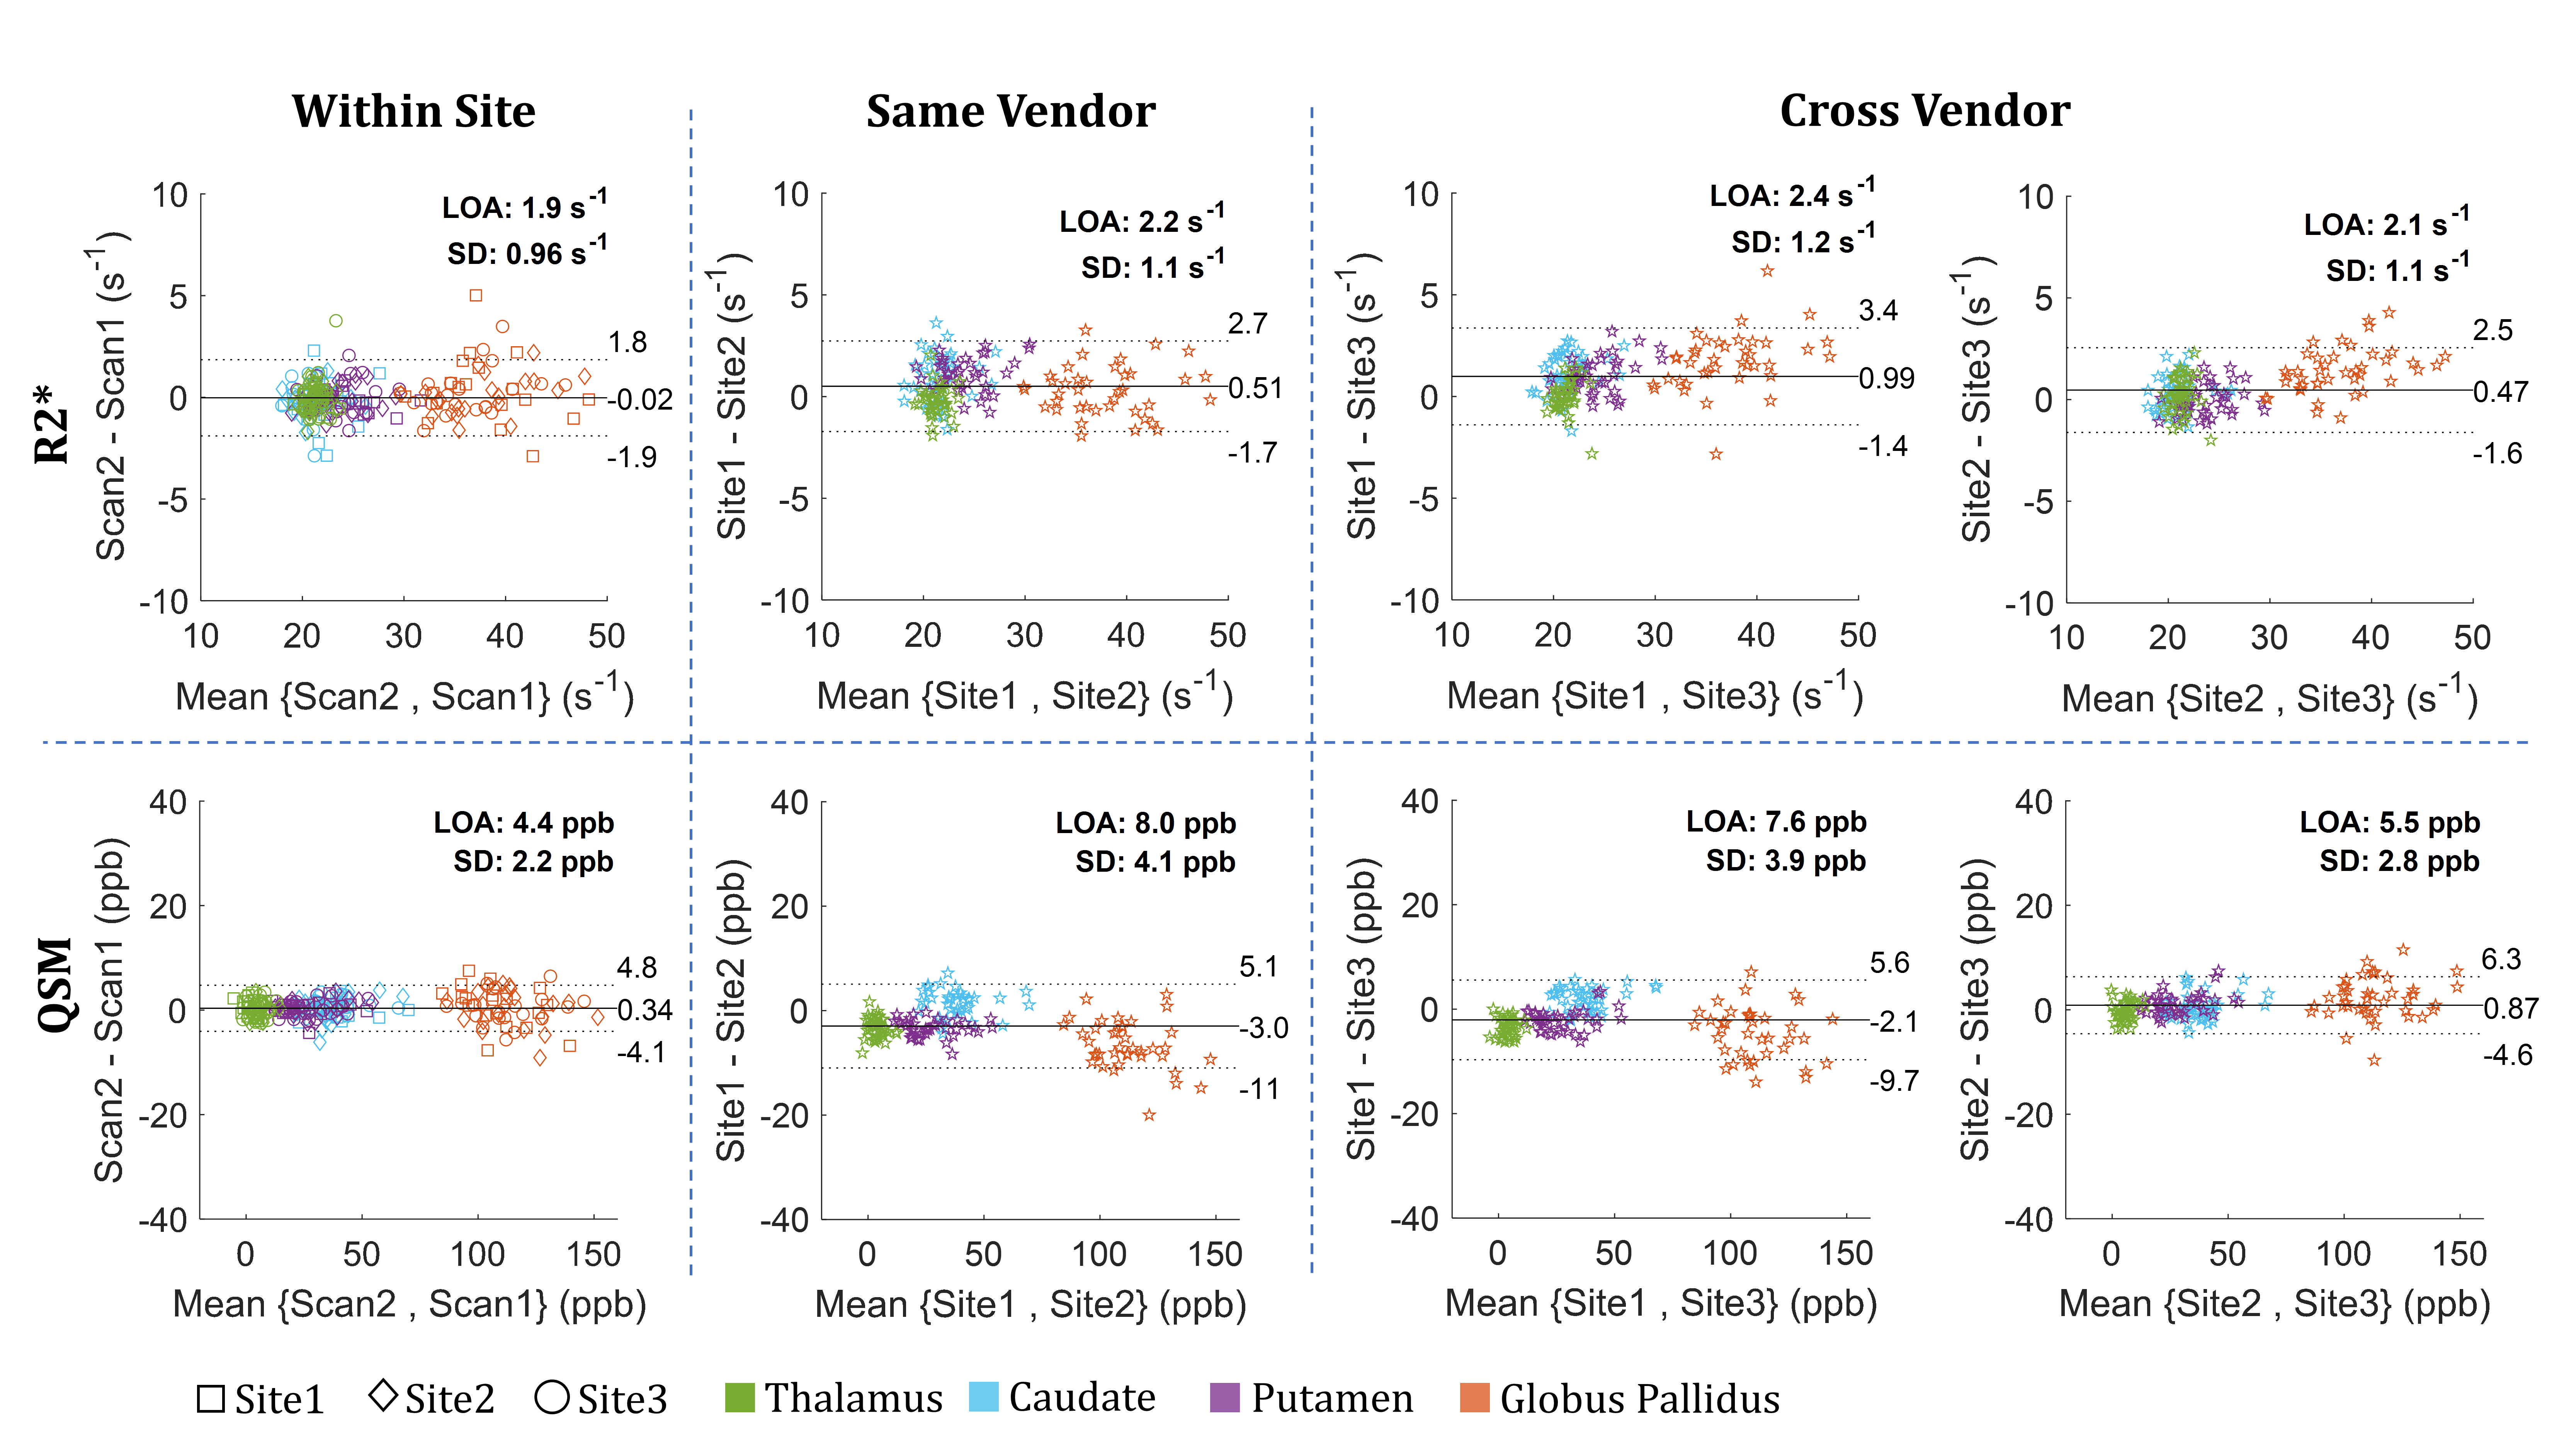
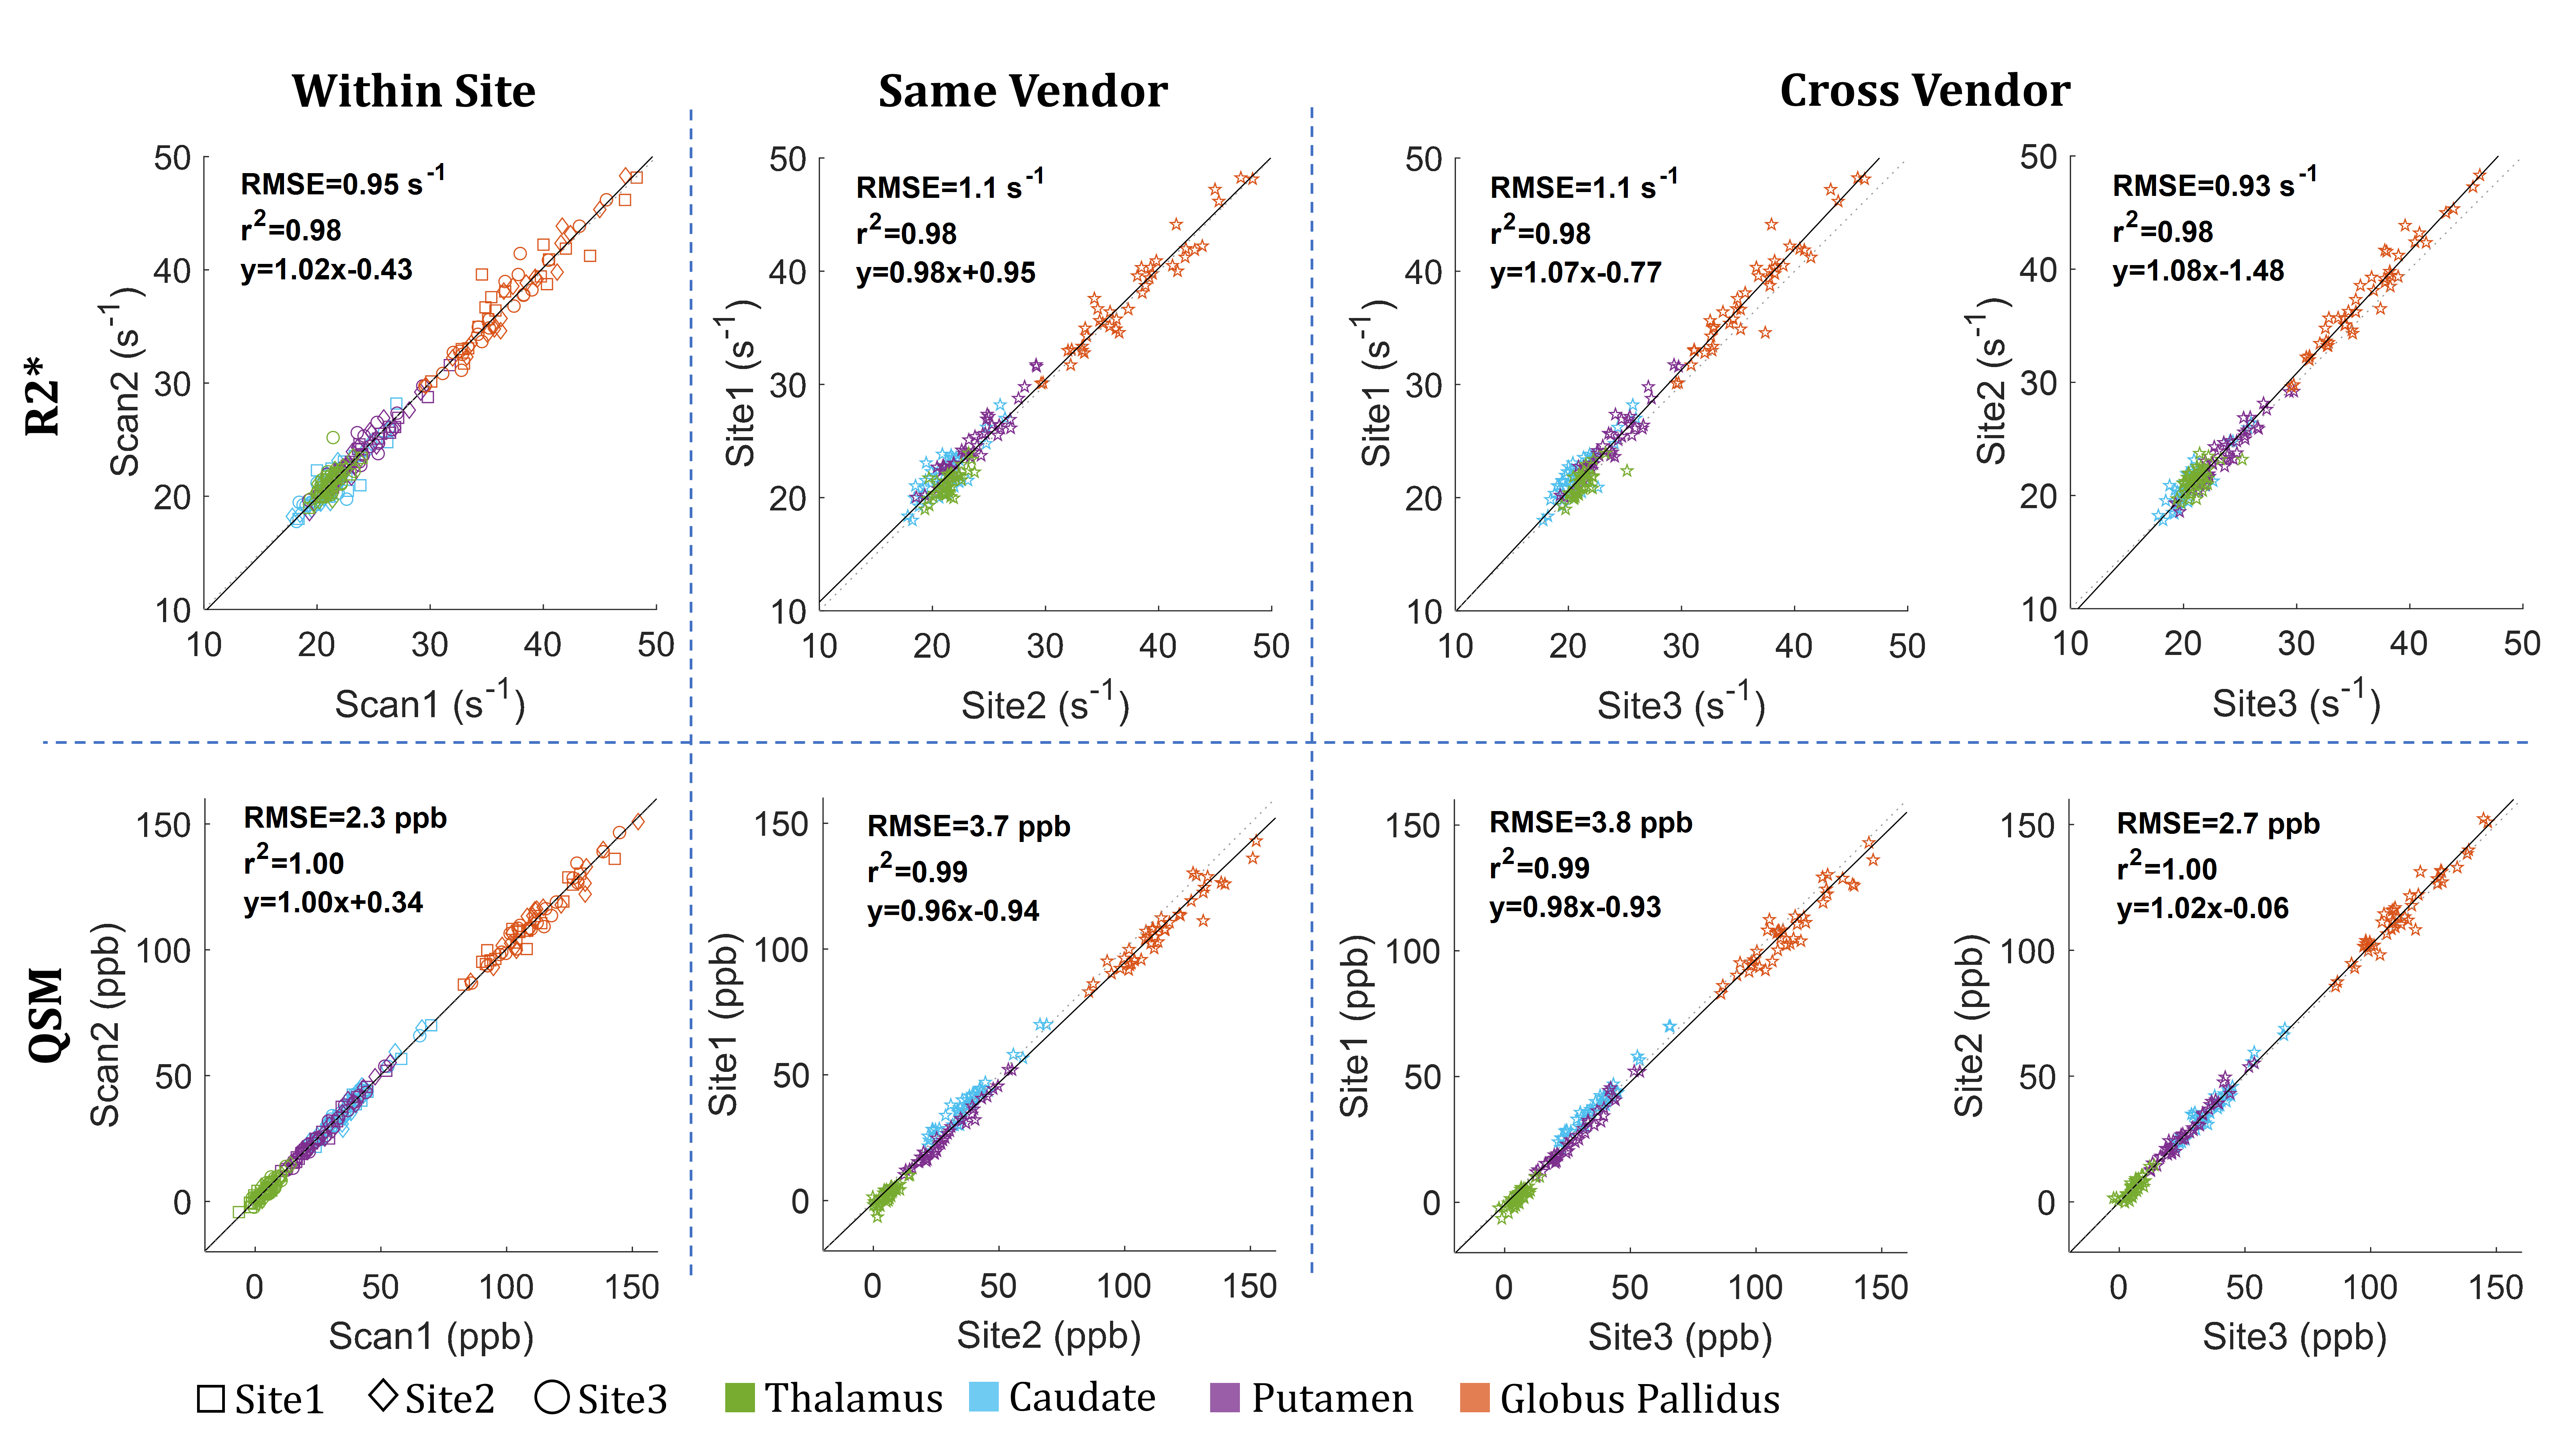
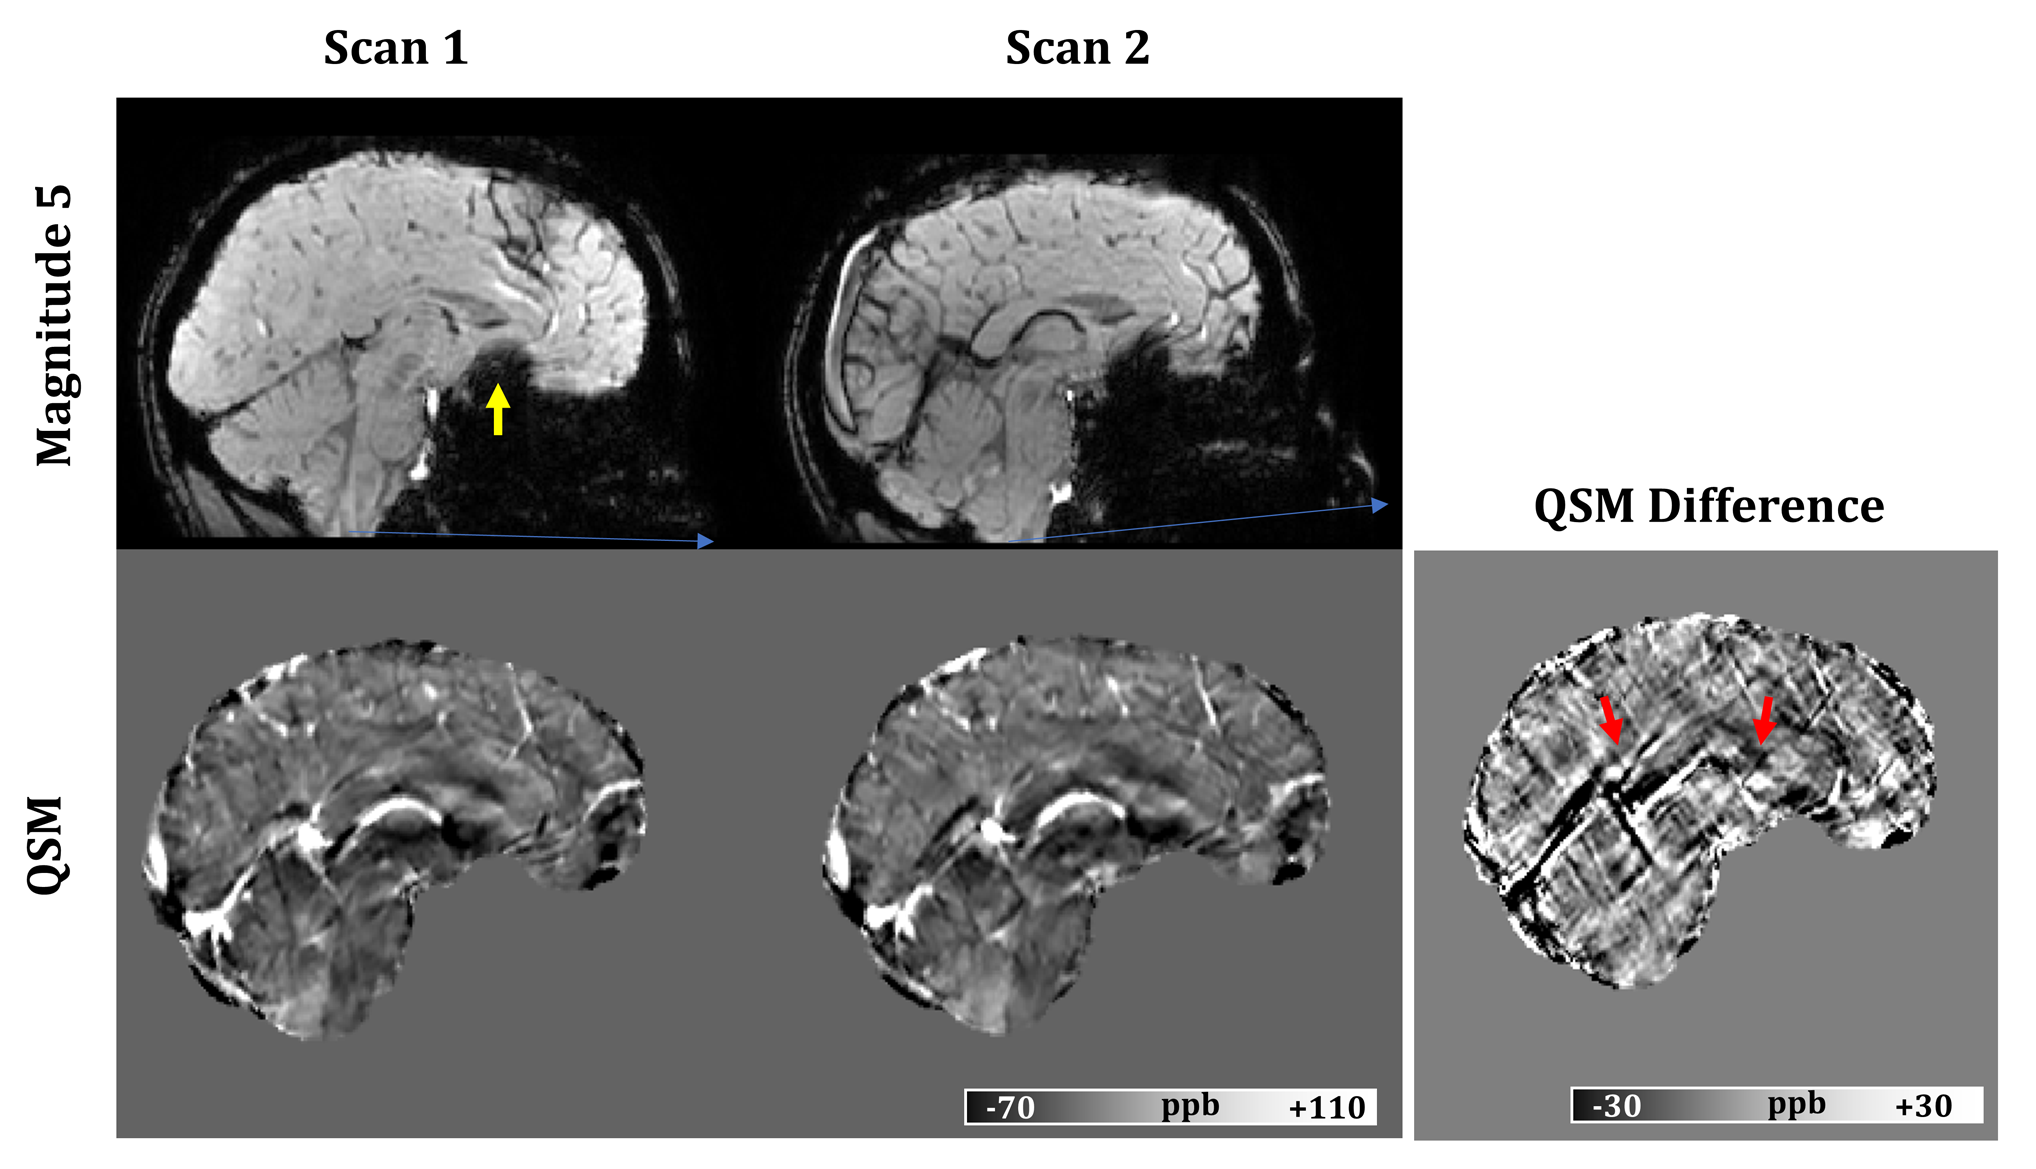
Fig.1 shows sample scan-rescan images from the first echo MEGE magnitude, R2* maps and QSM of one subject. Broad differences in magnitude contrast were evident, while quantitative maps appeared similar across all sites. Small differences were observed around veins and brain edges, particularly in QSM, due to the strong susceptibility-gradient in these regions. Cross-site variability was reduced when QSM reconstruction used only the comparable TEs (SD: 4.1 vs 6.6 ppb; slope:0.96 vs 0.89), as suggested previously.9 For R2* however, processing all TEs was slightly better (SD:1.2 vs 1.3 s-1; slope: no change). Therefore, the rest of this analysis was carried using the comparable TEs for QSM and the full TEs for R2*. Within-site and cross-site regional measurements are compared in Figs 2 and 3, respectively. Results demonstrate that R2* and QSM measurements are highly reproducible, indicating an absolute bias <1 s-1 (p<0.01) and ≤3 ppb (p<0.01) in R2* and QSM, respectively. The SD of differences for R2* were <1.0 s-1 and ≤1.2 s-1 for within-site and cross-site, respectively. For QSM these values were ≤2.2 ppb and ≤4.1 ppb, respectively. Measurements were also highly correlated with r2 values ≥0.98 and ≥0.99 for R2* and QSM, respectively. Overall higher variability was observed cross-site due to differences in hardware and imaging setup, including B0, coil set, shimming and gradient system.A slight cross-vendor deviation in the slope of R2* measurements was observed, which can be attributed to B0 differences between different vendors (i.e., $$$B0_{Site2} /B0_{Site3}$$$ = 1.04). The QSM measurements from Site1 were slightly lower (slope 0.96) than Site2. In a post-hoc analysis, head position was generally found to be more forward-tilted at Site1 (difference:5.5° ± 4.0°, p<0.001). Relative to B0-direction, head orientation effect on white matter is evident in both R2* and QSM due to fiber anisotropy,14,15 but can also add variation to QSM in other tissues through remnant angle-dependent streaking artifacts (Fig.4). Furthermore, susceptibility-induced sinus artifacts were found closer to deep grey matter structures by 3.7 ± 1.8 voxels (p<0.001) in Site1 vs Site2. Cross-site differences in B0 shimming and head orientation influence the shape and extent of the air-tissue sinus artifacts. Combined with the declining toward-edge performance of background removal methods,16 the extended sinus artifacts could cause underestimation in deep grey matter measurements.
CONCLUSION
R2* and QSM measurements in deep grey matter from twenty-one healthy subjects obtained with different protocols across three sites and two scanner vendors were found to be highly correlated and reproducible. Post-processing steps such as excluding unreliable regions, matching the echo-times and minimizing streaking artifacts in QSM help in reducing cross-site variability.Acknowledgements
No acknowledgement found.References
1. Cobzas D, Sun H, Walsh AJ, Lebel RM, Blevins G, Wilman AH. Subcortical gray matter segmentation and voxel-based analysis using transverse relaxation and quantitative susceptibility mapping with application to multiple sclerosis. J Magn Reson Imaging. 2015;42(6):1601-10.
2. Feng X, Deistung A, Reichenbach JR. Quantitative susceptibility mapping (QSM) and R2* in the human brain at 3T: Evaluation of intra-scanner repeatability. Z Med Phys. 2018;28(1):36-48.
3. Spincemaille P, Liu Z, Zhang S, Kovanlikaya I, Ippoliti M, Makowski M, Watts R, de Rochefort L, Venkatraman V, Desmond P, Santin MD, Lehéricy S, Kopell BH, Péran P, Wang Y. Clinical Integration of Automated Processing for Brain Quantitative Susceptibility Mapping: Multi-Site Reproducibility and Single-Site Robustness. J Neuroimaging. 2019;29(6):689-698.
4. Lin PY, Chao TC, Wu ML. Quantitative susceptibility mapping of human brain at 3T: a multisite reproducibility study. AJNR Am J Neuroradiol. 2015;36(3):467-74.
5. Wang R, Xie G, Zhai M, Zhang Z, Wu B, Zheng D, Hong N, Jiang T, Wen B, Cheng J. Stability of R2* and quantitative susceptibility mapping of the brain tissue in a large scale multi-center study. Sci Rep. 2017;7:45261.
6. Deh K, Nguyen TD, Eskreis-Winkler S, Prince MR, Spincemaille P, Gauthier S, Kovanlikaya I, Zhang Y, Wang Y. Reproducibility of quantitative susceptibility mapping in the brain at two field strengths from two vendors. J Magn Reson Imaging. 2015;42(6):1592-600.
7. Lauzon ML, McCreary CR, McLean DA, Salluzzi M, Frayne R. Quantitative susceptibility mapping at 3 T: comparison of acquisition methodologies. NMR Biomed. 2017;30(4).
8. Spincemaille P, Anderson J, Wu G, Yang B, Fung M, Li K, Li S, Kovanlikaya I, Gupta A, Kelley D, Benhamo N, Wang Y. Quantitative Susceptibility Mapping: MRI at 7T versus 3T. J Neuroimaging. 2020;30(1):65-75.
9. Lancione M, Donatelli G, Cecchi P, Cosottini M, Tosetti M, Costagli M. Echo-time dependency of quantitative susceptibility mapping reproducibility at different magnetic field strengths. Neuroimage. 2019;197:557-564.
10. Pei M, Nguyen TD, Thimmappa ND, Salustri C, Dong F, Cooper MA, Li J, Prince MR, Wang Y. Algorithm for fast monoexponential fitting based on Auto-Regression on Linear Operations (ARLO) of data. Magn Reson Med. 2015;73(2):843-50.
11. Li W, Wang N, Yu F, et al. A method for estimating and removing streaking artifacts in quantitative susceptibility mapping. Neuroimage. 2015;108:111-122
12. Manjón JV, Coupé P. volBrain: An Online MRI Brain Volumetry System. Frontiers in Neuroinformatics. 2016;10.
13. Avants BB, Tustison NJ, Song, G, Cook, PA, Klein A, Gee JC. A reproducible evaluation of ANTs similarity metric performance in brain image registration. Neuroimage 2011;54:2033-2044.
14. Bender B, Klose U. The in vivo influence of white matter fiber orientation towards B(0) on T2* in the human brain. NMR Biomed. 2010;23(9):1071-6.
15. Lancione M, Tosetti M, Donatelli G, Cosottini M, Costagli M. The impact of white matter fiber orientation in single-acquisition quantitative susceptibility mapping. NMR Biomed. 2017;30(11).
16. Schweser F, Robinson SD, de Rochefort L, Li W, Bredies K. An illustrated comparison of processing methods for phase MRI and QSM: removal of background field contributions from sources outside the region of interest. NMR Biomed. 2017;30(4):10.
Figures