3973
Investigating the Effect of Flow Compensation Schemes and Processing Pipelines on the Accuracy of Venous Quantitative Susceptibility Mapping
Ronja C. Berg1, Christine Preibisch1, Claus Zimmer1, David L. Thomas2,3, Karin Shmueli4, and Emma Biondetti5
1School of Medicine, Department of Neuroradiology, Technical University of Munich, Munich, Germany, 2Dementia Research Centre, UCL Queen Square Institute of Neurology, University College London, London, United Kingdom, 3Wellcome Centre for Human Neuroimaging, UCL Queen Square Institute of Neurology, University College London, London, United Kingdom, 4Department of Medical Physics and Biomedical Engineering, University College London, London, United Kingdom, 5Institut du Cerveau – ICM, INSERM U 1127, CNRS UMR 7225, Sorbonne Université, Paris, France
1School of Medicine, Department of Neuroradiology, Technical University of Munich, Munich, Germany, 2Dementia Research Centre, UCL Queen Square Institute of Neurology, University College London, London, United Kingdom, 3Wellcome Centre for Human Neuroimaging, UCL Queen Square Institute of Neurology, University College London, London, United Kingdom, 4Department of Medical Physics and Biomedical Engineering, University College London, London, United Kingdom, 5Institut du Cerveau – ICM, INSERM U 1127, CNRS UMR 7225, Sorbonne Université, Paris, France
Synopsis
Venous quantitative susceptibility mapping (QSM) enables quantification of venous oxygenation. Flow-compensated acquisition is generally recommended for venous QSM, although its effect on the accuracy of venous susceptibility values has not been systematically evaluated. Moreover, QSM processing methods tend to be optimized for brain parenchyma tissues rather than veins. Here, we compared five different acquisition protocols (incorporating distinct flow compensation schemes) and six QSM processing methods in ten healthy volunteers. We found that venous susceptibility values depend strongly on the QSM pipeline (effect size ηp2=0.861) and much less on acquisition parameters including flow compensation (effect size ηp2=0.016).
Introduction
Quantitative susceptibility mapping (QSM) aims to estimate tissue magnetic susceptibility (χ) using MRI and has been proposed as a non-invasive alternative to PET for measuring cerebral venous oxygenation1-4. Venous blood flow is expected to cause an additional signal phase component, which is unrelated to the phase caused by the paramagnetic susceptibility of deoxygenated blood5 and therefore a potential confounder for accurate estimation of venous oxygenation. To correct for this flow-induced phase, the use of flow compensation (FC) has been proposed3,6, which improves the appearance of veins in QSM6-7. However, the effect of FC on the accuracy of venous QSM has not been systematically evaluated. Moreover, accurate QSM relies on multi-echo acquisitions8, but multi-echo FC is mostly unavailable on clinical MRI systems, limiting the clinical applicability of FC. In veins, high susceptibility values provide a strong contrast to the surrounding brain tissue, which can prove difficult to reconstruct correctly using currently available QSM toolboxes9, as these methods were optimized for brain tissues but not veins. Although some algorithms have been proposed to overcome this issue10, the accuracy of QSM processing pipelines for measuring venous susceptibility has not been systematically evaluated. Here, based on images acquired in ten healthy subjects, we aimed to compare the effect of acquisition sequences incorporating different FC schemes and several QSM methods (toolbox-based or previously optimized for venous QSM) on venous susceptibility values. To determine vein location independently, we also acquired phase contrast angiography (PCA).Methods
Ten healthy subjects (aged 29±8y, 5M/5F) were scanned on a Philips 3T Ingenia Elition using a 32-channel head coil. Table 1 shows parameter settings for all MRI sequences. We compared three different FC settings: 1) FC for all echoes along all encoding directions (Full-FC); 2) First-echo FC along all encoding directions either applying standard SENSE with echoes matched to the first sequence (TE1-FC) or Compressed SENSE for reduced scan time (TE1-FC-CS)11; and 3) no FC with either matched echoes (No-FC) or total number of echoes maximized within the acquisition time of the first sequence (No-FC-7ech). For each sequence, susceptibility maps were calculated using 1) the Susceptibility Tensor Imaging (STI) Suite12 using either iLSQR13 or STI-STAR10,14 for local field-to-susceptibility inversion and 2) the Morphology Enabled Dipole Inversion (MEDI) toolbox15-17, both with default settings. Additionally, 3) total generalized variation (TGV)18-19 and 4) direct (dTIKH) and iterative (iTIKH) implementations of Tikhonov20 regularization (recently applied for venous QSM21) were used to calculate susceptibility maps from the local field maps reconstructed by MEDI. For each subject, a minimum-size brain mask was calculated as the intersection of the masks created by each QSM pipeline. Automated whole-brain vein segmentation of each susceptibility map was performed using multiscale vessel filtering (MVF)22. On the PCA, semi-automated segmentations of the straight sinus and internal cerebral veins were delineated using ITK-SNAP23 and rigidly aligned with each susceptibility map using SPM12. The straight sinus segmentation was additionally eroded by one voxel to reduce partial volume effects. The average and standard deviation of susceptibility values were calculated in both the MVF and single-vessel segmentations. Two-way repeated measures ANOVA was applied to test the effect of different sequences and processing methods on average MVF susceptibility values. For each susceptibility map, venous density was calculated as the fraction of MVF-segmented “venous” voxels over the total number of brain mask voxels.Results
Susceptibility maps acquired using different FC schemes appeared visually similar, whereas greater differences in tissue contrast and automated vein delineation were found between several QSM reconstruction methods (Fig.1). For the same acquisition protocol, the number and location of automatically segmented “venous” voxels differed across the various QSM reconstructions (Fig. 2). In all subjects, STI-based reconstructions yielded the lowest average susceptibility in both whole-brain automatic vein segmentations (Fig.3a) and manual segmentations of representative veins (Fig.4). Tikhonov-based reconstructions yielded whole-brain venous density values similar to STI-based reconstructions but consistently higher average susceptibility (Fig.3). According to the two-way repeated measures ANOVA analysis, the acquisition sequence had a significant effect on mean venous susceptibility but the effect of the QSM processing method was more than an order of magnitude greater (Fig.4c).Discussion
The choice of QSM processing pipeline had a greater effect on venous susceptibility values than the acquisition sequence in general or the use of FC in particular. Likewise, different FC implementations yielded comparable venous susceptibility values. Thus, sequences without FC or with only first-echo FC appear as suitable for quantitative analyses as sequences with full FC. However, the choice of QSM processing pipeline is crucial for correctly reconstructing high susceptibility values in veins. Different vein segmentation techniques did not influence our results: similar trends were seen when using both automated and manual segmentation methods. Venous oxygenation (SvO2), a marker of tissue oxygen metabolism, can be estimated from venous QSM as previously described1,24-25. While most QSM methods slightly overestimated SvO2, dTIKH reconstructions within the internal cerebral veins (with χ≈0.4-0.45ppm and corresponding SvO2≈66-70%) provided values in agreement with the literature (SvO2≈63-68%)26-27.Conclusion
The effect of different QSM processing methods on venous susceptibility was more than an order of magnitude greater than the effect of varying acquisition settings including flow compensation, indicating that specific optimization of QSM algorithms is essential for accurate venous QSM.Acknowledgements
Ronja Berg is supported by a PhD grant from the Friedrich-Ebert-Stiftung. Christine Preibisch received a grant from the German research Foundation (DFG, grant PR 1039/6-1). Emma Biondetti received grant funding from France Parkinson and Biogen Inc. David Thomas is supported by the UCL Leonard Wolfson Experimental Neurology Centre (PR/ylr/18575), UCLH NIHR Biomedical Research Centre, and the Wellcome Trust (Centre Award 539208). Dr Karin Shmueli is supported by European Research Council Consolidator Grant DiSCo MRI SFN 770939. We thank Guillaume Gilbert from Philips for providing the modified sequence for full multi-echo flow compensation.References
- Fan, A. P., Bilgic, B., Gagnon, L., Witzel, T., Bhat, H., Rosen, B. R., & Adalsteinsson, E. (2014). Quantitative oxygenation venography from MRI phase. Magnetic resonance in medicine, 72(1), 149-159.
- Kudo, K., Liu, T., Murakami, T., Goodwin, J., Uwano, I., Yamashita, F., ... & Sasaki, M. (2016). Oxygen extraction fraction measurement using quantitative susceptibility mapping: comparison with positron emission tomography. Journal of Cerebral Blood Flow & Metabolism, 36(8), 1424-1433.
- Xu, B., Liu, T., Spincemaille, P., Prince, M., & Wang, Y. (2014). Flow compensated quantitative susceptibility mapping for venous oxygenation imaging. Magnetic resonance in medicine, 72(2), 438-445.
- Cho, J., Lee, J., An, H., Goyal, M. S., Su, Y., & Wang, Y. (2020). Cerebral oxygen extraction fraction (OEF): Comparison of challenge-free gradient echo QSM+ qBOLD (QQ) with 15O PET in healthy adults. Journal of Cerebral Blood Flow & Metabolism, 0271678X20973951.
- Brown, R. W., Cheng, Y. C. N., Haacke, E. M., Thompson, M. R., & Venkatesan, R. (2014). Magnetic resonance imaging: physical principles and sequence design. John Wiley & Sons. Chapter 23.
- Wu, D., Liu, S., Buch, S., Ye, Y., Dai, Y., & Haacke, E. M. (2016). A fully flow‐compensated multiecho susceptibility‐weighted imaging sequence: The effects of acceleration and background field on flow compensation. Magnetic resonance in medicine, 76(2), 478-489.
- Deistung, A., Dittrich, E., Sedlacik, J., Rauscher, A., & Reichenbach, J. R. (2009). ToF‐SWI: simultaneous time of flight and fully flow compensated susceptibility weighted imaging. Journal of Magnetic Resonance Imaging: An Official Journal of the International Society for Magnetic Resonance in Medicine, 29(6), 1478-1484.
- Biondetti, E., Karsa, A., Thomas, D. L., & Shmueli, K. (2020). Investigating the accuracy and precision of TE‐dependent versus multi‐echo QSM using Laplacian‐based methods at 3 T. Magnetic Resonance in Medicine.
- Sato, R., Shirai, T., Taniguchi, Y., Murase, T., Bito, Y., & Ochi, H. (2017). Quantitative susceptibility mapping using the multiple dipole-inversion combination with k-space segmentation method. Magnetic Resonance in Medical Sciences, 16(4), 340.
- Wei, H., Dibb, R., Zhou, Y., Sun, Y., Xu, J., Wang, N., & Liu, C. (2015). Streaking artifact reduction for quantitative susceptibility mapping of sources with large dynamic range. NMR in Biomedicine, 28(10), 1294-1303.
- Geerts-Ossevoort, L., de Weerdt, E., Duijndam, A., van IJperen, G., Peeters, H., Doneva, M., ... & Huang, A. Speed done right. Every time.
- https://people.eecs.berkeley.edu/~chunlei.liu/software.html
- Li, W., Wu, B., & Liu, C. (2011). Quantitative susceptibility mapping of human brain reflects spatial variation in tissue composition. Neuroimage, 55(4), 1645-1656.
- Wei, H., Dibb, R., Decker, K., Wang, N., Zhang, Y., Zong, X., ... & Liu, C. (2017). Investigating magnetic susceptibility of human knee joint at 7 Tesla. Magnetic resonance in medicine, 78(5), 1933-1943.
- http://pre.weill.cornell.edu/mri/pages/qsm.html
- Liu, T., Liu, J., De Rochefort, L., Spincemaille, P., Khalidov, I., Ledoux, J. R., & Wang, Y. (2011). Morphology enabled dipole inversion (MEDI) from a single‐angle acquisition: comparison with COSMOS in human brain imaging. Magnetic resonance in medicine, 66(3), 777-783.
- Liu, J., Liu, T., de Rochefort, L., Ledoux, J., Khalidov, I., Chen, W., ... & Wang, Y. (2012). Morphology enabled dipole inversion for quantitative susceptibility mapping using structural consistency between the magnitude image and the susceptibility map. Neuroimage, 59(3), 2560-2568.
- Langkammer, C., Bredies, K., Poser, B. A., Barth, M., Reishofer, G., Fan, A. P., ... & Ropele, S. (2015). Fast quantitative susceptibility mapping using 3D EPI and total generalized variation. Neuroimage, 111, 622-630.
- Knoll, F., Bredies, K., Pock, T., & Stollberger, R. (2011). Second order total generalized variation (TGV) for MRI. Magnetic resonance in medicine, 65(2), 480-491.
- https://xip.uclb.com/i/software/mri_qsm_tkd.html
- Biondetti, E., Rojas-Villabona, A., Sokolska, M., Pizzini, F. B., Jäger, H. R., Thomas, D. L., & Shmueli, K. (2019). Investigating the oxygenation of brain arteriovenous malformations using quantitative susceptibility mapping. NeuroImage, 199, 440-453.
- Bazin, P. L., Fan, A., Mianowska, G., Olbrich, A., Schäfer, A., Villringer, A., & Gauthier, C. J. (2015). Automated vessel segmentation from quantitative susceptibility maps at 7 Tesla. In Proceedings of the Twenty-forth Annual Meeting of the ISMRM, (Toronto, ON:) (Vol. 2287).
- Yushkevich, P. A., Piven, J., Hazlett, H. C., Smith, R. G., Ho, S., Gee, J. C., & Gerig, G. (2006). User-guided 3D active contour segmentation of anatomical structures: significantly improved efficiency and reliability. Neuroimage, 31(3), 1116-1128.
- Weisskoff, R. M., & Kiihne, S. (1992). MRI susceptometry: image‐based measurement of absolute susceptibility of MR contrast agents and human blood. Magnetic resonance in medicine, 24(2), 375-383.
- Spees, W. M., Yablonskiy, D. A., Oswood, M. C., & Ackerman, J. J. (2001). Water proton MR properties of human blood at 1.5 Tesla: Magnetic susceptibility, T1, T2, T, and non‐Lorentzian signal behavior. Magnetic Resonance in Medicine: An Official Journal of the International Society for Magnetic Resonance in Medicine, 45(4), 533-542.
- Barhoum, S., Rodgers, Z. B., Langham, M., Magland, J. F., Li, C., & Wehrli, F. W. (2015). Comparison of MRI methods for measuring whole‐brain venous oxygen saturation. Magnetic resonance in medicine, 73(6), 2122-2128.
- Jain, V., Magland, J., Langham,
M., & Wehrli, F. W. (2013). High temporal resolution in vivo blood
oximetry via projection‐based T2 measurement. Magnetic resonance in medicine, 70(3), 785-790.
Figures
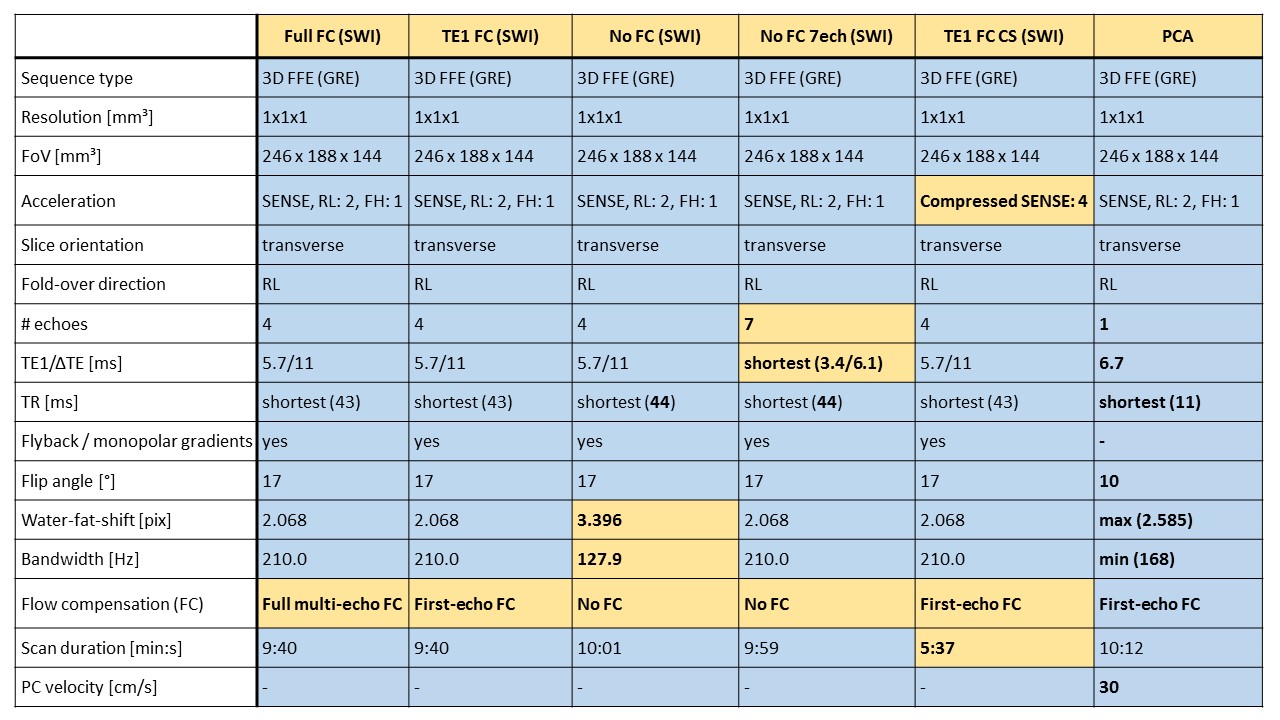
Table 1: Acquisition parameters for all gradient recalled echo (GRE) susceptibility
weighted imaging (SWI) sequences and phase contrast angiography (PCA). Parameters deviating from the most common value
are marked in bold. Differences between sequences relevant for QSM are highlighted
in yellow. These include differences in the FC scheme (influencing the bandwidth
/ water-fat-shift), the number of echoes and echo times, and the image acceleration
technique (influencing the scan duration).
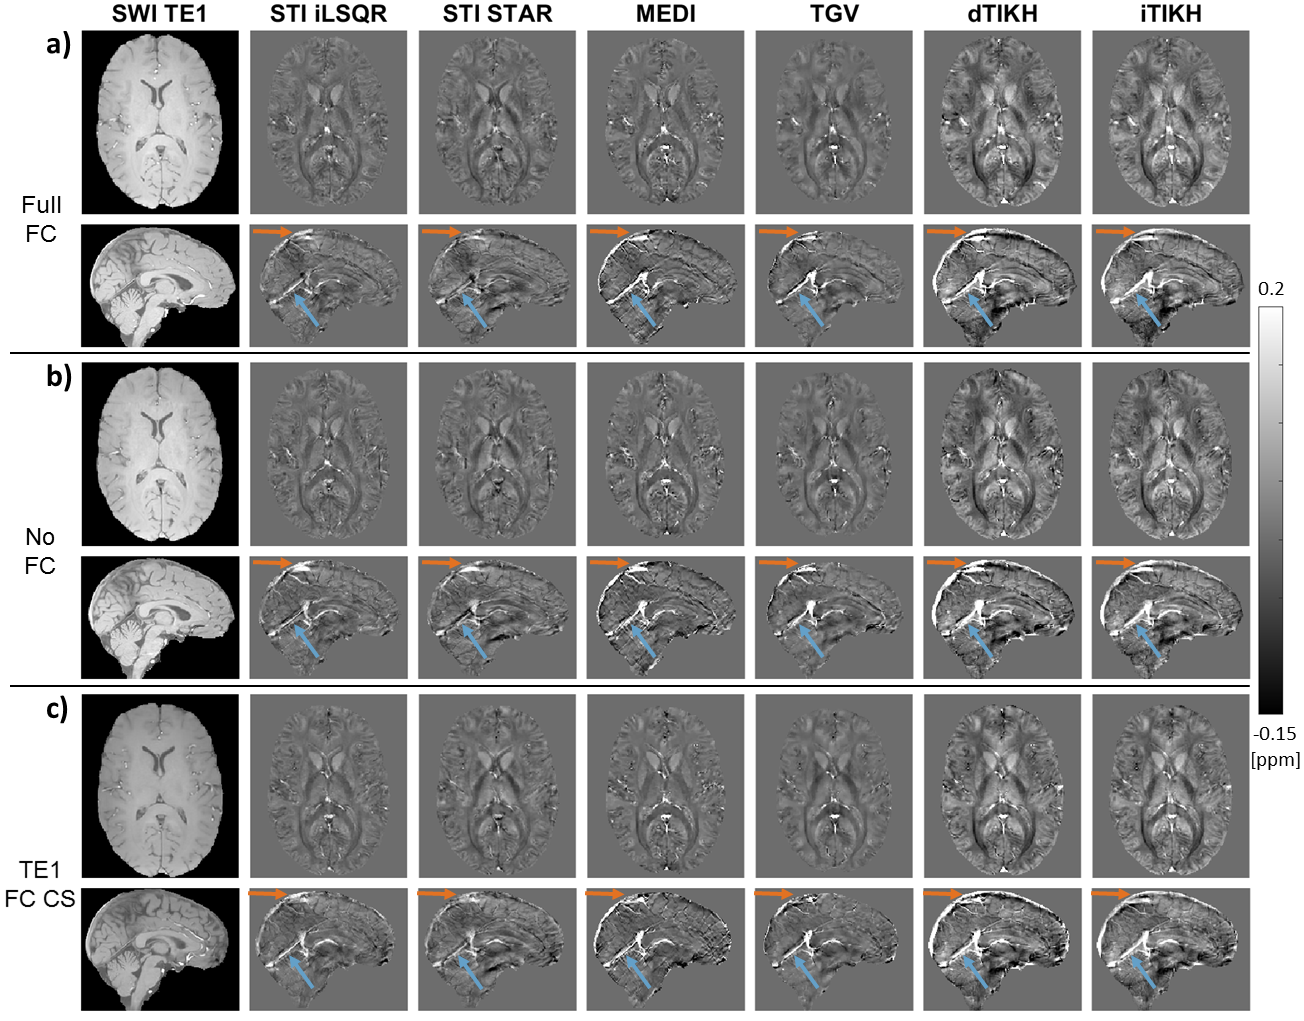
Figure 1: First-echo magnitude images and susceptibility
maps from different QSM reconstruction methods (columns) in a representative healthy subject.
The same axial and sagittal slices are shown for a) Full FC, b) No FC, and c) TE1
FC CS sequences (rows). Differences between the six QSM methods are clearly
visible in the extent of brain erosion (orange arrows), the delineation of the
straight sinus (blue arrows), and the contrast between various brain tissues. First-echo
magnitude data (first column) are shown in arbitrary units and scaled within
the same intensity range.
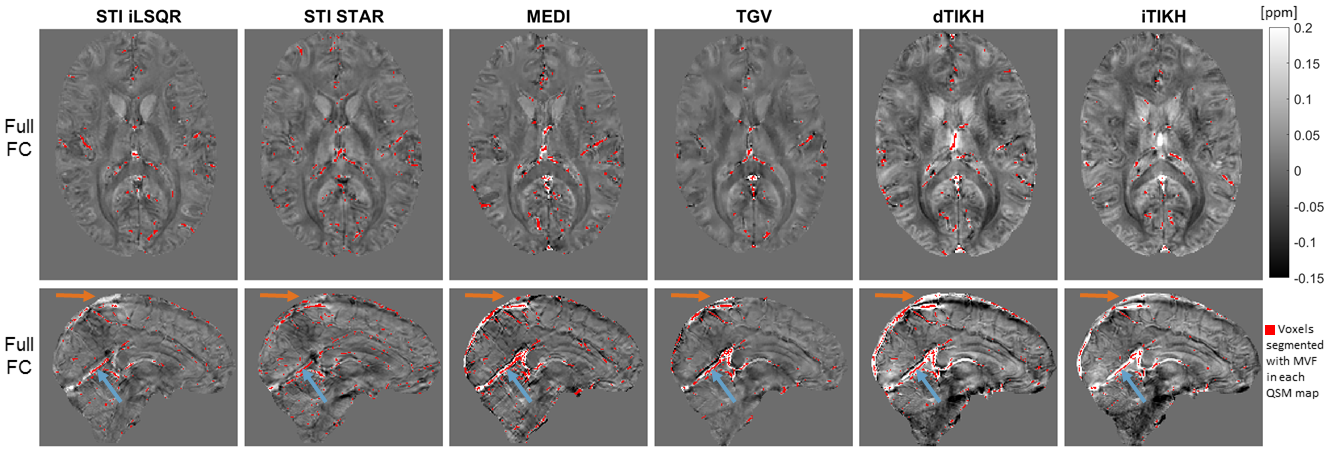
Figure 2: MVF-based vein segmentations (red) on different
susceptibility maps in a representative healthy subject. The same axial and sagittal slices are shown for
each QSM reconstruction (columns) of
the Full FC data. In all susceptibility maps, some high susceptibility voxels
within venous areas such as the straight sinus (blue arrows) or the superior
sagittal sinus (orange arrows) were segmented as veins. However, the number and
the location of automatically segmented “venous” voxels differed for the
various QSM methods.
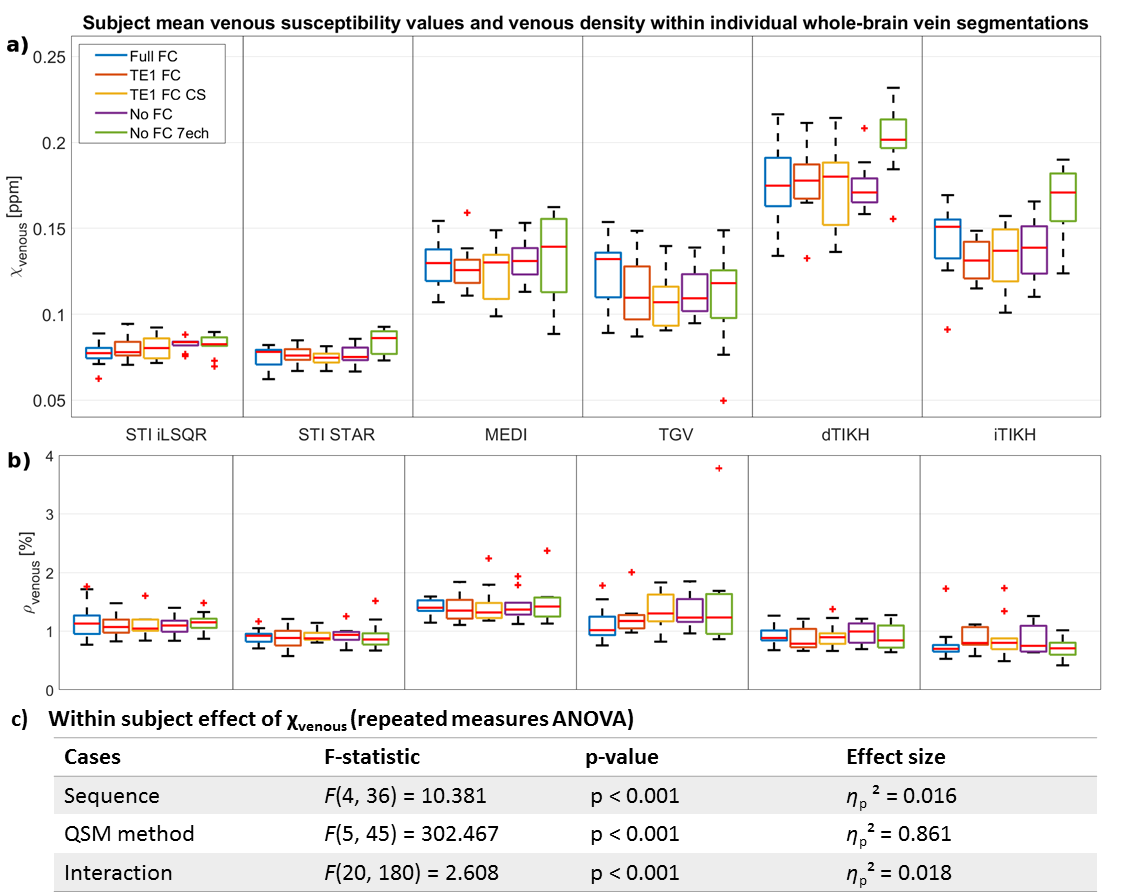
Figure 3: Boxplots of subject mean whole-brain a)
venous susceptibility and b) venous density from five different acquisition
sequences (different colors) and six QSM methods (columns) and c) statistical
analysis. Subject
mean values were calculated across all voxels obtained from multiscale vessel
filtering (MVF) on individual susceptibility maps within a common minimum-size brain
mask. Differences in subject mean venous susceptibility are greater for
different QSM reconstruction methods (effect size ηp2=0.861)
than for different acquisition settings (ηp2=0.016).
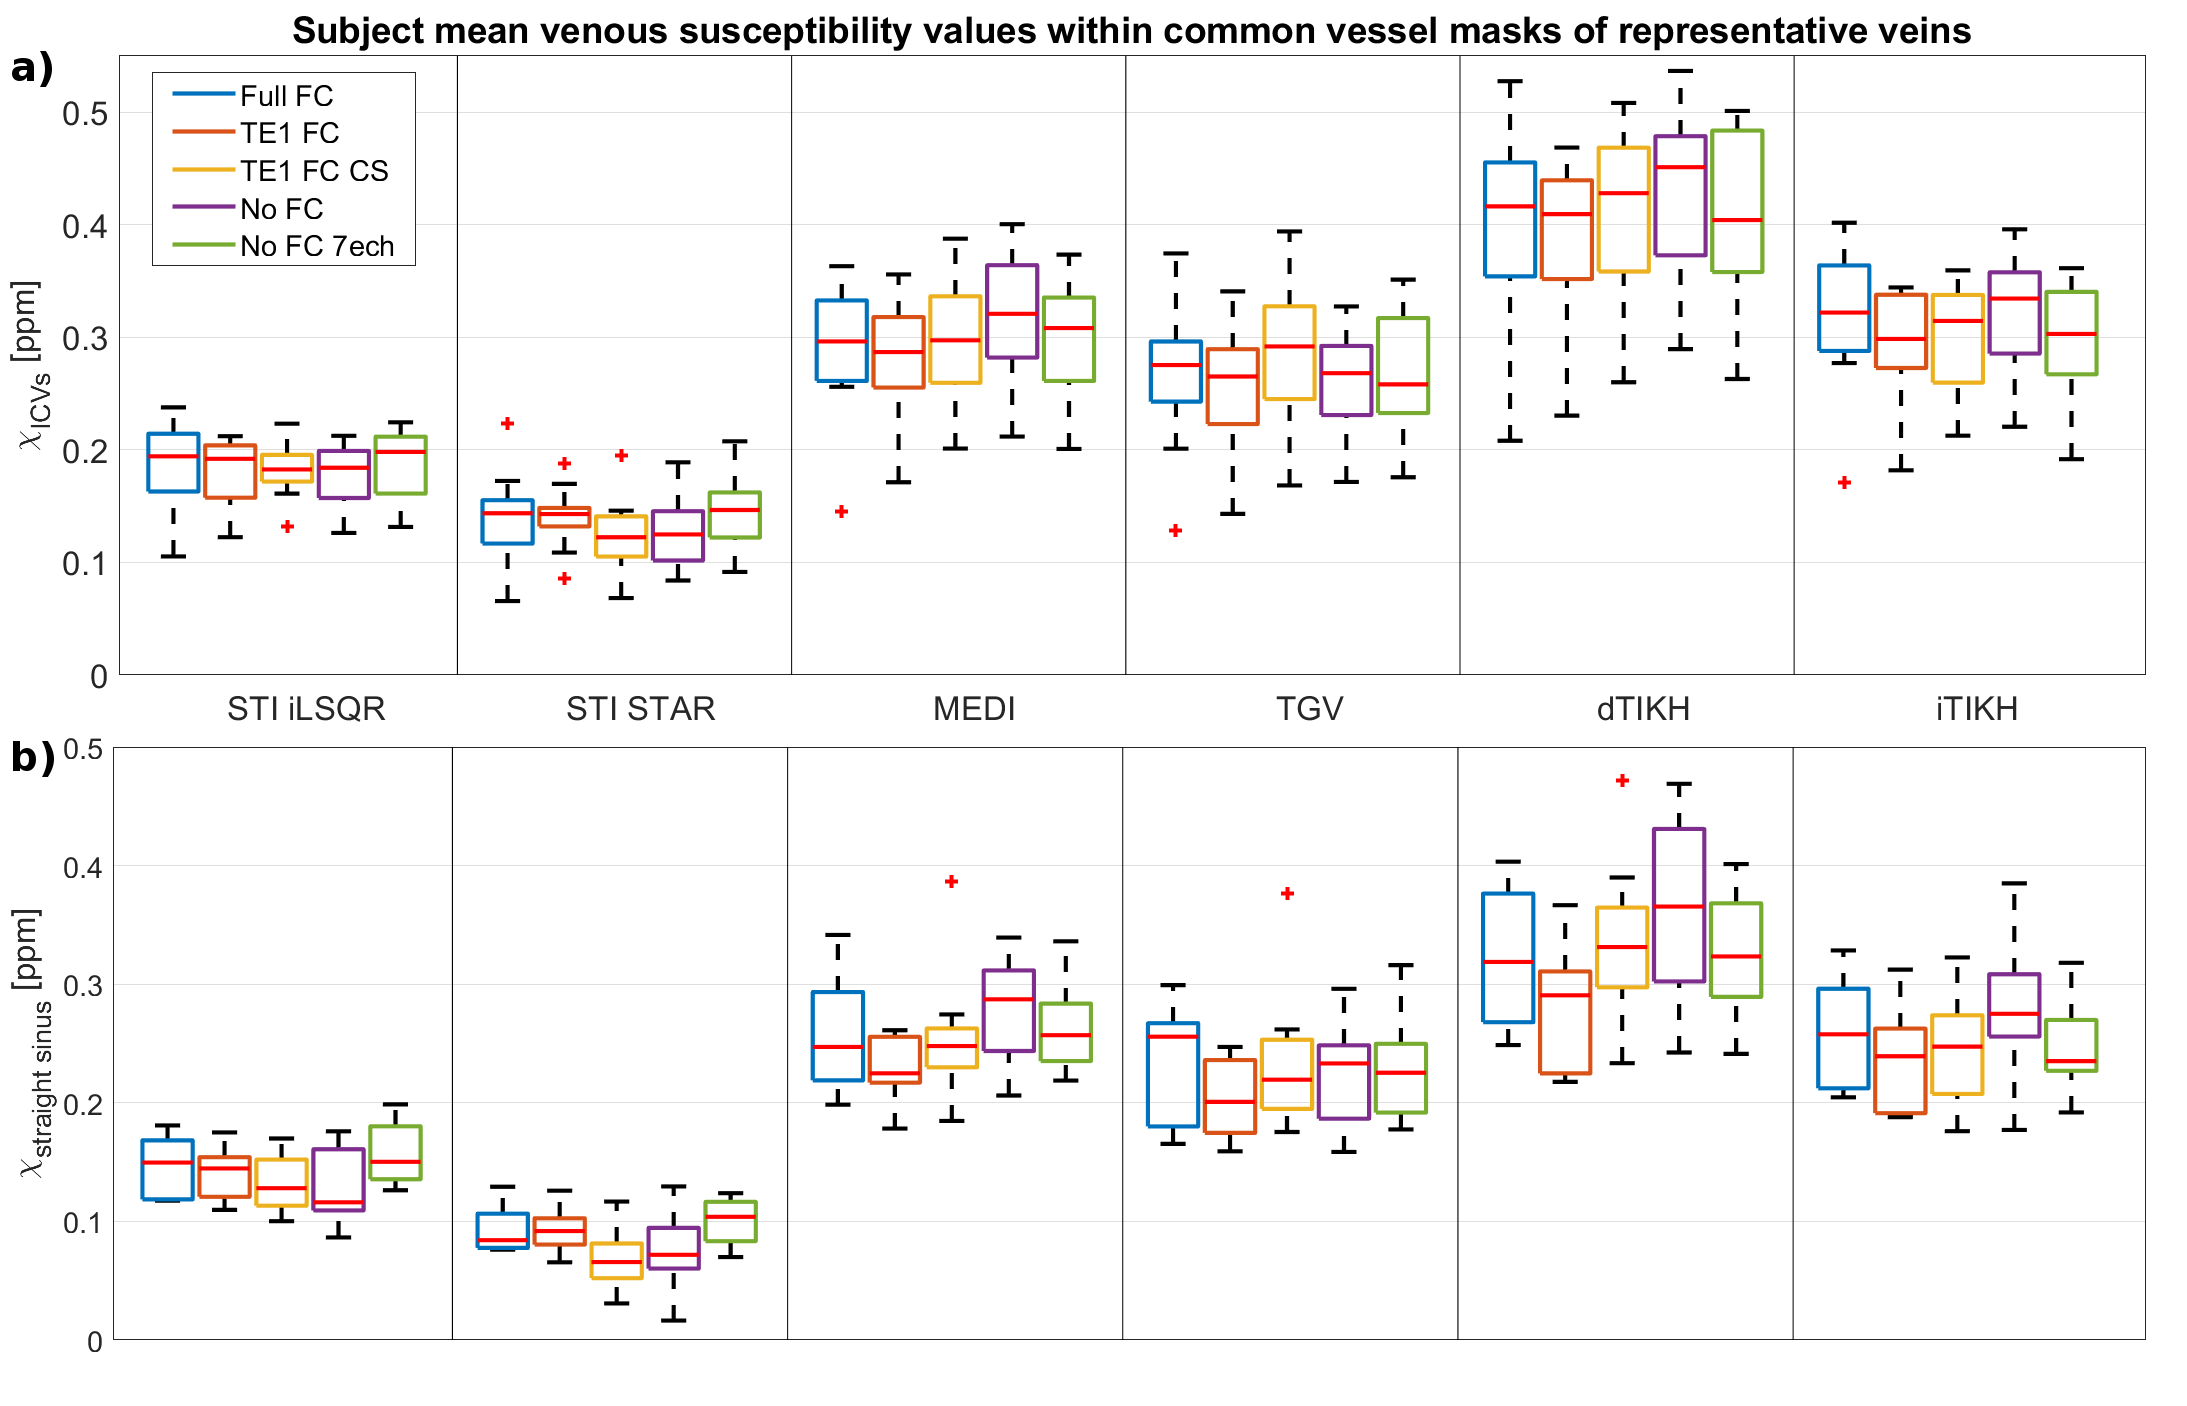
Figure 4: Boxplots of subject mean venous
susceptibility within vessel masks of a) the internal cerebral veins and b) the
straight sinus based on manual segmentations of the PCA data. Comparison of results from five different
acquisition sequences (different colors) and six QSM reconstruction methods
(columns). Differences in subject mean susceptibility values within common
masks of representative veins are much greater for different QSM reconstruction
methods than for different imaging sequences.