3972
Quantitative susceptibility mapping in water–fat regions using in-phase echoes introduces significant quantification bias1Department of Diagnostic and Interventional Radiology, School of Medicine, Klinikum rechts der Isar, Technical University of Munich, Munich, Germany, 2Division of Infectious Diseases and Tropical Medicine, University Hospital, LMU Munich, Munich, Germany, 3Philips Research Lab, Hamburg, Germany, 4Philips Healthcare, Hamburg, Germany
Synopsis
Gradient echo imaging using in-phase echoes has been proposed to reduce the field-map estimation in water–fat regions to a convex nonlinear least squares problem. However, it is known that the fat spectrum is complex and the definition of in-phase echo times remains problematic. In this work, the in-phase assumption is compared to standard water–fat imaging with respect to field- and quantitative susceptibility-mapping. The in-phase assumption is shown to be associated with quantification bias when subsequently estimating the field map and magnetic susceptibility in the spine, the liver and the breast.
Introduction
Quantitative susceptibility mapping (QSM)1 has been applied in tissues outside the brain, e.g. for measuring liver iron overload2,3,4, bone density5,6 and the characterization of carcinoma and calcifications in breast disease7,1 .In parallel, proton density fat fraction (PDFF) mapping has been proposed in the same anatomies for the assessment of nonalcoholic fatty liver disease8, osteoporosis9 and for the assessment of breast density as a biomarker for the risk to develop breast cancer.Gradient$$$\:$$$echo imaging using only in-phase$$$\:$$$echoes has been proposed for the estimation of susceptibility in the body. When using$$$\:$$$in-phase echoes the signal model$$$\:$$$is assumed to be convex within the period of the phasor and the fieldmap can robustly be estimated using nonlinear least squares techniques. However, the$$$\:$$$in-phase assumption assumes only$$$\:$$$a single fat peak and does not account for the spectral complexity of$$$\:$$$the fat phasor. Further,$$$\:$$$the ability to simultaneously estimate the PDFF map$$$\:$$$is limited while the scan time remains similar.
In$$$\:$$$this work the quantification bias$$$\:$$$of$$$\:$$$the in-phase assumption with respect to field- and susceptibility-mapping is investigated in$$$\:$$$a numerical lumbar spine simulation and invivo in the spine, the liver and the breast. The aim is to specifically show$$$\:$$$how the error in the fat phasor estimation directly translates into$$$\:$$$a fieldmap and susceptibility error.
Methods
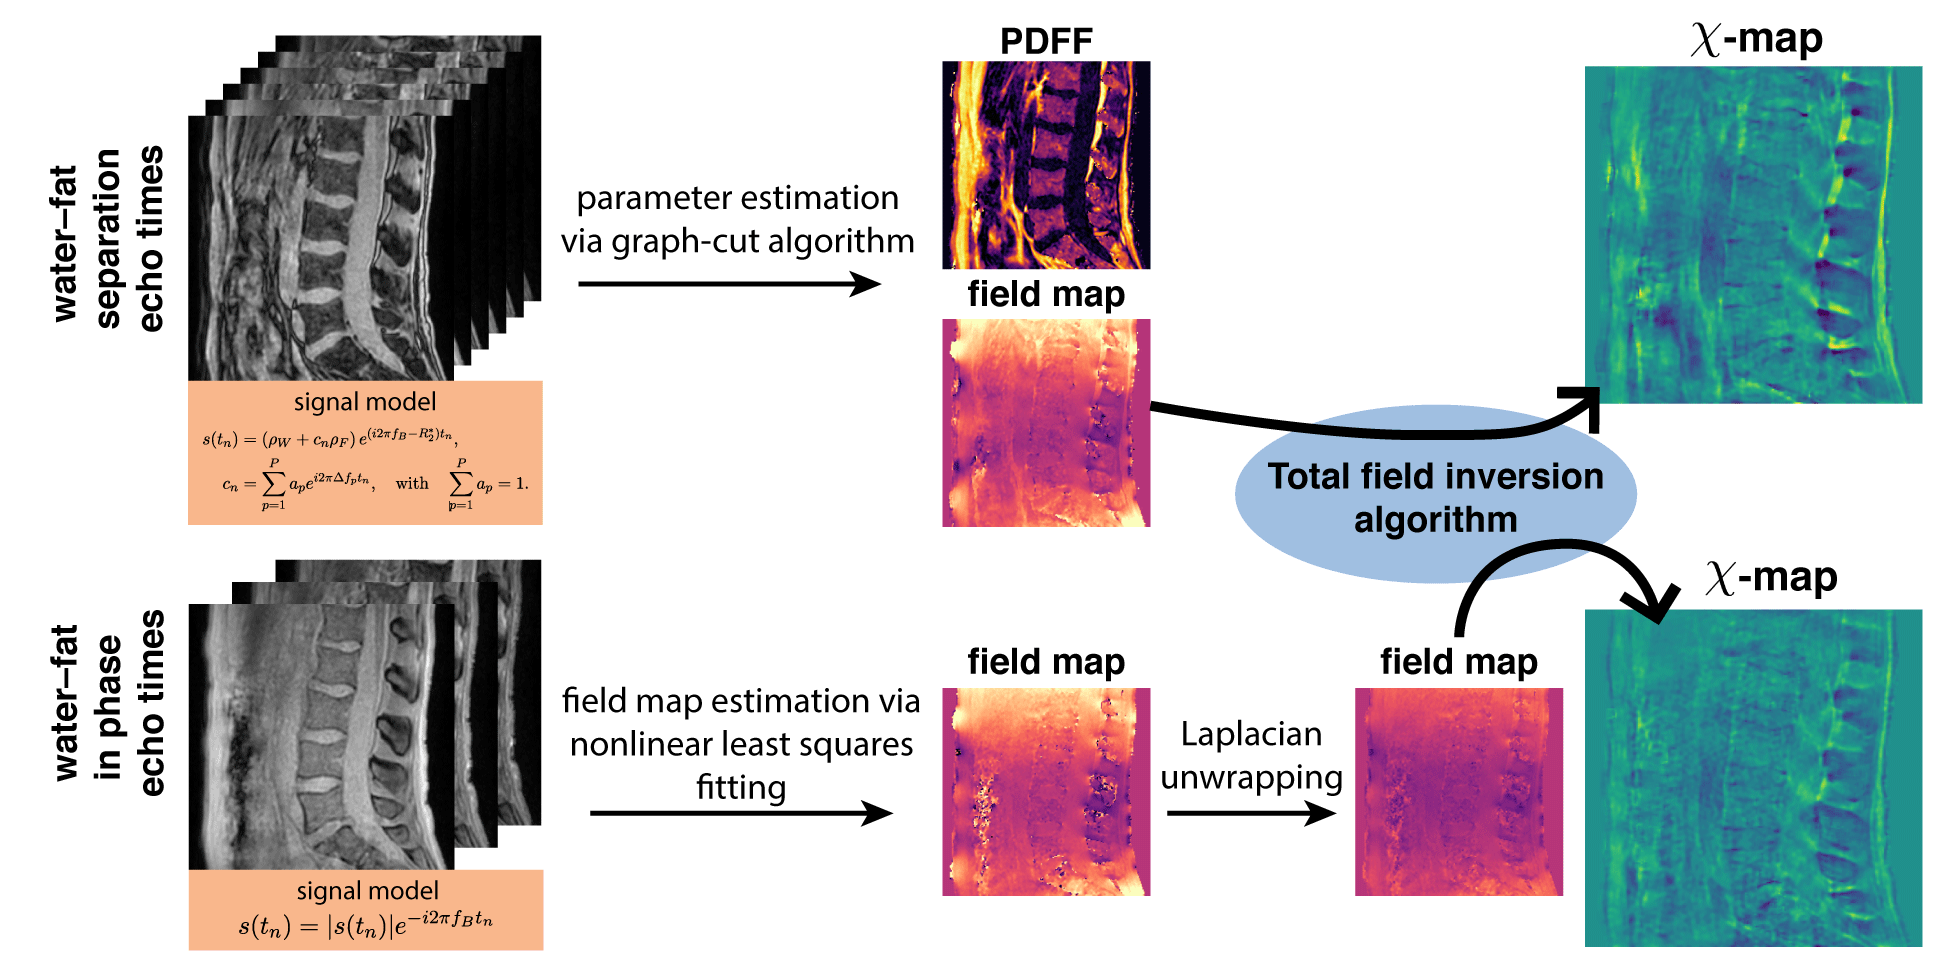
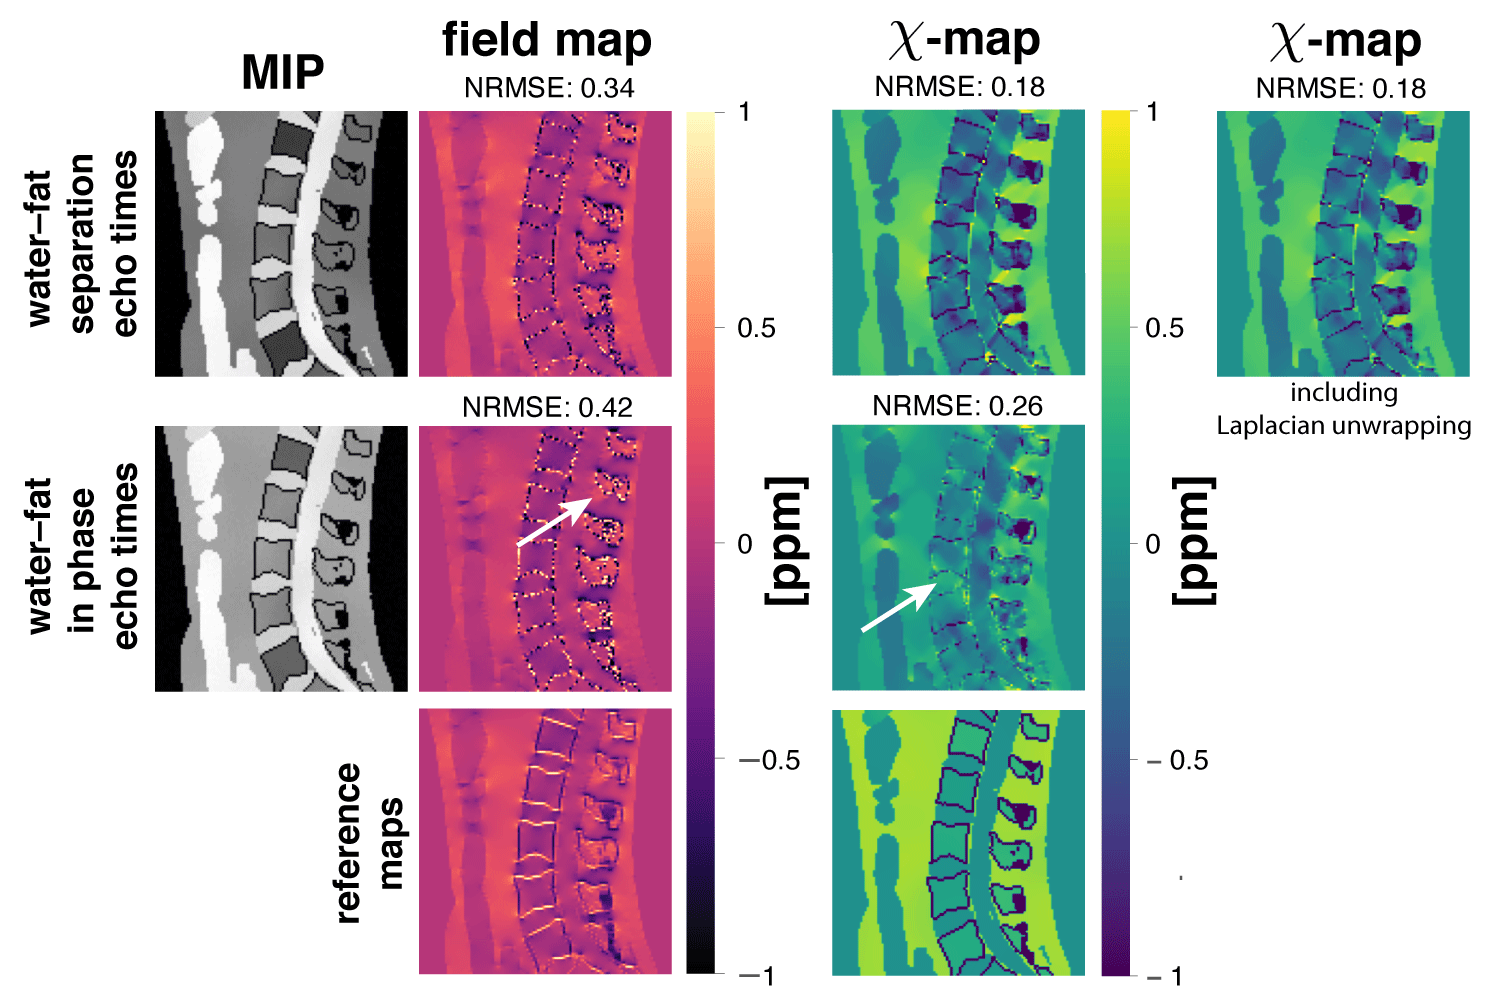
Numerical lumbar spine simulationTo$$$\:$$$investigate the quantification bias, a numerical simulation based$$$\:$$$on the Duke phantom was performed similar to10. The whole body mesh data were converted into a three-dimensional$$$\:$$$volume corresponding to maps of$$$\:{1.5}\:$$$mm$$$^3\:$$$isotropic resolution. Each tissue was assigned with either$$$\:$$$their literature value or values extracted from invivo scans. A fat fraction-,$$$\:{R}_2^*-\:$$$and$$$\:\chi$$$-map were generated and forward simulated to complex multi-echo data using conventional water–fat separation echo times with$$$\:{6}\:$$$echoes,$$$\:\text{TE}_{\text{min}}=1.3\:$$$ms and$$$\:\Delta{\text{TE}}=1\:$$$ms and$$$\:{3}\:$$$in-phase echos with$$$\:\text{TE}_{\text{min}}=2.3\:$$$ms and$$$\:\Delta{\text{TE}}=2.3\:$$$ms and a multi-peak fat model specific to$$$\:$$$bone marrow. A background field was not simulated to allow for the estimation of the quantification bias of the local fieldmap only. Gaussian$$$\:$$$noise was added to the real and imaginary part of the echo data with an SNR of$$$\:{100.}\:$$$The fieldmap, water–fat-images and$$$\:R_2^*$$$-map from conventional water–fat echo times were estimated using$$$\:$$$a recently proposed graph-cut algorithm11. The fieldmap from$$$\:$$$in-phase echoes was estimated using nonlinear least squares fitting. The fieldmaps$$$\:$$$of the above methods were inverted to a susceptibility$$$\:$$$mapping using a total field inversion (TFI)13 algorithm.$$$\:$$$To assure that the driver for the bias is not solely the Laplacian unwrapping, QSM based on$$$\:$$$water–fat separation echo times was$$$\:$$$additionally performed including Laplacian$$$\:$$$unwrapping.
Invivo measurements
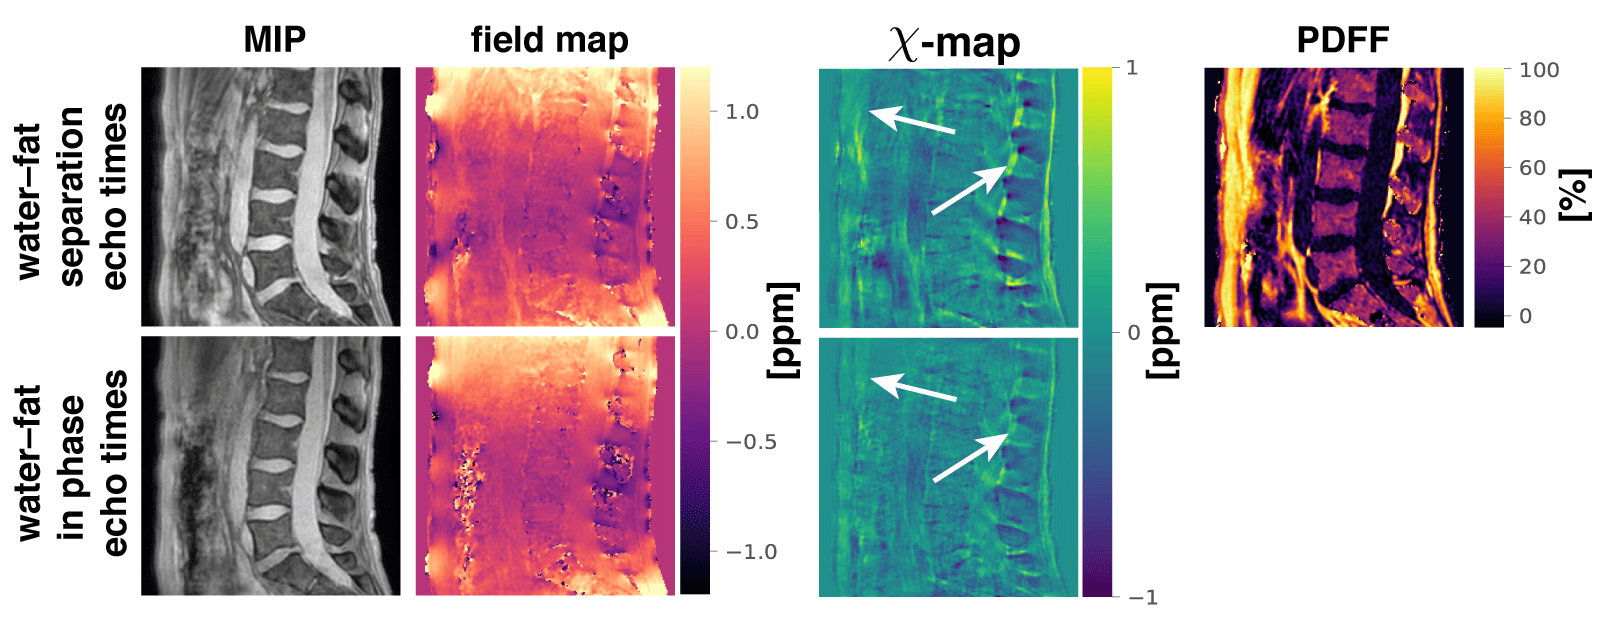
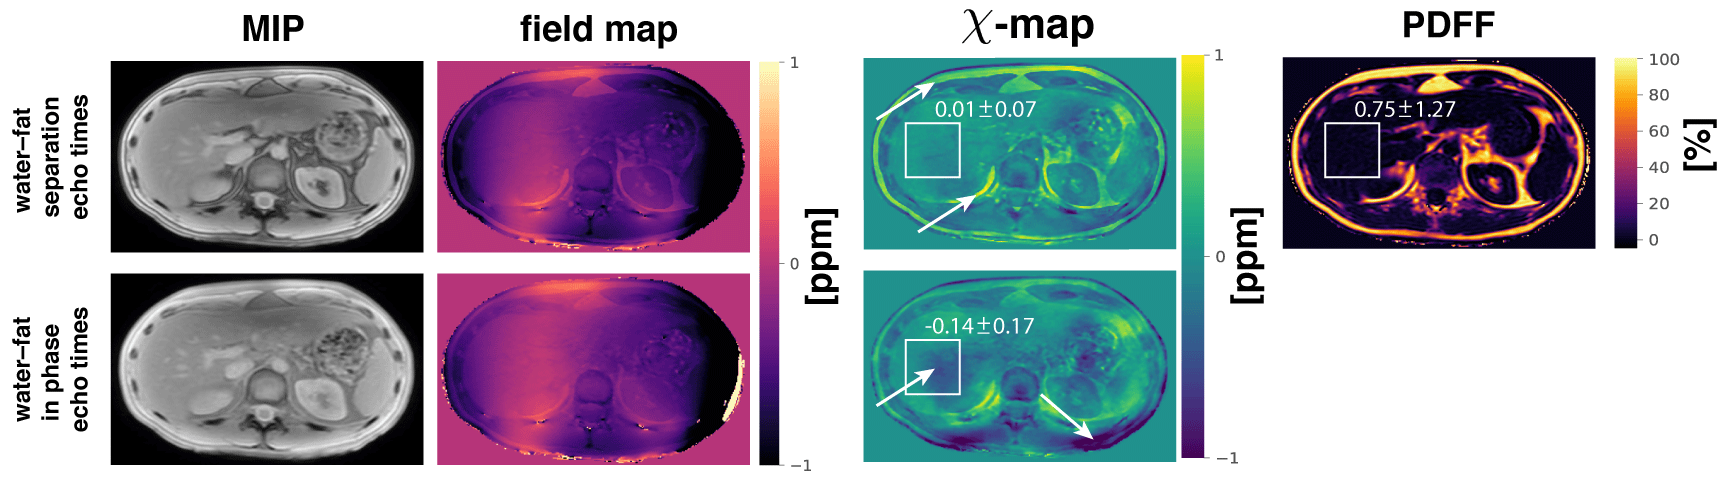
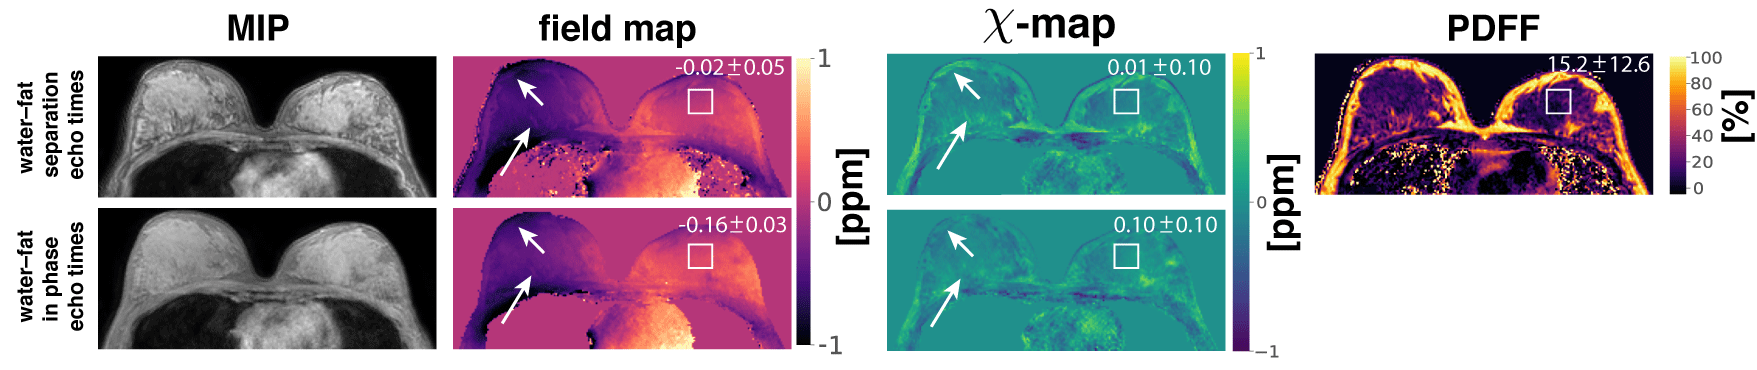
The$$$\:$$$aformentioned$$$\:$$$processing$$$\:$$$of$$$\:$$$graph-cut-based$$$\:$$$field-mapping and$$$\:$$$water–fat$$$\:$$$separation$$$\:$$$and$$$\:$$$linear$$$\:$$$least$$$\:$$$squares fitting for water–fat echo$$$\:$$$times$$$\:$$$and in-phase echoes, respectively, followed by TFI QSM was applied to invivo spine, liver and breast scan of$$$\:{3}\:$$$healthy volunteers and is depicted in Fig.1. Additionally, Laplacian unwrapping12 was used to unwrap$$$\:$$$the$$$\:$$$fieldmap estimated from in-phase echoes. The fieldmap estimated by the graph-cut is inherently unwrapped and needed$$$\:$$$no$$$\:$$$further$$$\:$$$processing.$$$\:$$$Scanning was performed on a$$$\:3\:$$$T scanner (Ingenia, Philips Healthcare) using a monopolar time-interleaved multi-echo gradient echo sequence14. The spine was scanned with an isotropic voxel size of$$$\:1.8\:$$$mm,$$$\:\text{TE}_{\text{min}}=1.3\:$$$ms and$$$\:\Delta\text{TE}=1\:$$$ms acquiring$$$\:{6}\:$$$echoes with$$$\:{3}\:$$$echoes per interleave for water–fat separation echo times and $$$\text{TE}_{\text{min}}=2.3\:$$$ms and$$$\:\Delta\text{TE}=2.3\:$$$ms for the in-phase echoes acquiring$$$\:{3}\:$$$echoes in total. The above in-phase echo times were used in all subsequent scans. The liver was scanned in a single breath-hold with a voxel-size of$$$\:1.1\times{1.1}\times{6}\:\text{mm}^3$$$,$$$\:\text{TE}_{\text{min}}=1.2\:$$$ms,$$$\:\Delta\text{TE}=1\:$$$ms acquiring$$$\:{6}\:$$$echoes with$$$\:{3}\:$$$echoes per interleave for water–at separation echo times and a compressed sensing factor of$$$\:{6.}\:$$$The breast was scanned with an isotropic voxel-size of$$$\:1.3\:$$$mm,$$$\text{TE}_{\text{min}}=1.65\:$$$ms,$$$\:\Delta\text{TE}=1.35\:$$$ms acquiring 6 echoes with$$$\:{3}\:$$$echoes per interleave for water–fat separation echo times and a compressed sensing factor of$$$\:{4.}\:$$$The resulting field- and $$$\chi$$$-maps were visually and quantitatively examined for quantification bias.
Results
Field- and susceptibility-mapping$$$\:$$$yield a significant normalized root mean$$$\:$$$square error (NRMSE) increase of 24% and 44%, respectively, when$$$\:$$$compared to estimation with water–fat separation echo times (Fig.2). Laplacian$$$\:$$$unwrapping shows no significant impact$$$\:$$$when additionally performed yielding the same NRMSE. Further, the$$$\:\chi$$$-map estimated from in-phase echoes$$$\:$$$shows a significant decrease in contrast between fat and other tissue and$$$\:$$$the depiction of the cortical bone is limited. The$$$\:\chi$$$-map of a invivo spine (Fig.3) based on in-phase echo times$$$\:$$$shows a significant decrease in contrast, especially between$$$\:$$$fat and other tissue. In the invivo liver scan(Fig.4), the$$$\:$$$field- and susceptibility-map based on in-phase echoes significantly reduces contrast for vessels and show increased heterogeneity$$$\:$$$when compared to the$$$\:$$$susceptibility map based on water–fat echo times.$$$\:$$$In an in vivo breast (Fig.5), the contrast in the left breast between fat and fibroglandular tissue is lost in QSM and$$$\:$$$the fieldmap when using the in-phase echo times.$$$\:$$$The susceptibility value negatively$$$\:$$$correlates with the fieldmap quantification bias when$$$\:$$$using the in phase echo times.Discussion
In addition to the loss of$$$\:$$$valuable PDFF information in the body QSM methodology, the in-phase field-mapping may not reduce the$$$\:$$$total scan time.The use$$$\:$$$of in-phase echoes introduces$$$\:$$$significant bias in the fieldmap,$$$\:$$$which, importantly, is voxel-wise dependent on the fat$$$\:$$$fraction. In fat containing anatomies with variable$$$\:$$$fat fractions in the FOV such fieldmap biases$$$\:$$$propagate nonlocally into the QSM result.$$$\:$$$The nonlocal propagation of fat-fraction dependent$$$\:$$$fieldmap biases leads to systematic errors$$$\:$$$even in susceptibility regions where the underlying$$$\:$$$voxels showed no fieldmap bias.
The simulation results$$$\:$$$showed that the biases introduced by the employed$$$\:$$$Laplacian unwrapping method is negligible $$$\:$$$in comparison to the bias introduced$$$\:$$$by the in-phase assumption.
Conclusion
In conclusion, the use of in-phase echo times (a) introduces quantification bias in the fieldmap and QSM, (b) limits the estimation of valuable fat fraction information and (c) shows no clear advantages when compared to standard water–fat echo times for body QSM.Acknowledgements
The present work was supported by the EuropeanResearch Council (grant agreement No 677661, Pro-FatMRI). This work reflects only the authors viewand the EU is not responsible for any use that may bemade of the information it contains. The authors alsoacknowledge research support from Philips Healthcare.References
[1] Wang Y, Liu T. Quantitative Susceptibility Mapping (QSM): Decoding MRI Data for a Tissue Magnetic Biomarker. Magnetic Resonance in Medicine 2014; 73:82–101. 10.1002/mrm.25358.
[2] Sharma SD, Hernando D, Horng DE, Reeder SB.Quantitative Susceptibility Mapping in the Abdomen As an Imaging Biomarker of Hepatic Iron Overload. Magnetic Resonance in Medicine2014; 74:673–683. 10.1002/mrm.25448.
3] Lin H, Wei H, He N, Fu C, Cheng S, Shen J,Wang B, Yan X, Liu C, Yan F. Quantitative Susceptibility Mapping in Combination With Water–Fat Separation for Simultaneous Liver Iron and Fat Fraction Quantification. European Radiology 2018; 28:3494–3504. 10.1007/s00330-017-5263-4.
[4] Jafari R, Sheth S, Spincemaille P, Nguyen TD,Prince MR, Wen Y, Guo Y, Deh K, Liu Z, Margolis D, Brittenham GM, Kierans AS, Wang Y.Rapid Automated Liver Quantitative Susceptibility Mapping. Journal of Magnetic Resonance Imaging 2019; 50:725–732. 10.1002/jmri.26632.
[5] Dimov AV, Liu Z, Spincemaille P, Prince MR,Du J, Wang Y. Bone Quantitative Susceptibility Mapping Using a Chemical Species-Specific R2*Signal Model With Ultrashort and Conventional Echo Data. Magnetic Resonance in Medicine2017; 79:121–128. 10.1002/mrm.26648.
[6] Diefenbach MN, Meineke J, Ruschke S, Baum T,Gersing A, Karampinos DC. On the Sensitivity of Quantitative Susceptibility Mapping for Measuring Trabecular Bone Density. Magnetic Resonance in Medicine 2018; . 10.1002/mrm.27531.
[7] Schweser F, Hermann KH, Deistung A, Atter-bury M, Baltzer PA, Burmeister HP, Kaiser WA,Reichenbach JR. Quantitative Magnetic Susceptibility Mapping (QSM) in Breast Disease Reveals Additional Information for MR-Based Characterization of Carcinoma and Calcification. In: Proceedings 19. Annual Meeting International Society for Magnetic Resonance in Medicine, Montreal, 2011. p. 1014.
[8] Caussy C, Reeder SB, Sirlin CB, Loomba R.Noninvasive,Quantitative Assessment of Liver Fat by MRI-PDFF as an Endpoint in NASH Trials. Hepatology 2018; 68:763–772.https://doi.org/10.1002/hep.29797.
[9] Rosen CJ, Bouxsein ML. Mechanisms of Disease:Is Osteoporosis the Obesity of Bone? Nature Clinical Practice Rheumatology 2006; 2:35–43.10.1038/ncprheum0070.
[10] Gosselin MC, Neufeld E, Moser H, Huber E,Farcito S, Gerber L, Jedensjö M, Hilber I, Gennaro FD, Lloyd B, Cherubini E, Szczerba D,Kainz W, Kuster N. Development of a New Generation of High-Resolution Anatomical Models for Medical Device Evaluation: the Vir-tual Population 3.0. Physics in Medicine andBiology 2014; 59:5287–5303.10.1088/0031-9155/59/18/5287.
[11] Boehm C, Diefenbach MN, Makowski MR,Karampinos DC.Improved Body Quantitative Susceptibility Mapping By Using a Variable-layer Single-min-cut Graph-cut for Field-mapping. Magnetic Resonance in Medicine2020; nil:mrm.28515. 10.1002/mrm.28515.
[12] Li W, Avram AV, Wu B, Xiao X, Liu C. Inte-grated Laplacian-Based Phase Unwrapping and Background Phase Removal for Quantitative Susceptibility Mapping. NMR in Biomedicine2013; 27:219–227.
[13] Liu Z, Kee Y, Zhou D, Wang Y, Spincemaille P. Preconditioned Total Field Inversion (tfi) Method for Quantitative Susceptibility Mapping. Magnetic Resonance in Medicine2016; 78:303–315. 10.1002/mrm.26331.
[14] Ruschke S, Eggers H, Kooijman H, Diefen-bach MN, Baum T, Haase A, Rummeny EJ,Hu HH, Karampinos DC. Correction of PhaseErrors in Quantitative Water–Fat Imaging Usinga Monopolar Time-Interleaved Multi-Echo Gra-dient Echo Sequence. Magnetic Resonance inMedicine 2016; 78:984–996. 10.1002/mrm.26485.
[15] Hopkins JA, Wehrli FW. Magnetic Suscep-tibility Measurement of Insoluble Solids ByNmr: Magnetic Susceptibility of Bone. Mag-netic Resonance in Medicine 1997; 37:494–500.10.1002/mrm.1910370404.
Figures