3971
Robust Masking Techniques for Multi-Echo Quantitative Susceptibility Mapping1Centre for Innovation in Biomedical Imaging Technology, University of Queensland, Brisbane, Australia, 2Centre for Advanced Imaging, University of Queensland, Brisbane, Australia, 3High Field MR Center, Department of Biomedical Imaging and Image-Guided Therapy, Medical University of Vienna, Vienna, Austria, 4Siemens Healthcare Pty Ltd, Brisbane, Australia, 5Department of Neurosurgery, Medical University of Vienna, Vienna, Austria, 6Clinical & Research Imaging Centre, South Australian Health and Medical Research Institute, Adelaide, Australia, 7Department of Radiation Oncology, Calvary Mater Hospital, Newcastle, Australia, 8School of Mathematical and Physical Science, University of Newcastle, Newcastle, Australia, 9School of Information Technology and Electrical Engineering, University of Queensland, Brisbane, Australia
Synopsis
Quantitative Susceptibility Mapping (QSM) is a post-processing technique applied to gradient-echo phase data. QSM generally requires a signal mask to identify reliable phase values before reconstruction. Most QSM pipelines do not include masking procedures, and often suggest masking techniques that introduce artefacts, work only in the human brain, and lose critical information, especially near strong susceptibility sources. We propose two novel echo-dependent masking strategies and find that they significantly reduce streaking artefacts, particularly surrounding strong sources and tissue boundaries in multi-echo data. Our techniques are open-source and implemented in a new framework for automated, scalable, and robust QSM processing.
Introduction
Quantitative susceptibility mapping (QSM) is a post-processing technique applied to gradient-echo (GRE) phase data that aims to measure the relative susceptibility distribution in an object1. QSM applications include brain imaging in Huntington’s Disease2, Multiple Sclerosis3,4,5,6, Alzheimer’s Disease7,8, and Parkinson’s Disease9,10, as well as applications outside the brain, including quantifying liver iron11,12, identifying calcifications in the prostate13, and imaging cartilage in joints14.Most QSM algorithms require a mask to identify reliable phase values before reconstruction, as including unreliable values can introduce pervasive streaking artefacts. Existing QSM techniques either do not generate a mask or suggest techniques that apply only in brain imaging. Further, although multi-echo acquisitions are preferable for QSM as they maximise SNR across multiple tissues, most QSM pipelines use only the first-echo to generate a mask, introducing streaking at later echoes due to rapid signal decay near the brain boundary. The signal also decays rapidly near strong susceptibility sources such as vessels and lesions, often causing further streaking. Finally, regions such as tumours require impractical hand-drawn or bespoke masking techniques13.
In this work, we present two novel masking techniques for QSM that mitigate streaking. The first is an echo-dependent application of the Brain Extraction Tool (BET) from the FMRIB Software Library (FSL)15. The second is a two-pass masking and QSM reconstruction technique, where the first pass reconstructs weaker susceptibility sources such as grey and white matter tissues, and the second reconstructs all sources, including strong sources such as veins, vessels, and lesions. A previously proposed technique, STAR QSM16, also reconstructs weak and strong sources independently before combining. However, our method does not require regularisation parameter tuning and additionally addresses the masking problem, making it applicable outside the brain. We integrated our developments into an open-source framework for fast, robust and automated QSM reconstruction for large scale datasets.
Methods
Data acquisitionWe tested processing in healthy volunteers using a dataset of 46 GRE datasets with TE=5.84/10.63/15.42/20.21/25ms and 1mm isotropic resolution using a MAGNETOM Skyra 3T scanner (Siemens Healthcare GmbH, Erlangen, Germany) with a 64-channel head/neck coil on software version VE11.
We also processed a GRE dataset of a tumour patient brain with TE=3.31/6.62/9.93/12.49/15.05/17.61/20.17/22.73/25.29/27.85 and 0.3x0.3x2.9mm resolution using a 7T whole-body research scanner (Siemens) with a 32-channel Rx head array coil (Nova Medical, Wilmington, MA, USA), on software version VB17. Coil data were combined using ASPIRE17.
We tested the processing of strong sources using the simulated brain dataset from the QSM challenge 2019 containing an intracranial lesion18. The simulation used k-space cropping with TE=4/12/20/28ms and 1mm isotropic resolution.
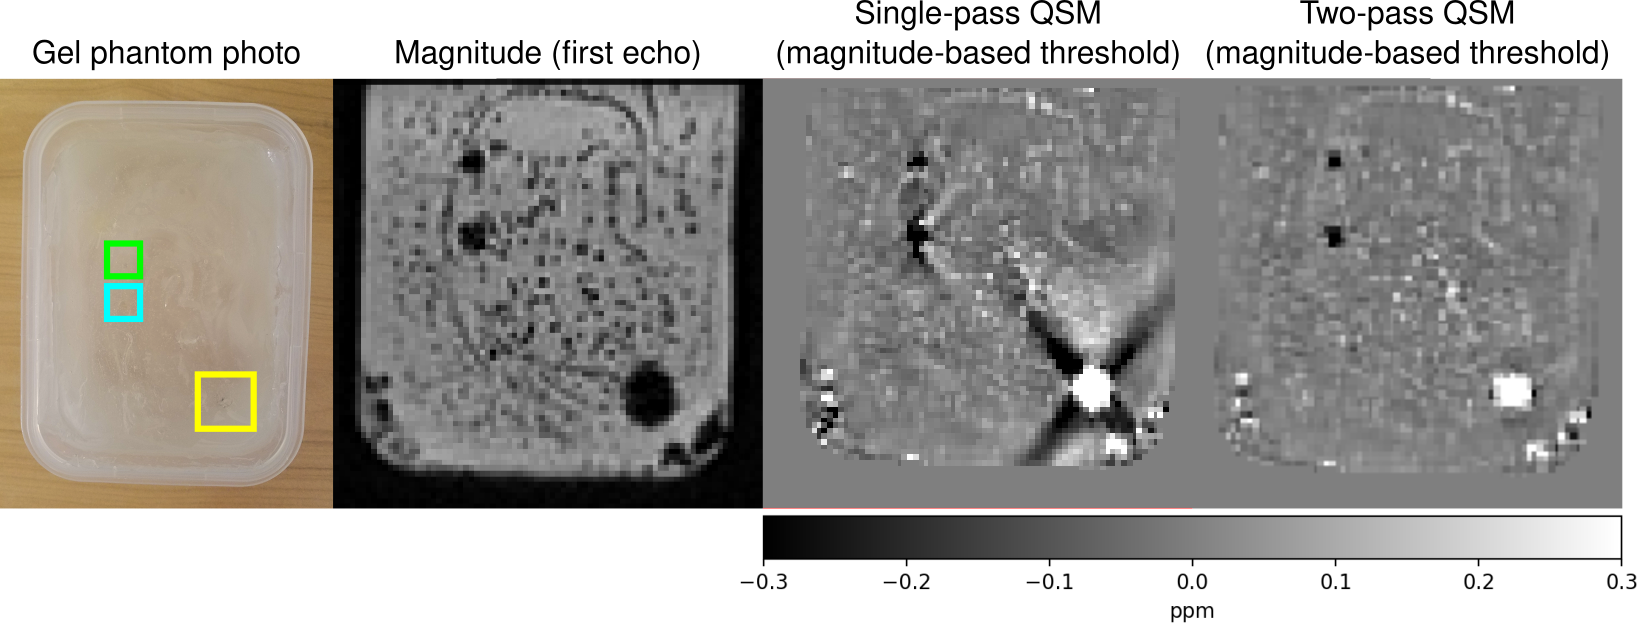
We tested robustness outside the brain using a GRE dataset of a gel phantom containing tooth pieces and gold seeds with TE=3.69/7.4/11.11/14.82ms and 1.1x1.1x1.2mm resolution using a 3T Skyra scanner (Siemens) with a 32-channel spine coil on software version VE11.
QSM Processing
We used the TGV-QSM algorithm19 for QSM reconstruction, as it is quantitatively stable across echo times compared to other QSM algorithms20.
Our first strategy applies BET to each echo magnitude image before QSM reconstruction and averaging. We compared this to the popular strategy of applying only the first-echo mask to all echoes [BET parameters: robust brain centre estimation; fractional intensity threshold 0.4].
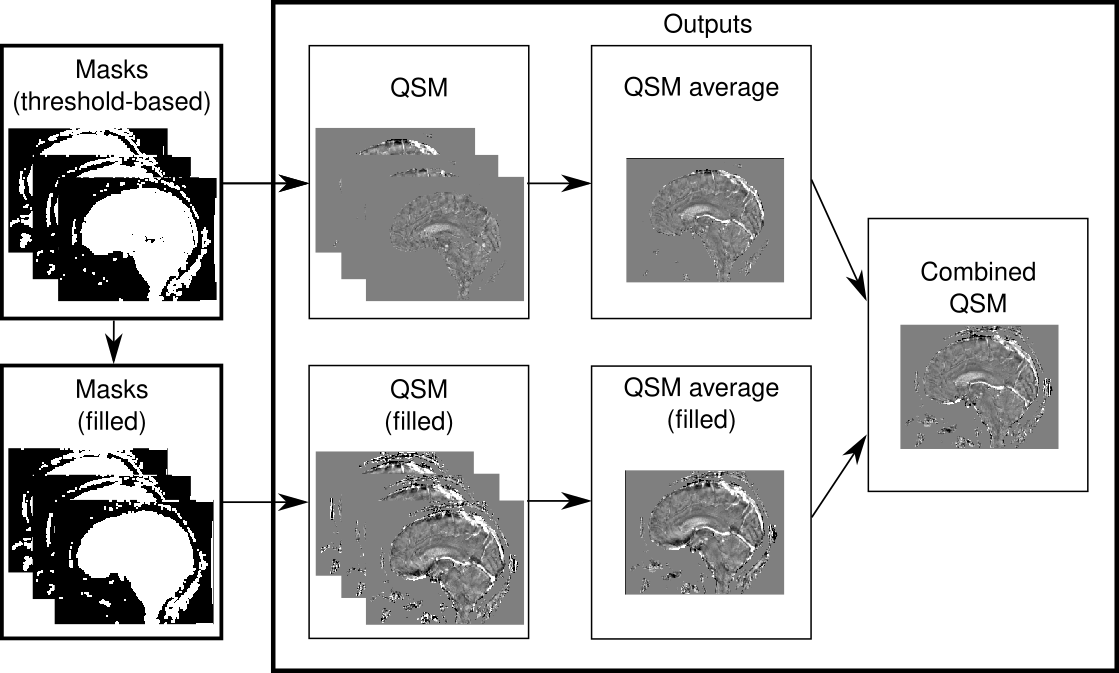
Our two-pass strategy performs two QSM reconstructions per echo, with the first including only subtle susceptibility sources, and the second including all sources (Figure 1). The first set of masks uses thresholded magnitude images, while the second applies morphological operations to fill gaps. Averages are produced for both sets of QSM images before combining them by filling missing values from the first using the second pass [threshold parameter; 35%].
Template building
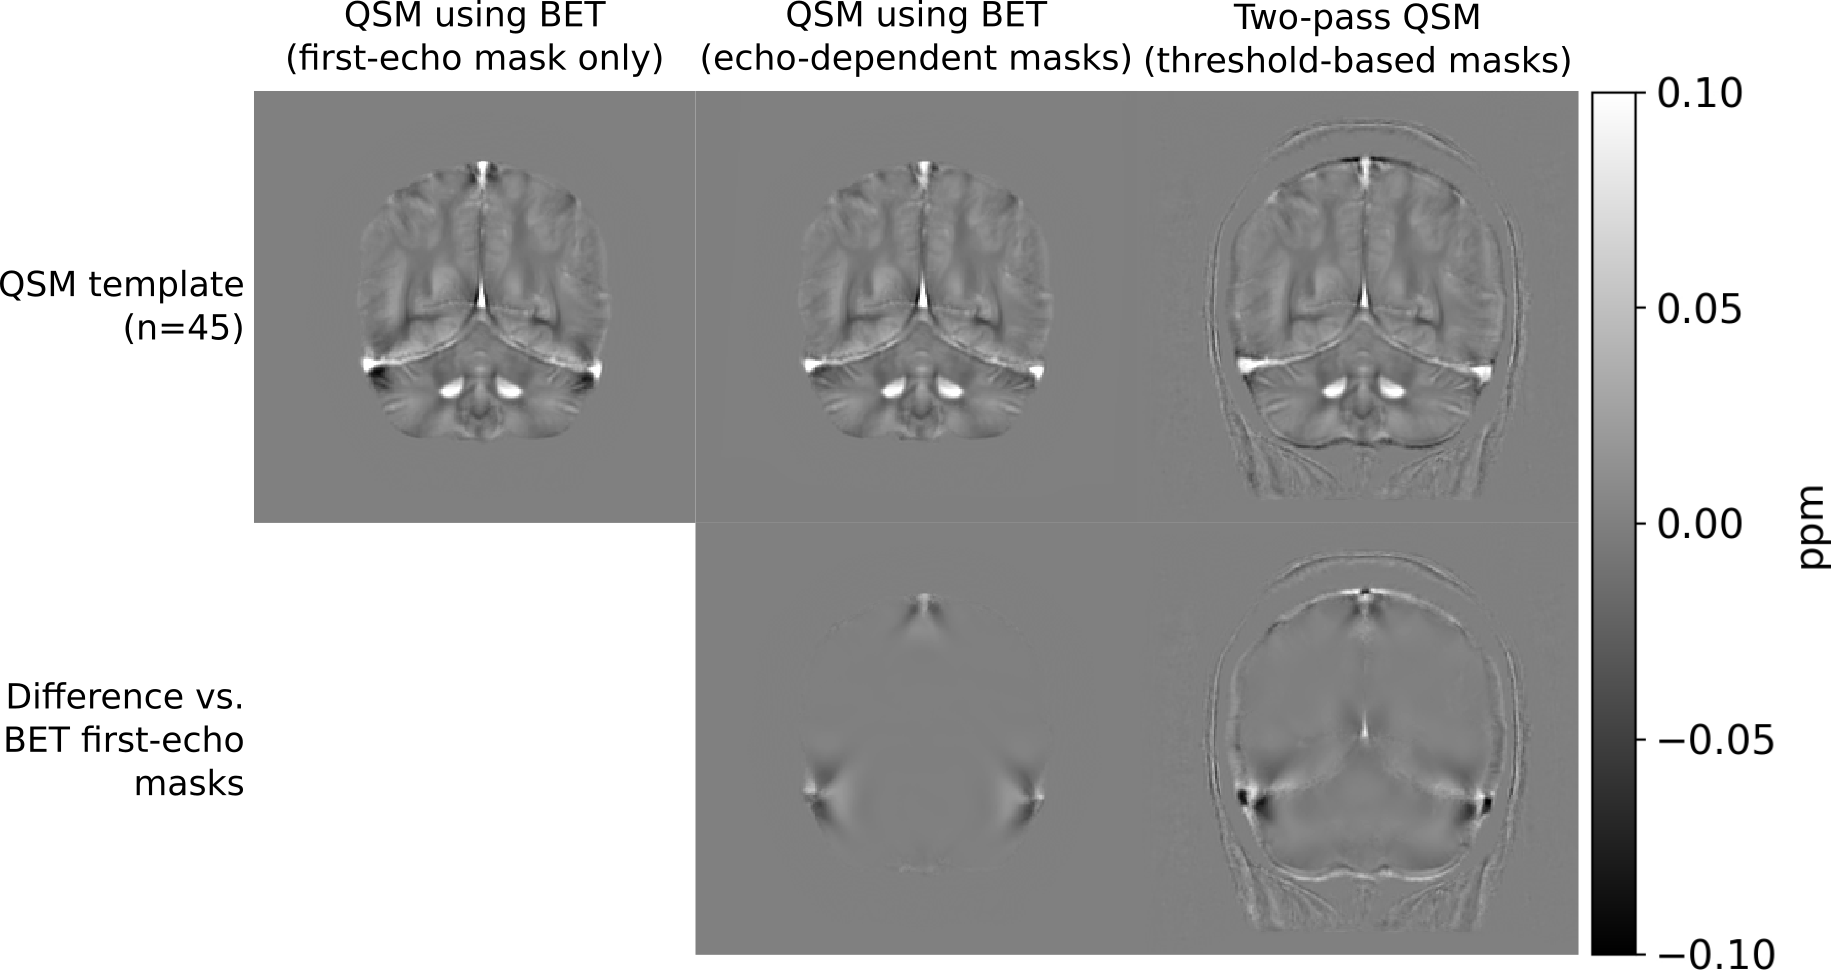
We used minimum deformation averaging to construct QSM templates of our healthy brain dataset for each masking technique21 (Figure 2).
Results
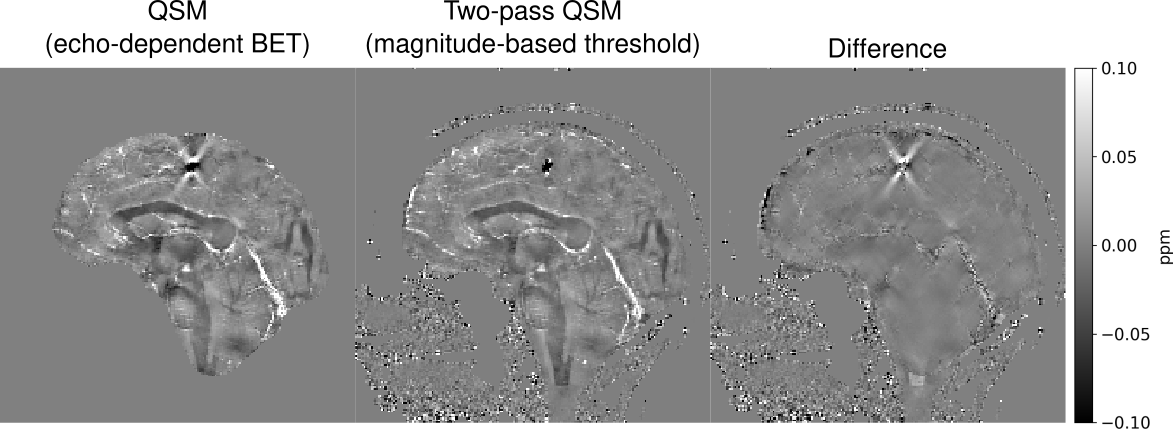
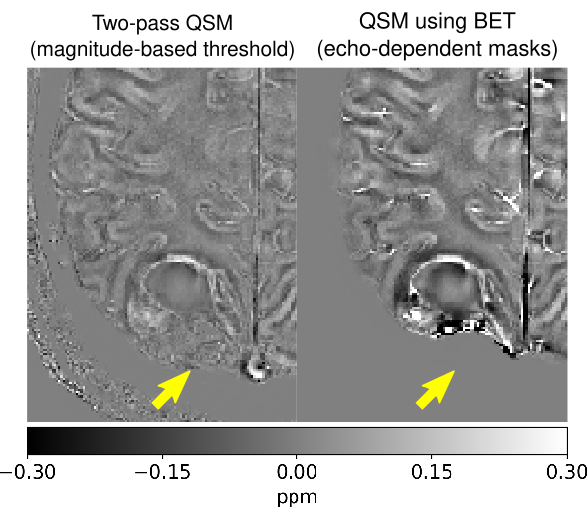
Figure 2 illustrates that echo-dependent masking mitigates the dipole-shaped streaking near the transverse and superior sagittal sinuses. Two-pass QSM provides a similar reduction, as well as changes near high susceptibility sources within the brain such as veins.Figures 3 and 4 illustrate how our two-pass QSM strategy mitigates streaking caused by strong sources. Our threshold-based masks also include more anatomical detail.
Figure 5 illustrates how threshold-based masking includes more complete tumour detail than BET.
Discussion
Our QSM templates demonstrate that echo dependent masking reduces artefacts near the brain boundary and sinuses, as the dipole-shaped streaks disappear using our technique.Our results using the QSM challenge and gel phantom datasets demonstrate that our two-pass strategy is robust in and outside of the brain, and mitigates streaking near strong sources. Additionally, our two-pass QSM results reconstruct the boundaries of strong sources with clarity, allowing for accurate interpretation, segmentation and analysis. Further, our thresholding operation masks pathological sources such as tumours with greater accuracy compared to conventional brain masking using BET.
Conclusion
Masking for QSM is a significant and unaddressed problem affecting the quality of results, especially in pathology and outside the brain. Echo-dependent masking strategies significantly reduce streaking near the brain boundary. Our two-pass QSM strategy with threshold-based masking works in and outside of the brain, includes more anatomical detail, and further reduces streaking by processing weak and strong sources independently. Our open-source framework integrates our developments, making them widely accessible.Acknowledgements
We thank the participants involved in this study. MB acknowledges funding from Australian Research Council Future Fellowship grant FT140100865 and SR from the Marie Skłodowska-Curie Action MS-fMRI-QSM 794298. This research was conducted by the Australian Research Council Training Centre for Innovation in Biomedical Imaging Technology (project number IC170100035) and funded by the Australian Government. Additional support was provided by the Austrian Science Fund (FWF): 31452 and KLI-646. The authors acknowledge the facilities and scientific and technical assistance of the National Imaging Facility, a National Collaborative Research Infrastructure Strategy (NCRIS) capability, at the Centre for Advanced Imaging, the University of Queensland. We wish to acknowledge QCIF for its support in this research by providing high-performance computing and storage resources.
Kieran O’Brien and Jin Jin are employees of Siemens Healthineers in Australia. The remaining authors declare that the research was conducted in the absence of any commercial or financial relationship that could be construed as a conflict of interest.
References
[1] Ferdinand Schweser, Andreas Deistung, and Jürgen R. Reichenbach. Foundations of MRI phase imaging and processing for Quantitative Susceptibility Mapping (QSM). Zeitschrift für Medizinische Physik, 26(1):6–34, March 2016. doi:10.1016/j.zemedi.2015.10.002.
[2] Lin Chen, Jun Hua, Christopher A. Ross, Shuhui Cai, Peter C. M. van Zijl, and Xu Li. Altered brain iron content and deposition rate in Huntington’s disease as indicated by quantitative susceptibility MRI. Journal of Neuroscience Research, 97(4):467–479, 2019. doi:10.1002/jnr.24358.
[3] Christian Langkammer, Tian Liu, Michael Khalil, Christian Enzinger, Margit Jehna, Siegrid Fuchs, Franz Fazekas, Yi Wang, and Stefan Ropele. Quantitative Susceptibility Mapping in Multiple Sclerosis. Radiology, 267(2):551–559, May 2013. doi:10.1148/radiol.12120707.
[4] Weiwei Chen, Susan A. Gauthier, Ajay Gupta, Joseph Comunale, Tian Liu, Shuai Wang, Mengchao Pei, David Pitt, and Yi Wang. Quantitative Susceptibility Mapping of Multiple Sclerosis Lesions at Various Ages. Radiology, 271(1):183–192, November 2013. doi:10.1148/radiol.13130353.
[5] Sarah Eskreis-Winkler, Kofi Deh, Ajay Gupta, Tian Liu, Cynthia Wisnieff, Moonsoo Jin, Susan A. Gauthier, Yi Wang, and Pascal Spincemaille. Multiple Sclerosis lesion geometry in quantitative susceptibility mapping (QSM) and phase imaging. Journal of Magnetic Resonance Imaging, 42(1):224–229, 2015. doi:10.1002/jmri.24745.
[6] Ferdinand Schweser, Ana Luiza Raffaini Duarte Martins, Jesper Hagemeier, Fuchun Lin, Jannis Hanspach, Bianca Weinstock-Guttman, Simon Hametner, Niels Bergsland, Michael G. Dwyer, and Robert Zivadinov. Mapping of thalamic magnetic susceptibility in multiple sclerosis indicates decreasing iron with disease duration: A proposed mechanistic relationship between inflammation and oligodendrocyte vitality. NeuroImage, 167:438–452, February 2018. doi:10.1016/j.neuroimage.2017.10.063.
[7] Scott Ayton, Amir Fazlollahi, Pierrick Bourgeat, Parnesh Raniga, Amanda Ng, Yen Ying Lim, Ibrahima Diouf, Shawna Farquharson, Jurgen Fripp, David Ames, James Doecke, Patricia Desmond, Roger Ordidge, Colin L. Masters, Christopher C. Rowe, Paul Maruff, Victor L. Villemagne, the Australian Imaging Biomarkers and Lifestyle (AIBL) Research Group, Olivier Salvado, and Ashley I. Bush. Cerebral quantitative susceptibility mapping predicts amyloid-β-related cognitive decline. Brain, 140(8):2112–2119, August 2017. doi:10.1093/brain/awx137.
[8] Netherlands Brain Bank, Solveig Tiepolt, Andreas Schäfer, Michael Rullmann, Elisabeth Roggenhofer, Hermann-Josef Gertz, Matthias L. Schroeter, Marianne Patt, Pierre-Louis Bazin, Thies H. Jochimsen, Robert Turner, Osama Sabri, and Henryk Barthel. Quantitative Susceptibility Mapping of Amyloid-β Aggregates in Alzheimer’s Disease with 7T MR. Journal of Alzheimer’s Disease, 64(2):393–404, June 2018. doi:10.3233/JAD-180118.
[9] Julio Acosta-Cabronero, Arturo Cardenas-Blanco, Matthew J. Betts, Michaela Butryn, Jose P. Valdes-Herrera, Imke Galazky, and Peter J. Nestor. The whole-brain pattern of magnetic susceptibility perturbations in Parkinson’s disease. Brain, 140(1):118–131, January 2017. doi:10.1093/brain/aww278.
[10] Christian Langkammer, Lukas Pirpamer, Stephan Seiler, Andreas Deistung, Ferdinand Schweser, Sebastian Franthal, Nina Homayoon, Petra Katschnig-Winter, Mariella Koegl-Wallner, Tamara Pendl, Eva Maria Stoegerer, Karoline Wenzel, Franz Fazekas, Stefan Ropele, Jürgen Rainer Reichenbach, Reinhold Schmidt, and Petra Schwingenschuh. Quantitative Susceptibility Mapping in Parkinson’s Disease. PLOS ONE, 11(9):e0162460, September 2016. doi:10.1371/journal.pone.0162460.
[11] Ramin Jafari, Sujit Sheth, Pascal Spincemaille, Thanh D. Nguyen, Martin R. Prince, Yan Wen, Yihao Guo, Kofi Deh, Zhe Liu, Daniel Margolis, Gary M. Brittenham, Andrea S. Kierans, and Yi Wang. Rapid automated liver quantitative susceptibility mapping. Journal of Magnetic Resonance Imaging, 50(3):725–732, 2019. doi:10.1002/jmri.26632.
[12] Samir D. Sharma, Diego Hernando, Debra E. Horng, and Scott B. Reeder. Quantitative susceptibility mapping in the abdomen as an imaging biomarker of hepatic iron overload. Magnetic Resonance in Medicine, 74(3):673–683, 2015. doi:10.1002/mrm.25448.
[13] Sina Straub, Julian Emmerich, Heinz-Peter Schlemmer, Klaus H. Maier-Hein, Mark E. Ladd, Matthias C. Röthke, David Bonekamp, and Frederik B. Laun. Mask-Adapted Background Field Removal for Artifact Reduction in Quantitative Susceptibility Mapping of the Prostate. Tomography, 3(2):96–100, June 2017. doi:10.18383/j.tom.2017.00005.
[14] Hongjiang Wei, Russell Dibb, Kyle Decker, NianWang, Yuyao Zhang, Xiaopeng Zong, Weili Lin, Daniel B. Nissman, and Chunlei Liu. Investigating magnetic susceptibility of human knee joint at 7 Tesla. Magnetic Resonance in Medicine, 78(5):1933–1943, 2017. doi:10.1002/mrm.26596.
[15] Stephen M. Smith. Fast robust automated brain extraction. Human Brain Mapping, 17(3):143–155,2002. doi:10.1002/hbm.10062.
[16] Hongjiang Wei, Russell Dibb, Yan Zhou, Yawen Sun, Jianrong Xu, Nian Wang, and Chunlei Liu. Streaking artifact reduction for quantitative susceptibility mapping of sources with large dynamic range. NMR in Biomedicine, 28(10):1294–1303, 2015. doi:10.1002/nbm.3383.
[17] Korbinian Eckstein, Barbara Dymerska, Beata Bachrata, Wolfgang Bogner, Karin Poljanc, Siegfried Trattnig, and Simon Daniel Robinson. Computationally Efficient Combination of Multichannel Phase Data From Multi-echo Acquisitions (ASPIRE). Magnetic Resonance in Medicine, 79(6):2996–3006, 2018. doi:10.1002/mrm.26963.
[18] José P. Marques, Christian Langkammer, Jakob Meineke, Carlos Milovic, Berkin Bilgic, and Ferdinand Schweser. QSM Reconstruction Challenge 2.0, 2019. listsnu.org/qsm-challenge.
[19] Christian Langkammer, Kristian Bredies, Benedikt A.Poser, Markus Barth, Gernot Reishofer, Audrey Pei-wen Fan, Berkin Bilgic, Franz Fazekas, Caterina Mainero, and Stefan Ropele. Fast quantitative susceptibility mapping using 3D EPI and total generalized variation. NeuroImage, 111:622–630, May 2015. doi:10.1016/j.neuroimage.2015.02.041.
[20] Emma Biondetti, Anita Karsa, David L Thomas, and Karin Shmueli. Investigating the accuracy and precision of TE-dependent versus multi-echo QSM using Laplacian-based methods at 3T. Magnetic Resonance in Medicine, 2020. doi:10.1002/mrm.28331.
[21] Andrew L. Janke and Jeremy F. P. Ullmann. Robust methods to create ex vivo minimum deformation atlases for brain mapping. Methods, 73, February 2015. doi:10.1016/j.ymeth.2015.01.005.
Figures