3956
Optimization of the Nominal Flip Angle in Actual Flip Angle Imaging Using Phase Difference Information1Division of Ultrahigh Field MRI, Institute for Biomedical Sciences, Iwate Medical University, Iwate, Japan, 2Global MR Applications and Workflow, GE Healthcare Japan, Hino, Japan
Synopsis
Flip angles (FAs) might be underestimated during the actual FA imaging (AFI) method due to the aliasing phenomenon that occurs when the actual FAs exceeds 90°. To optimize nominal FA values for the AFI scan performed at 7 T, at which in-plane FA values markedly vary, we attempted to detect pixels showing erroneous FAs by comparing the phase difference between two types of AFI source images. AFI-FA maps with nominal FAs of ≥ 60° include substantial areas with FA underestimation, which is unsuitable for accurate FA measurements.
Introduction
The actual flip angle imaging (AFI) 1, which consists of images with two types of repetition times (TRs), i.e., TR1 and TR2, can rapidly measure distribution of flip angles (FAs) on MR images with high accuracy, particularly when using the highest nominal FA values. However, when the value of actual FAs exceeds 90° on the TR1 and/or TR2 images, the FAs might be underestimated as longitudinal magnetization reduces inversely when the value of FAs exceeds 90° (an aliasing phenomenon), indicating that optimization of the nominal FA is crucial for accurate FA mapping while using the AFI method. The optimization appears difficult particularly at 7 T because the FA distribution within images markedly vary mainly due to marked B1+ heterogeneity 2. Hence, in this study we attempt to optimize the nominal FA value for the AFI method at 7 T by detecting the aliasing phenomenon using phase difference information of the TR1 and TR2 images.Methods
We used a 7 T MRI scanner (Discovery MR950; GE Healthcare, Waukesha, WI, USA) with a two-channel transmission and 32-channel receive head coil system (NM008-32-7GE-MR950; Nova Medical, Wilmington, MA, USA). This study was approved by the Institutional Ethics Committee (H25-53).Phantom experiment and volunteer scan
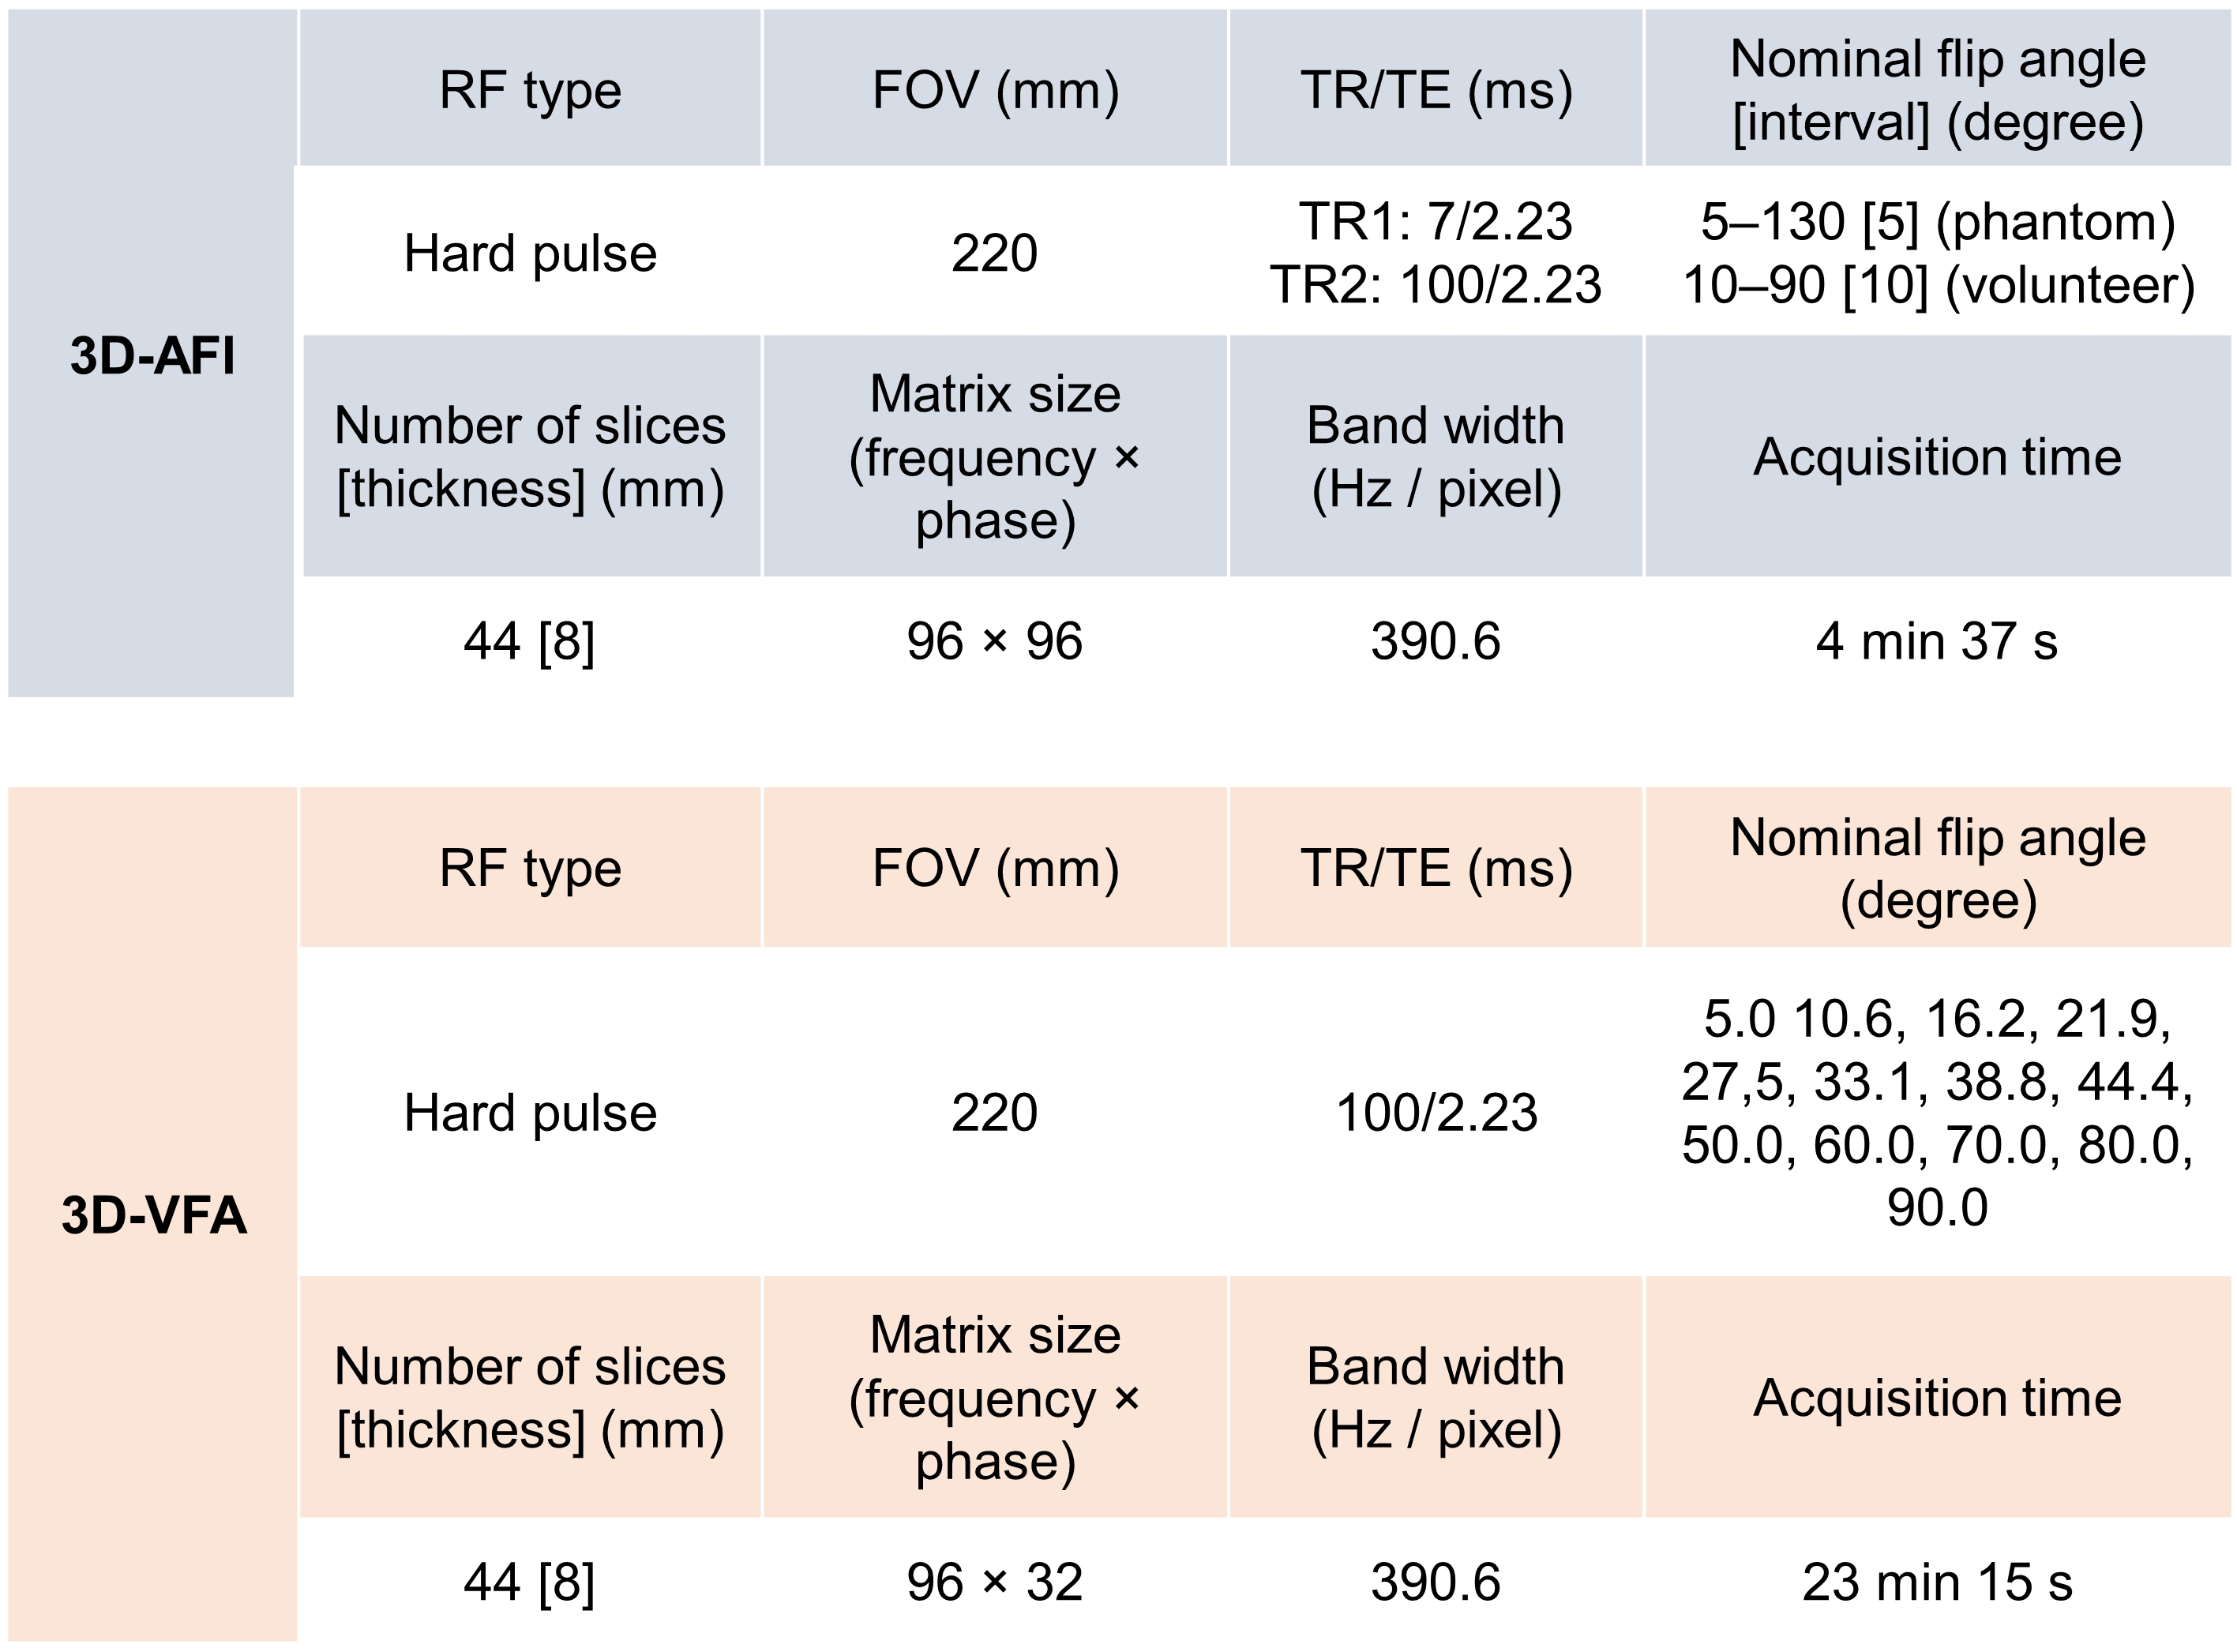
We performed three dimensional (3D) AFI scans of a 16 cm sphere phantom which contained agarose with a T1 value of 1591 ms with nominal FA values of 5 to 130° (Table 1). In addition, to determine the truth FA values, we performed time-consuming 3D variable FA (VFA) scans with nominal values of FA of 5 to 90° (Table 1). Further, one healthy subject underwent a 3D AFI head scan with nominal values of FA of 10 to 90° (Table 1) after obtaining a written consent.
Image Analyses
We generated FA maps of the phantom from the data obtained using the AFI and VFA methods. In addition, absolute differences in phase between the TR1 and TR2 images of the AFI method were calculated. Then, we analyzed the relationships between FA and phase-difference values of the AFI method with the FA values of the VFA method and determined the threshold of the phase difference causing the aliasing phenomenon. In addition, using the threshold value obtained, we generated error maps that indicate pixels having aliased or unmeasurable FA values. Furthermore, we generated FA maps of the volunteer head from the AFI data and obtained error maps using the threshold of the phase difference.
Results
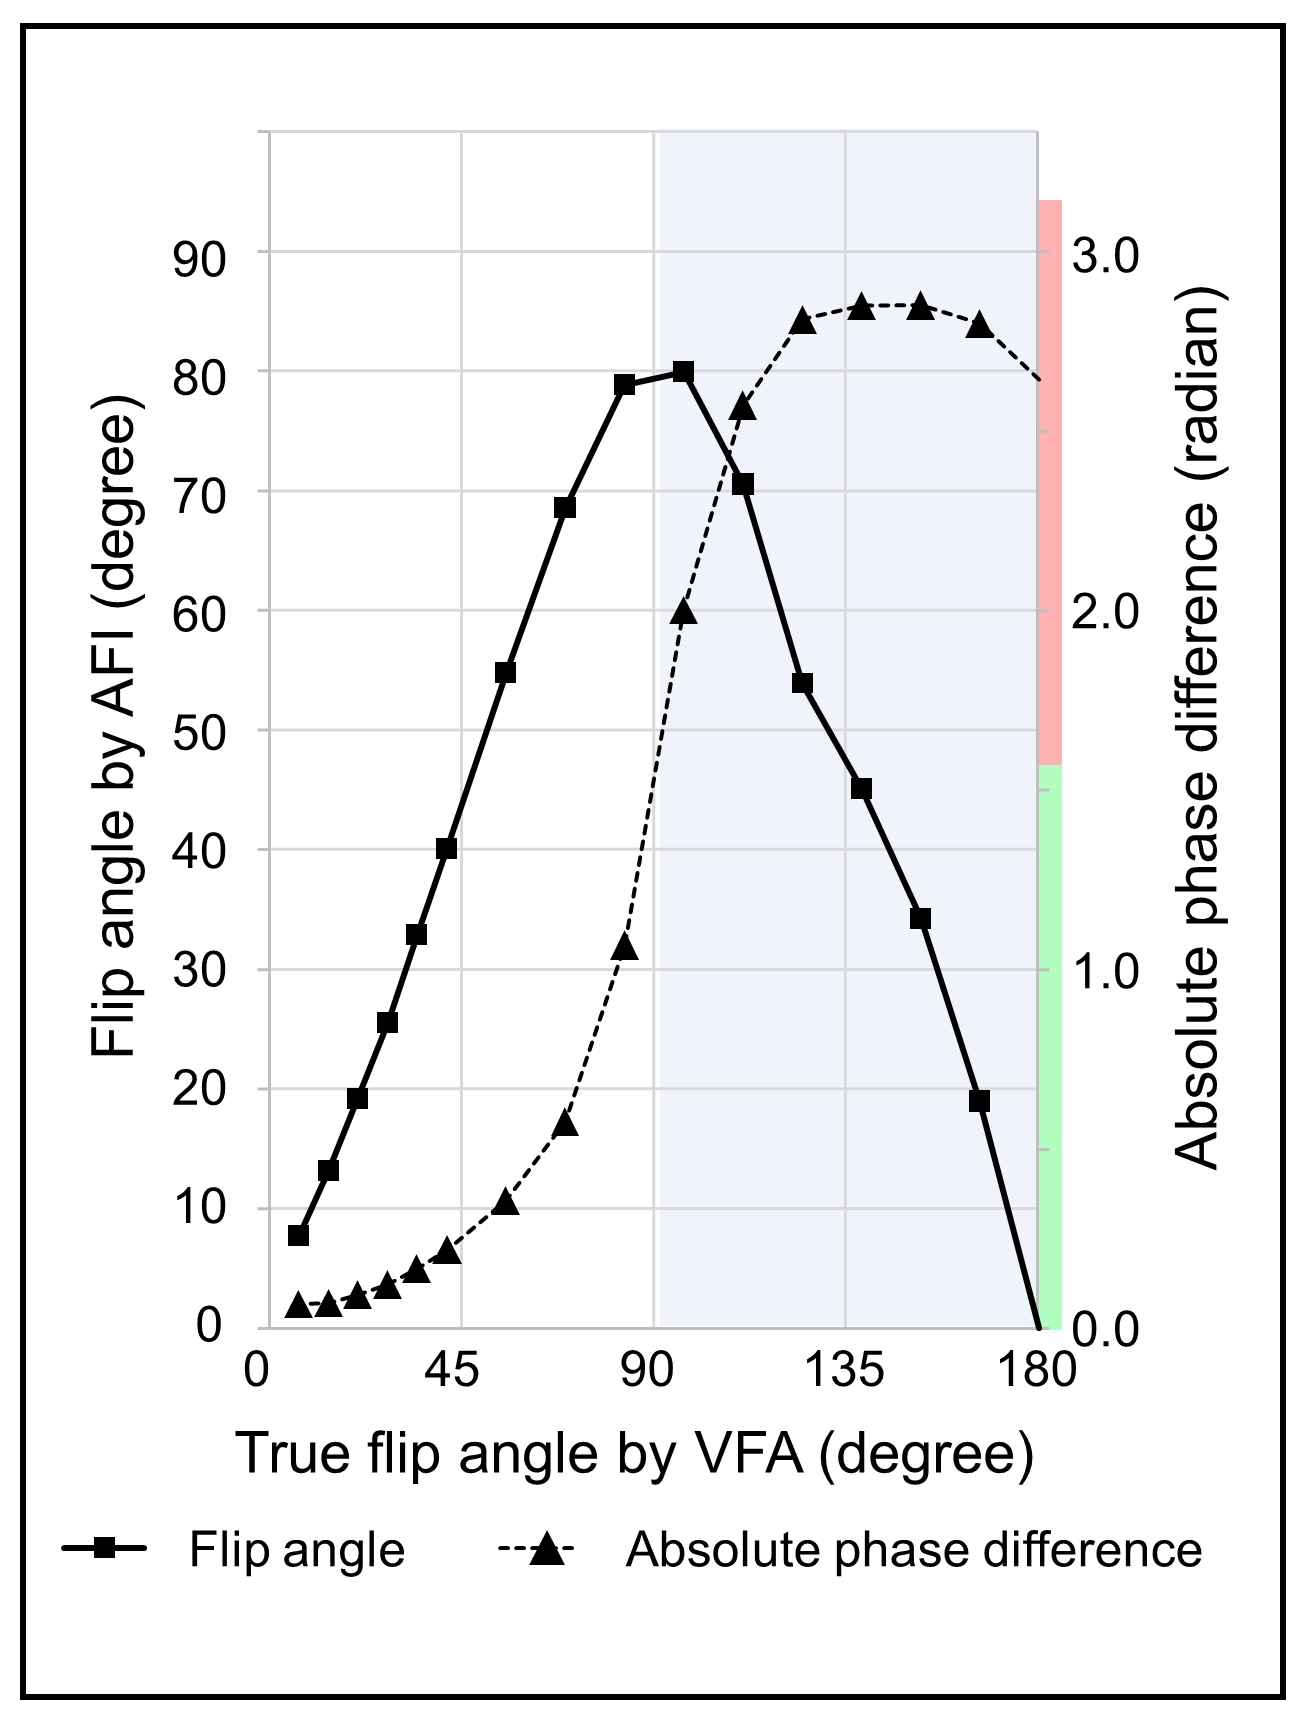
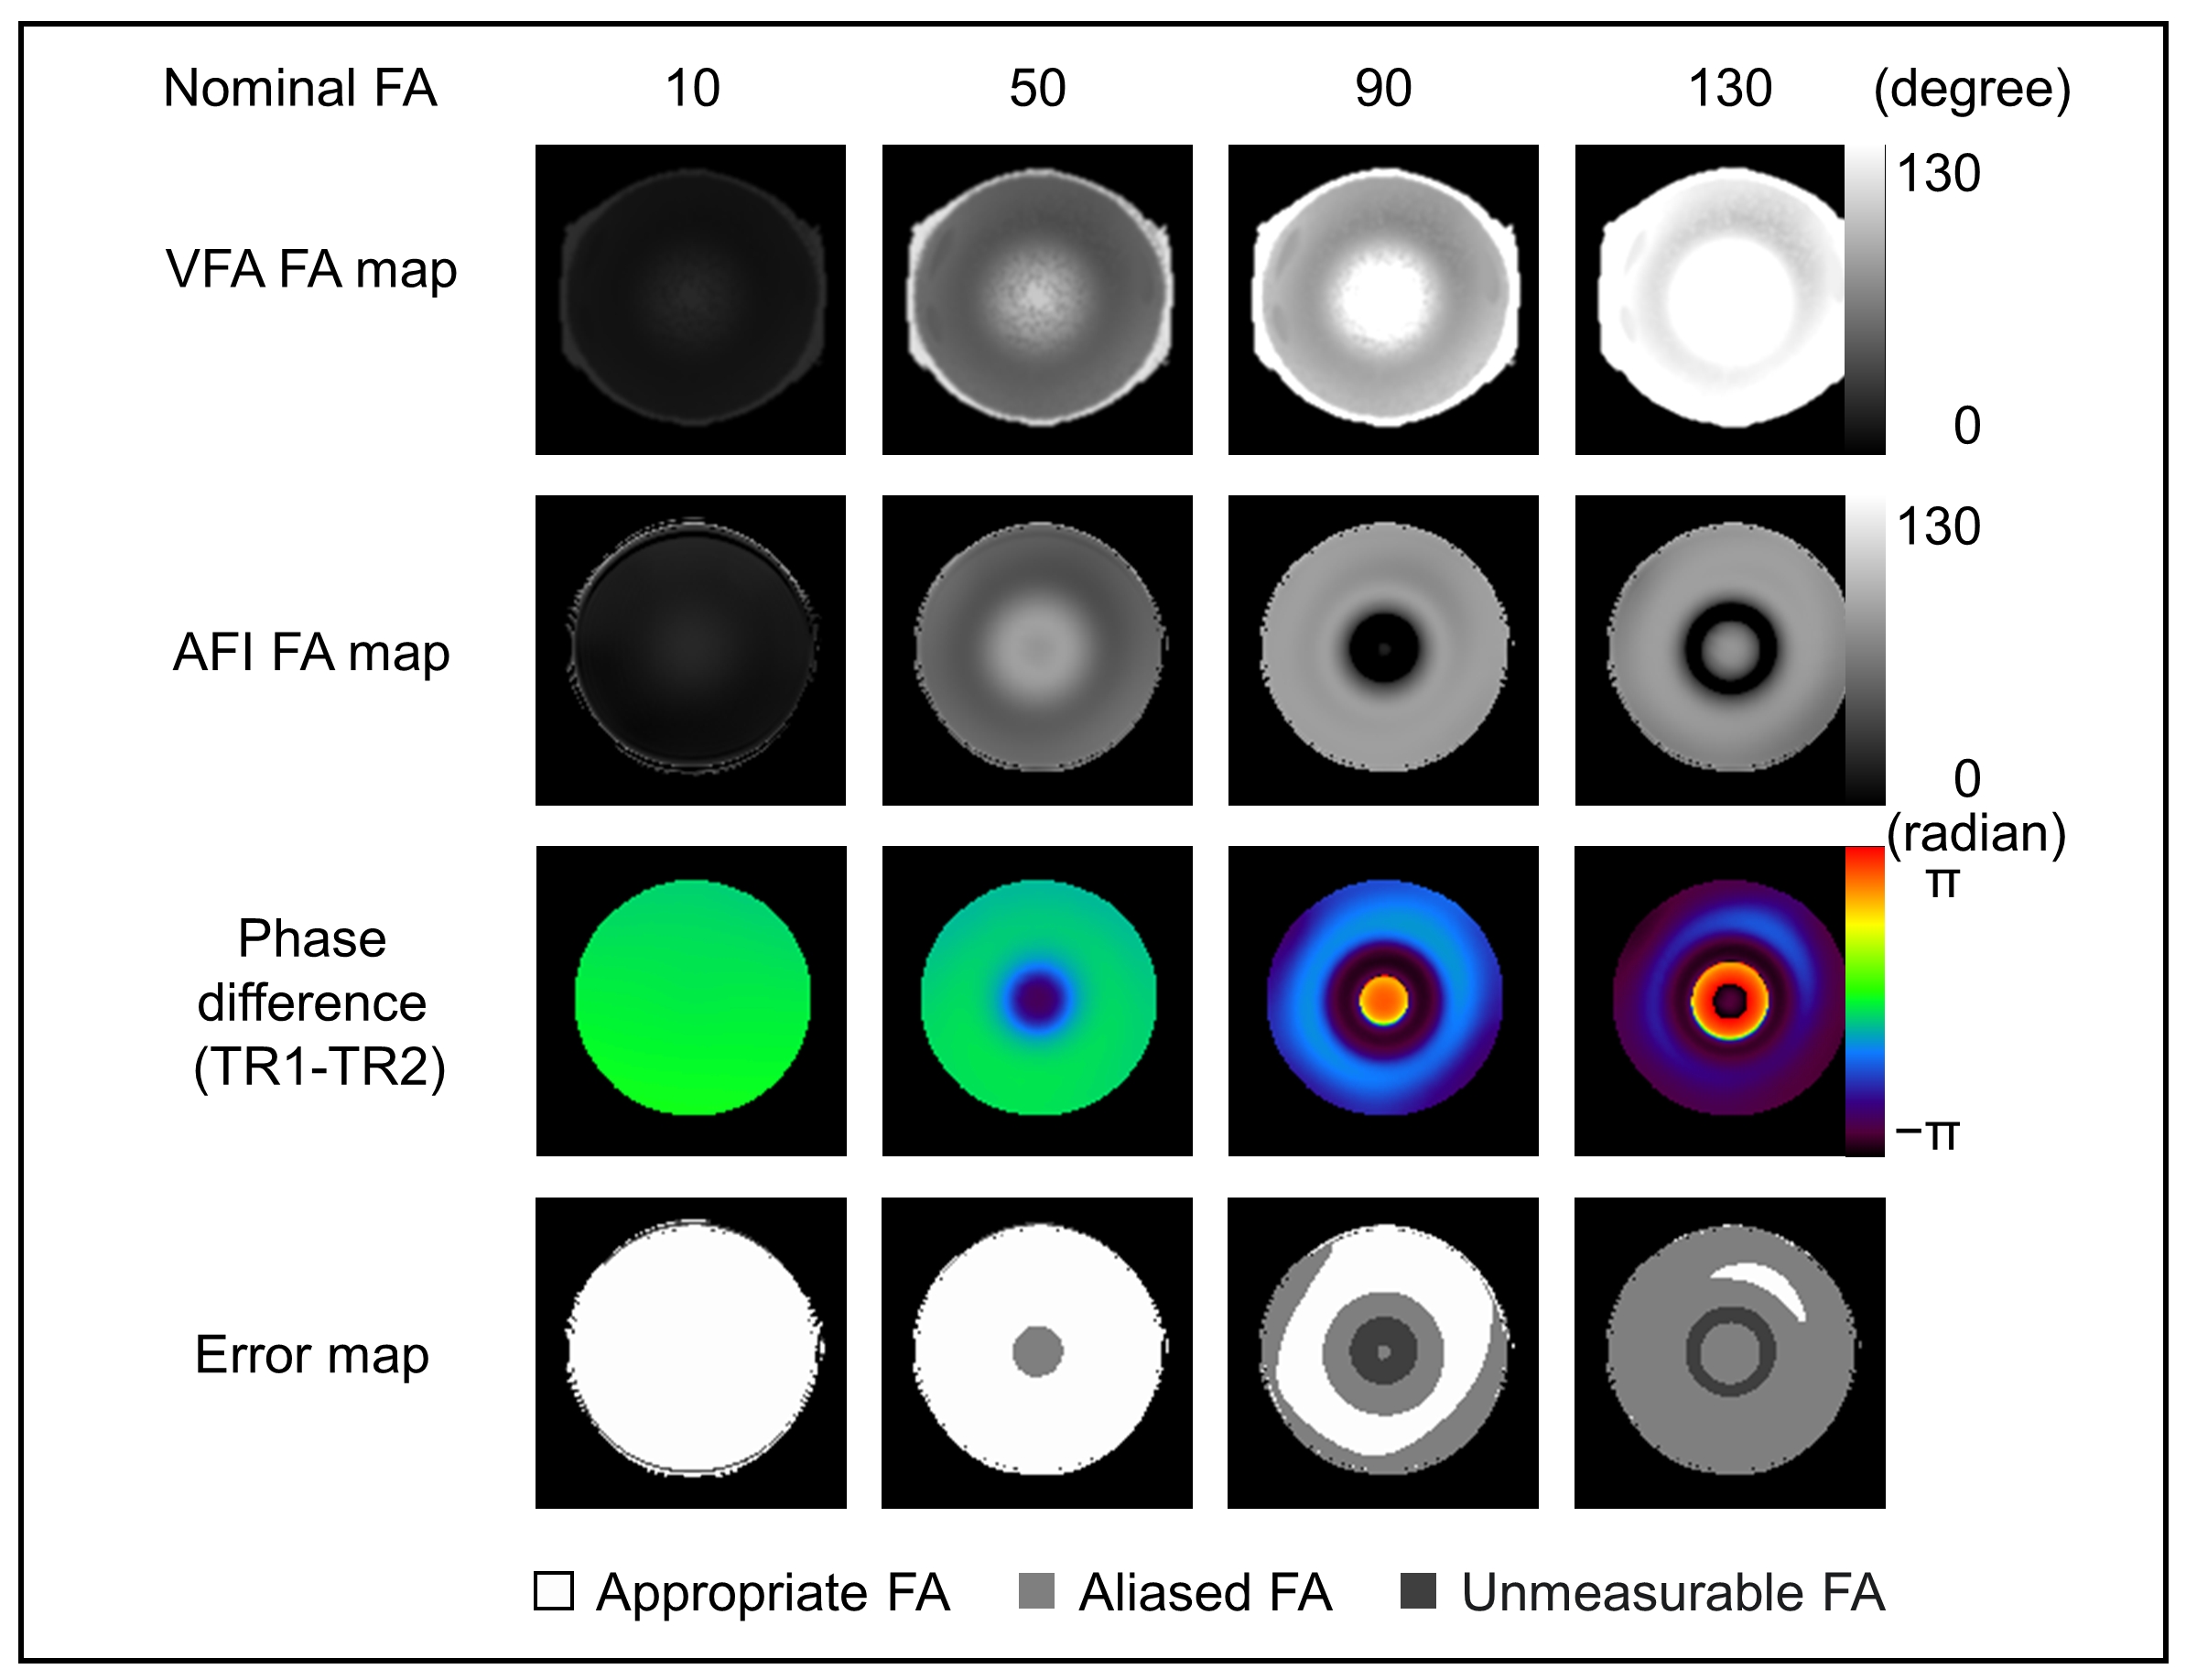
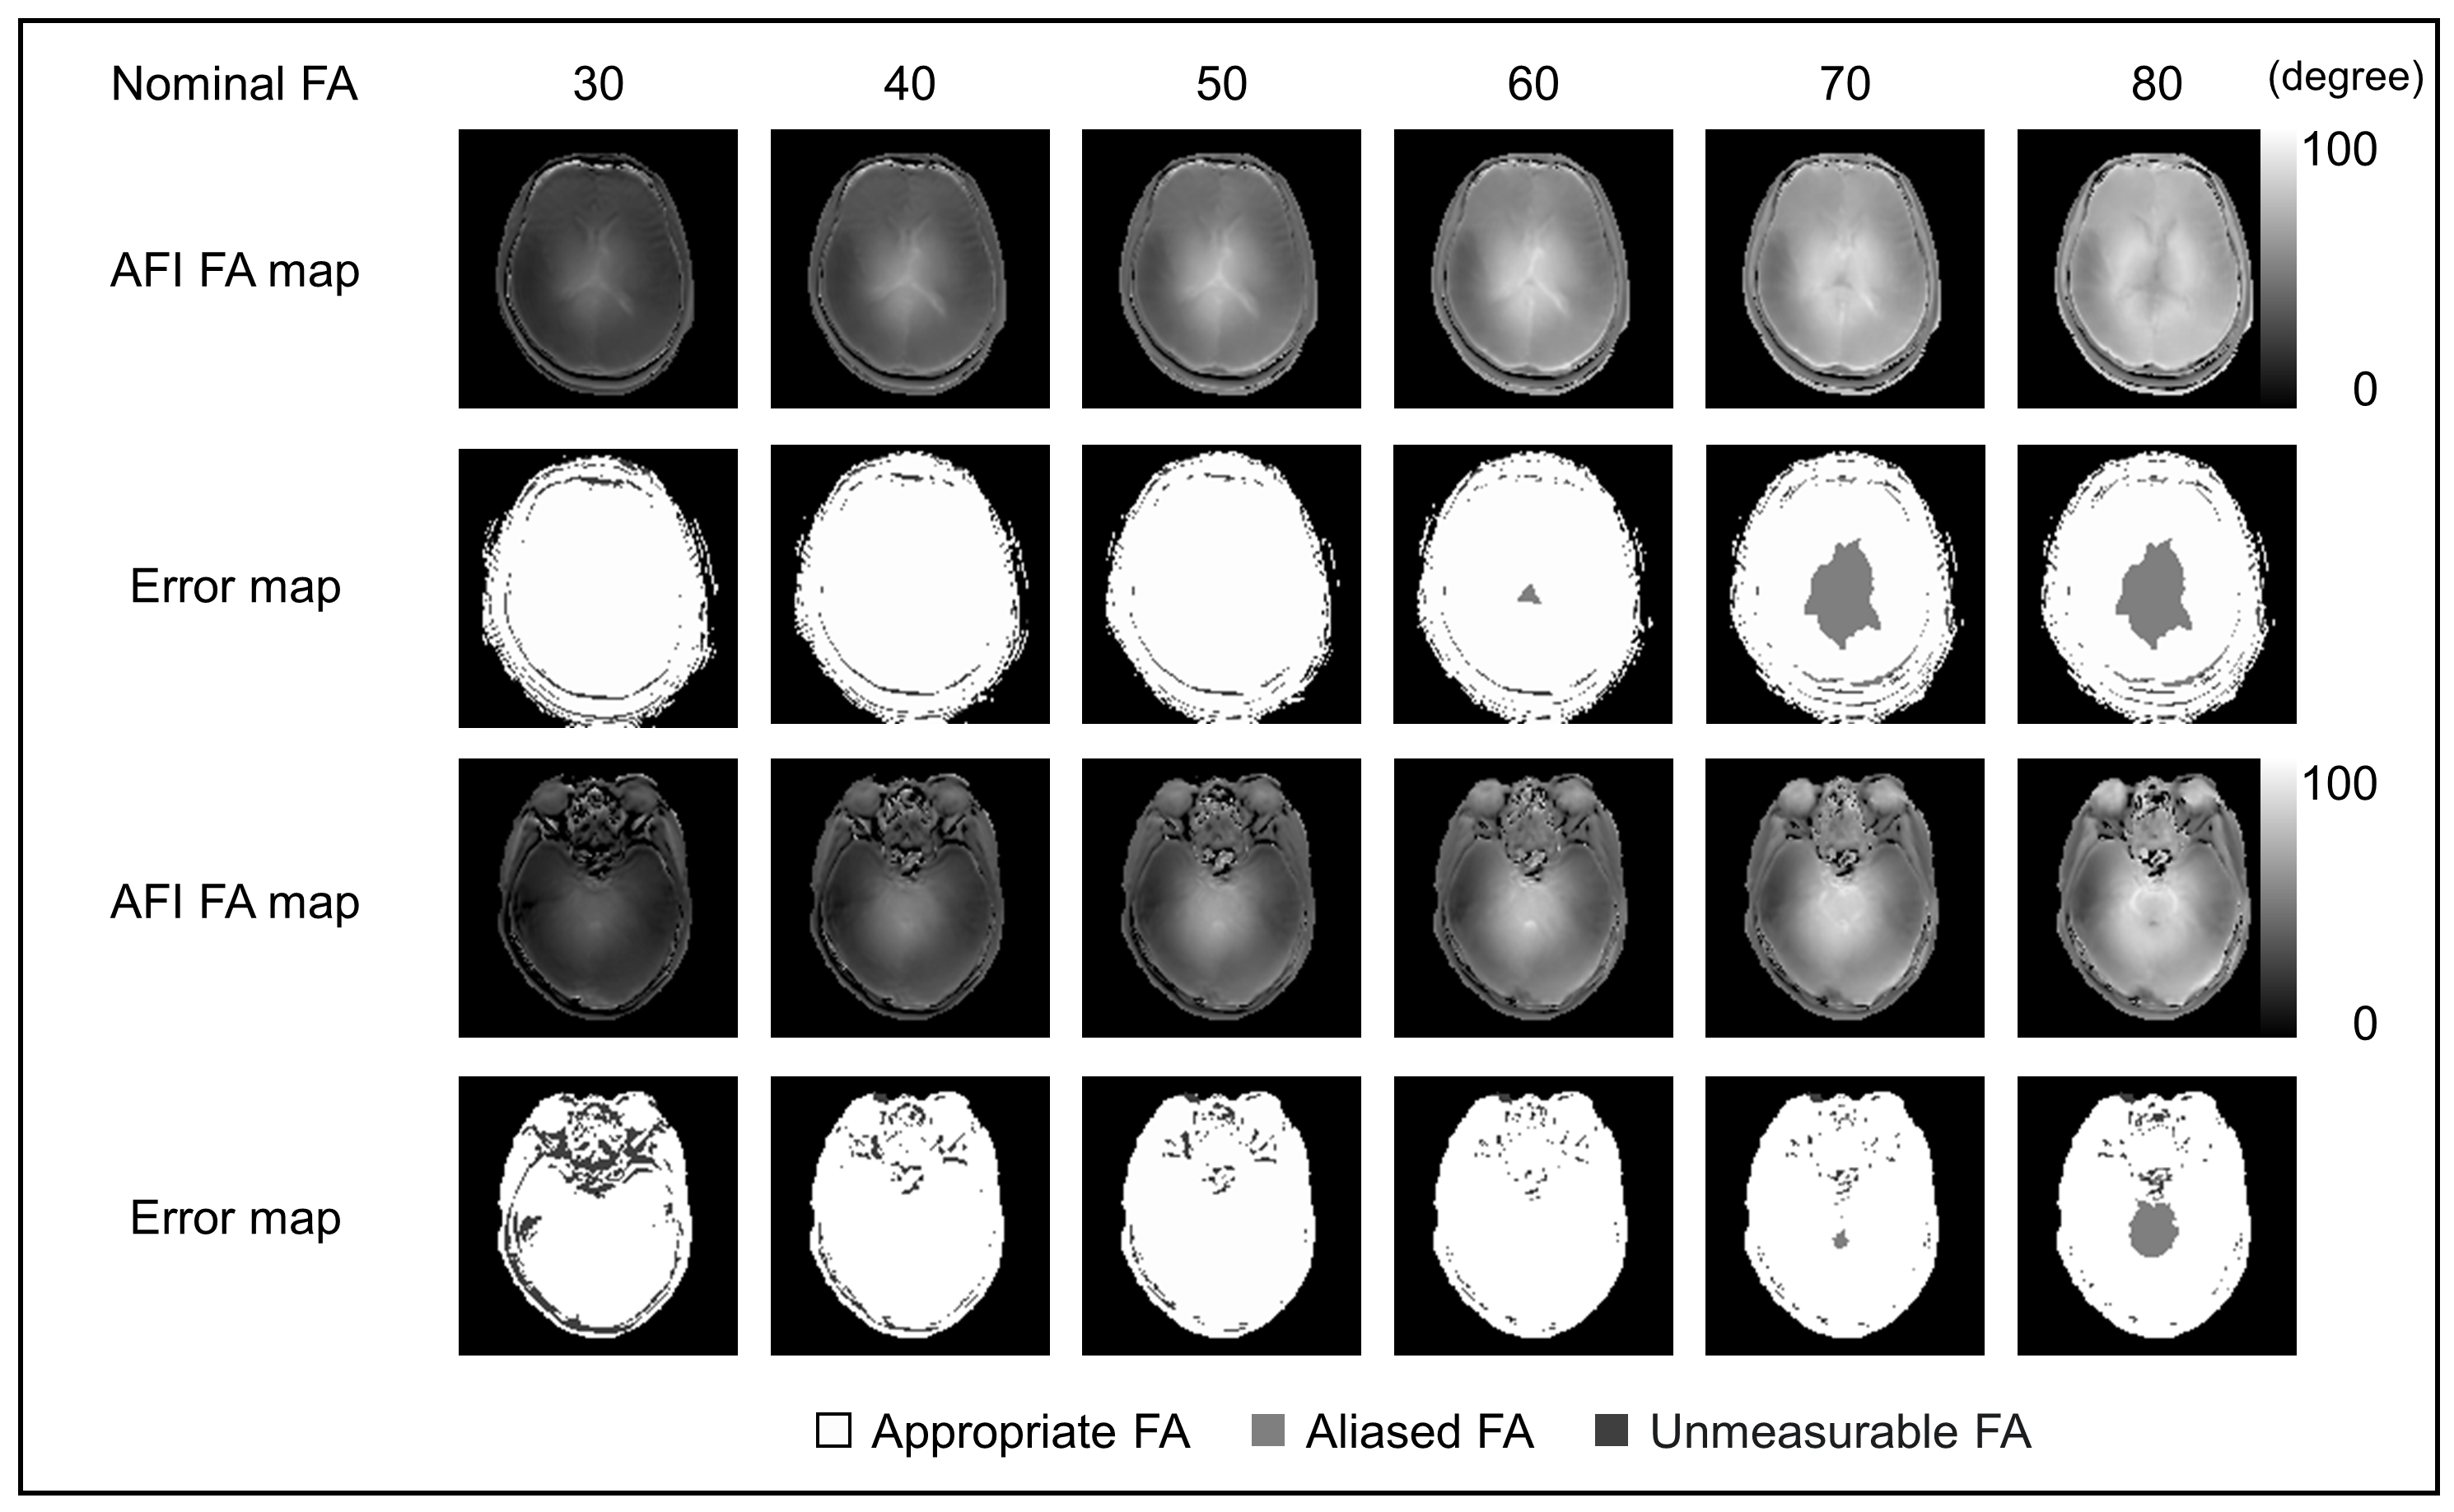
In the phantom study, the aliasing phenomenon was observed in FA maps by the AFI method when the true FA value using the VFA method was more than 90° (Fig. 1). In addition, the differences in phase between the TR1 and TR2 increased with the true FA values. Furthermore, we found that the half value of the maximum phase difference, i.e., 1.6 rad, can be used as a threshold for predicting the aliasing phenomenon (Fig. 1). On the FA maps of the phantom, the FA distribution obtained by the AFI method was remarkably different from that by the VFA method (Fig. 2). On the error maps generated by applying 1.6 rad as the threshold of the phase difference, a small aliased FA area was found at the center of the image with the nominal FA of 50°. In addition, substantial aliased or unmeasurable FA areas were observed when the nominal FAs were 90 to 130° (Fig. 2). On the AFI-FA maps of the volunteer, the aliasing phenomenon was visually evident when the nominal FAs exceeded 70° (Fig. 3). In addition, the aliased FA areas were detected on the error maps when the nominal FA values were 60° or greater (Fig. 3).Discussion
We successfully detected pixels showing erroneous FAs due to the aliasing phenomenon in the AFI images of the human head at 7 T by determining the threshold for this purpose using the phase difference between the TR1 and TR2 of the phantom. These results revealed that nominal FA values of ≥ 60° are unsuitable for the AFI scan, suggesting that the highest FA values under 60° should be selected for accurate FA measurement during the AFI method at 7 T. Optimization of the nominal FA values using this method may contribute to the improvement of the B1+ field mapping in parallel transmission systems as well as concentration correction of MR spectroscopy and chemical exchange saturation transfer imaging. However, this method has a limitation that full echo sampling is mandatory to calculate the phase information, resulting in being sensitive to magnetic susceptibility.Conclusions
The phase difference between the two types of AFI images can be used to detect pixels that cause the aliasing phenomenon. This method is considered helpful to optimize nominal FAs of the AFI method for accurate measurement of FA distribution at 7 T.Acknowledgements
This work was partly supported by JSPS KAKENHI (18H00483).References
1. Yarnykh VL. Actual flip-angle imaging in the pulsed steady state: A method for rapid three-dimensional mapping of the transmitted radiofrequency field. Magn Reson Med 2007; 57:192-200.
2. Hoult DI, Phil D. Sensitivity and power deposition in a high-field imaging experiment. J Magn Reson Imaging 2000; 12:46-67.
Figures